Quality of education in Argentina: determinants and distribution using PISA 2000 test scores
29
0
0
Texto completo
(2)
(3) WELL-BEING AND SOCIAL POLICY VOL 3, NUM. 1, pp. 69-95. QUALITY OF EDUCATION IN ARGENTINA: DETERMINANTS AND DISTRIBUTION USING PISA 2000 TEST SCORES Maria Emma Santos*. Department of Economics, Universidad Nacional del Sur- CONICET [email protected]. Abstract n this paper we study the determinants and distribution of learning outcomes in Argentina I measured by PISA 2000 reading and math test scores. To do that, we estimate education production functions at the mean of the distribution using survey regressions and at different parts of the score 's distribution with quantile regressions. In terms of educational policy aimed at improving learning outcomes, results point that educational policies should address gender issues, since girls perform significantly better than boys in reading but boys perform significantly better than girls in math. The availability of educational resources at borne and good reading habits also contribute significantly to student's better performance. Class size should not be excessive; schools should be provided with good-quality educational resources such as good libraries, laboratory equipment and multi-media technology. Teachers' commitment and engagement to their work, their relationships with students and their openness to institutional change are also very significant determinants of students ' performance. The recently sanctioned law of education in Argentina addresses many of these issues in the direction proposed in this paper. — Key words: education quality, learning outcomes' determinants, learning outcomes' distribution, PISA test scores, Argentinean schools. Classification JEL: 121.. Introduction he results of the Program for International Student Assessment (PISA from now on) 2000, an T intemationally standardized assessment done to 15-years-olds which has been developed by the Organization for Economic Cooperation and Development (OECD) and the United Nations Educational, Scientific and Cultural Organization (UNESCO), indicate that, while relatively well positioned within the Latin American countries, the average performance of Argentinean students. * I am thankful for the financial support provided by the Inter-American Conference on Social Security (CISS) to attend the Conference on The Quality of Education in Latin America and the Caribbean, Mexico City, February 2-3, 2007, where this paper was presented.. 69.
(4) QUALITY OF EDUCATION IN ARGENTINA: DETERM1NANTS AND OISTRIBUTION USING PISA 2000 TEST SCORES. is at the lower end of the distribution of the average score of all participating countries. Argentina took the 33' place in the reading ranking, 34' in math and 3 r in science over 41 countries.' Increasing the country's average human capital stock is an objective of every developing country both because it is an end of development in itself (Sen, 1999) and because it is a mean to other desired outcomes such as economic growth. This paper intends to analyze which are the determinants of school quality in Argentina and how do those determinants behave along the scores' distribution. Identifying the most important determinants of cognitive skills is the first step for an effective design of educational policies aimed at improving the quality of education. Argentina has gone through a strong criticism of its educational system for the last decade. Thirteen years after the educational reforme, the system seems to fail in providing good quality education. A new national law of education has been sanctioned very recently3 with some specific guidelines about policies of promotion of educational equality and policies to improve the quality of education. Some of these guidelines coincide with the conclusions drawn here. However, the effectiveness of the law at improving the quality of education in Argentina will depend on the specific policies that will be designed to implement it. In this context, this paper's results may provide hints for the design of educational policies. While there is a broad literature on the determinants of cognitive skills or school quality for developed countries, research in this area for developing countries is much more recent dueto the lack of data on cognitive test scores in the past. In particular, in the case of Argentina, PISA 2000 provides one of the first comprehensive and international comparable dataset on the quality of education in the country.4 This paper contributes to the literature in two ways: 1) by using quantile regressions it allows the effect of the determinants of cognitive skills to vary along the test scores' distribution, which will in turn indicate if differential educational policies are needed at each of the segments of the distribution; 2) it adds empirical evidence to rationalize the discussion on the quality of education in Argentina and the possible policy paths to take. Section 1 presents the dataset. Section 2 briefly discusses previous literature on determinants of school quality with special emphasis on papers that have used PISA 2000 dataset. Section 3 introduces the model and empirical approach. Section 4 presents the results and, finally, section 5 provides the policy implications and concluding remarks. 1 The other Latin American countries that took part in PISA 2000 are Brazil, Chile, Mexico and Peru. In the reading and math score Argentina is at the top of the five while in the science's score is below Mexico and Chile but aboye Brazil and Peru. The Educational Reform was introduced in 1993 with the Federal Law of Education (Law N° 24 195) It is Law N° 26 206, sanctioned on December 14, 2006. 4 Other international assessments in which Argentina has participated are the Trends in International Math and Science Study (TIMSS), conducted in 1995 by the Lynch School of Education at Boston College and the International Association for the Evaluation of Educational Achievement (IEA) to test eighth graders; the Latin American Laboratory for the Assesment of Education Quality (LLECE), conducted in 1997 by UNESCO's Oficina Regional de Educación para América Latina y el Caribe (OREALC), to test language and math abilities of third and fourth graders; the Progress in International Reading Literacy Study (PIRLS), conducted in 2001 by the IEA, to test the reading performance of fourth graders, and the Second Comparative Study of the Latin American Laboratory for Assessment of Education Quality (SERCE), conducted in 2005 by UNESCO/OREALC to test language and math abilities of third graders, and language, math and natural science abilities of sixth graders. At the National level, there have been assessment programs at the primary levet conducted by the Sistema Nacional de Evaluación de la Calidad Educativa (SINEC) since 1993, and assessment programa at both the primary and secondary levet conducted by the Dirección Nacional de Información y Evaluación de la Calidad Educativa (DINIECE) since 1997.. 70.
(5) WELL-BEING AND SOCIAL POLICY VOL 3, NUM. 1, pp. 69-95. 1. PISA 2000 Dataset PISA is an intemationally standardized assessment of three forms of literacy: reading, mathematics and science. The programme has been developed by OECD and UNESCO with the objective of measuring how well 15-year-olds, approaching the end of compulsory schooling, are prepared to meet the challenges of today's society. The first assessment, in which 43 countries participated including Argentina, was implemented in 2000.5 Since then, the programme has been administered every three years. Argentina did not participate in the 2003 round and the results of the 2006 round are still not available. Therefore, for this paper we use PISA's 2000 results. The PISA target population is defined in tenns of age and not in tenns of grade levet to allow cross-country comparisons. Specifically, PISA assesses students who are between 15 years and 3 (complete) months and 16 years and 2 (complete) months at the beginning of the assessment period and who are enrolled in an educational institution, regardless of the grade levels or type of institution in which they are enrolled. However, 15-years-old enrolled in Grade 6 or lower were excluded from PISA 2000 (OECD, 2003a).' PISA 2000 assessment placed the main focus on reading literacy. That is why all students participating in PISA 2000 were assessed in reading literacy, and only one out of two were assessed in mathematics and science. Therefore the math and science sampler are about half of the reading sample. In this paper we present the estimates of the education production function for reading and math. Reading literacy is evaluated in three different aspects: retrieving ability tests student's ability to locate information in a text, interpreting ability tests the ability to construct meaning and draW inferences from written information and the reflection and evaluation ability tests student's ability to relate text to their knowledge, ideas and experience. The performance on these three arcas is reponed separately and also in a combined reading literacy scale (OECD, 2003a). PISA processes test scores in two different ways. One of them is based on the item response theory. The scores are weighted averages of the correct responses to all questions of a specific category (for example reading) where the weight is determined by the difficulty of the question. This procedure follows Warm (1989)'s Weighted Likelihood Estimate. The Warm (1989) method makes the actual score that the student attained, the most likely (OECD, 2002, ch. 9). The weighted likelihood estimates are best suited when studying individual student's proficiency. The other procedure followed by PISA consists of calculating plausible values, which are random numbers drawn from the distribution of scores that could be reasonably assigned to each individual. Plausible values are better suited for describing the performance of a population (OECD 2000). For this paper we use as our dependent variable the Warm (1989) estimate of the combined reading literacy score and of the math score. The 43 countries are the following OECD member countries: Australia, Austria, Belgium, Canada, The Czech Republic, Denmark, Finland, France, Germany, Greece, Hungary, Iceland, Ireland, Italy, Japan, Korea, Luxembourg, Mexico, the Netherlands, New Zealand, Norway, Poland, Portugal, Spain, Sweden, Switzerland, the United Kingdom and the United States; and the following non-OECD countries: Albania, Argentina, Brazil, Bulgaria, Chile, Hong Kong-China, Indonesia, Israel, Latvia, Liechtenstein, FYR Macedonia, Peru, Rumania, the Russian Federation, Thailand. Argentina was one of the three countries in which there were students in such conditions (4%). 5. 71.
(6) QUALITY OF EDUCATION IN ARGENTINA: DETERMINANTS AND DISTRIBUTION USING PISA 2000 TEST SCORES. The total sample size for Argentina is of 3 983 students and 156 schools. Each student has an assocíated population weight which, in simple terms, is the inverse of the probability of being included in the sample dueto sample design. PISA followed a two-stage stratified sample design in each country. The first stage consisted of sampling individual schools in which 15-year-old students were enrolled (schools were sampled with probabilities proportí onal to size). In a second stage, students were sampled within each school. The sum of the weighted sample equals the total targeted population which, for the case of Argentina, equals 512 687 students that represent 98% of the national enrolled population of 15-years-old.7 Students participating in the PISA programme complete a very comprehensive questionnaire regarding family background characteristics and school characteristics. Apart from this, more information on school characteristics is collected through a questionnaire completed by school principals. In the case of Argentina, the PISA dataset has a severe problem of missing values for virtually all variables (except the test score, gender, grade and age). Comparatively, school-level variables have a relatively higher number of missing values than the family and student-levet variables. Due to the missing data problem, the sample size used in the reading regressions is of 2 147 students from 72 schools, and the sample size used in the math regressions ís of 1 218 students (from a total of 2 226 students tested in math) from 77 schools. The missing values are not random. They correspond to students that have, on average, a poorer academie performance.8 The fact that the missing values are not random will cause bias in the estimation of the education production function. However, most of the typical ways to handle missing data are as problematic as ignoring the missing data observations and in this case are not feasible to implernent.9. 2. Education's Quality Determinants in the Líterature 2.1 The education production function approach The determinants of school quality have traditionally been studied with the education production function approach in which standardized test scores are the dependent variable and different. For more information on sampling methodologies see OECD (2002) and OECD (2003a). The mean reading score of the students with complete data on die variables of the model used is 456.6 points and the standard deviation is 3.4, while the mean reading score of the students with missing data is 385.25 and the standard deviation is 6.5. ln the case of math, students with complete data have a mean score of 429.5 and the standard deviation of 4.1, while the students with incomplete data have a mean math score of 360.2 and the standard deviation of 4.1. The best way to handle missing data in this case would be to use a regression imputation technique, where the variables in the dataset are used to predict the variable/s where the data are missing and then this predicted values are imputed to the missing cases. However, this does not seem feasible here because 27% of the observations that have missing data, have more than one student-level variable with missing values and 47% have more than one school-level variable with missing values, Then, in many cases it would be needed to predict more Iban one missing variable for the same student, which makes the imputation procedure less relíable. Even if imputation was made only in those observations with only one missing variable, this variable is not always the same, and several different models would be needed to predict the missing variable in each case.. 72.
(7) WELL-BEING ANO SOCIAL POLICV VOL 3, NUM. 1, pp. 69-95. educational inputs are the independent variables. Inputs typically include family background characteristics, school and teacher's characteristics and, more rarely, some variable that intends to account for student innate ability. Family background variables, such as parents' education, educational resources available at homo (books, computers, a desk to study, etc) usually account for most of the variation of students' performance at school (Hanushek and Luque 2003); and evidence about school-related variables such as class size, teacher's experience and education, and teacher's salaries is far from decisive and many times contradictory (Hanushek, 1995). Harbison and Hanushek's (1992) study of Brazil, Glewwe and Jacoby's (1994) study of Ghana, Glewwe et al. (1995) study of Jamaica and Kingdon's (1996) study of India, all surveyed in Glewwe (2002), suggest that school building characteristics, writing materials and textbooks, teacher's education and teacher 's salaries are significant determinants of cognitive achievement. However, Glewwe (2002)'s criticizes the econometric estimation of the education production function because it is subject to problems of ornission of relevant variables due to the fact that many factors determining leaming efficiency and school quality are very difficult to observe. Then, estimates are likely to be biased. Other problems of estimation are sample selection (in many developing countries a high proportion of the children do not go to school or leave school at an early age), possible endogeneity of years of schooling or grade, measurement errors in the regressors and difficulties in the specification of the dependent variable. For these reasons, Glewwe (2002) is in favor of the use of randomized trials and natural experiments' for research on education. However, it is not easy to find natural experiments, and randomized trials tend to be quite expensive. An alternative approach to study school quality determinants that intends to reduce some of the mentioned econometric problems is the so called value-added model, in which the dependent variable is the rate of leaming over a specific time period (the change in the test score). This mode! eliminates a variety of confounding influences including the prior history of parental and school inputs, reducing the likelihood that omitted historical factors introduce significant bias (Rivkin, Hanushek and Kain (2005), p. 422). Using a modified version of this approach with data from the UTD Texas School Project, Rivkin, Hanushek and Kain (2005) find that teachers have powerful effects on reading and mathematics achievement, though little of the variation is explained by observable characteristics such as education and experience. Hemandez-Zavala, Patrinos, Sakellariou and Shapiro (2006) use feasible generalized least squares to estimate an education production function for Mexico, Guatemala and Peru, distinguishing between indigenous and non-indigenous students." They fmd that working students have a lower performance, while students that have more than ten books at horne, a family member that reads the newspaper, and more educated parents, have a better performance. Teachers' experience and teachers' autonomy are also positive determinants of leaming. Randomized trials generate two groups of observations that have no systematic difference other than that one group receives "the treatment" (treatment group) and the other does not (control group). After the "treatment" is applíed (a specific educational policy, such as using textbooks), the cognitive skills in each group are compared. Natural experiments are essentially the same, with the only difference that the two groups are not generated but found. " Data sources are: The First Comparative International Study on Language, Mathematics and Associated Factors ("Regional Laboratorio") of 1997 for Peru, Guatemala's Nacional Laboratorio Exam of 2002 and the 2001 National Standards Exam for Mexico.. 73.
(8) QUALITY OF EDUCATION IN ARGENTINA: DETERMINANTS ANO DISTRIBUTION LISING PISA 2000 TEST SCORES. 22 Studies using PISA 2000 dataset The PISA 2000 dataset provides a source of internationally comparable and comprehensive data that has fostered several studies. Fertig (2003) estímates an education production function for Germany at the mean (by OLS) and at different quantiles to analyze possible differences in determinants along the scores distribution. He finds a significant and positive impact of class size, share of girls at schools, schools being selective upon entry and schools where students with low achievement are likely to be transferred to another school. Higher school autonomy and teacher shortage are negatively associated with performance. The author does not fiad systematic differences between private and public schools. Neither building conditions nor educational resources were significant variables. Students' access to PC and Internet at home is a significant positive determinant but students' access to computers at school shows no significant impact. Along the score's distribution, class size and the percentage of girls at school show a significantly higher coefficient at lower quantiles than at higher quantiles. Ammermüller (2004) compares Germany's poor performance with Finland's, the country at the top of the score's ranking He fmds that German students have, on average more favorable family background characteristics and ínstitutional settings, while Finland has more favorable school resources. At the same time, returns to family background characteristics in terms of tests scores are higher in Germany than in Finland, but school's resources have a higher retirar in Finland. The author also finds that streaming in Germany penalízes students in lower school types and leads to a greater inequality of educational achievement. Rangvid (2003) uses PISA 2000's dataset together with register-based data on the student's backgrounds to study educational peer effects (measured by the mean parental education of peers and its standard deviation) in Denmark using quantile regressions. She finds that the positive and significant peer levet effect is strongest for students at the lower end of the score distribution and is steadily decreasing over the conditional test score distribution. Vandenberghe and Robin (2004) use the PISA 2000 dataset to estimate the effect of private vs. public education on student's performance for nine different countries.'2 The authors find that some private-public school differentials remain statisticaliy significant atter controlling for selection on both observed and unobserved variables. In Brazil, for example, private schools outperform public ones by 20-100% of the standard deviation, while in France public schools do better than private ones by 50-90% of the standard deviation. In Mexico, Denmark and Spain, private schools do not differ from public ones. OECD published several reports on PISA 2000 assessment. Variables related to student's socio-economic background are powerful factors influencing performance on reading, mathematical and scientific literacy scales (OECD, 2003a). It is worth noting that Argentina has one of the biggest gaps in tests scores between the top and the bottom quarters of the index of family wealth," However, OECD (2003a and b) emphasize that the average quality of education does not 12 Austria, Belgium (Dutch-Speaking), Belgium (French-Speaking), Brazil, Denmark, France, Ireland, Mexico and Spain. " This index is derived from students' reports on the availability in their home of a dishwasher, a room of their own, educational software, Internet, the number of cellular phones, television sets, computers, motor cars and bathrooms.. 74.
(9) WELL-BEING AND SOCIAL POLICY VOL 3, NUM. 1, pp. 69-95. necessary have an inverse relation to equity. There are several countries such as Canada, Finland, Hong Kong-China, Iceland, Japan, Korea and Sweden that show high average scores and a belowaverage impact of socio economic background on student performance. Student's home background comprises just a part of the factors influencing scores. School factors are also important determinants. Indeed, in about one third of all PISA countries, the impact of school-level effects is greater than the impact of student-level characteristics (OECD 2003a, pp. 19). The report presents the proportion of overall student 's score variance in each country that is attributable to between-schools variance and the one that is attributable to within-schools variance. Of the five Latin American countries (Argentina, Brazil, Chile, Mexico and Peru), three of them, Argentina, Chile and Peru, have a larger performance differences between schools than the OECD average. The PISA dataset contains a broad set of variables that account for school characteristics, such as infrastructure, educational resources and teachers' quality, most of which have been collected through a questionnaire answered by school principals. This can be seen as a drawbaek of the dataset because school-related variables may be subjective. According to principal's reports, there is no evidence of systematically poorer physical school infrastructure in non-OECD countries compared to OECD countries. However, among nopOECD countries, school principals perceive the quality of educational resources to be a more important barrier to learners than in the OECD countries (OECD 2003a, p. 194). Also, teachers in OECD countries appear to retain considerably more responsibility than in non-OECD countries. The effect of class size on student performance for the combined reading literacy scale presents some patterns by groups of countries. For the Nordic countries, the results suggest a decline in students' performance from around 22 students onwards. For the average of OECD countries, that decline occurs at 30 students. For East-Asian countries, no negative effect of adding students is shown at any relevant class size. The situation for Latin American countries is similar. The average class size for there countries is of 35 students. However, a smoothed decline in performance is found from about 38 students onwards (OECD 2003a, p.199). This paper estimates the traditional education production function at the mean of the score distribution, using survey regressions and at different quantiles of the conditional distribution using quantile regressions. At the time of writing this paper, except for OECD (2003a), which reports two-level hierarchical regressions for all participating countries including Argentina, no other papers that addressed Argentina's quality of education using the PISA dataset had been published. Llach et al. (1999), Murillo et al. (2002), Eskeland and Filmer (2002), Galiani and Schargrodsky (2002), Woessmann (2005) and Gertel et al. (2006) use other data-sets to study learning outcomes' determinants in Argentina. However, none of those papers analyze learning outcomes' determinants along the score's distribution as it can be done using quantile regressions. This paper was presented at the Conference on the Quality of Education in Latin America and the Caribbean, in that conference Abdul-Hamid (2007) presented the results of research conducted using the same data base used here but a different methodology. Rather than survey regressions, he used generalized least squares. The results of this paper are nonetheless, together with Abdul-Hamid (2007), irmovative in that they provide evidence from Argentina on the basis of a rich dataset for the secondary school level. This should help to rationalize the discussion on the quality of education and the possible future policy paths to take.. 75.
(10) QUALITY OF EDUCATION IN ARGENTINA: DETERMINANTS ANO DISTRIBUTION USING PISA 2000 TEST SCORES. 3. Model and Empirical Approach. The education production function to be estimated can be written as:. = - 13,Fu +r, / /ü. + [3 s Sii. (1). +Ej./. where A. is the student i achievement at school j, F. is the vector of family background characteristicá, 1 is the vector of individual student charácteristics, S. is the vector of school and fis are the corresponding vectors ofparameters characteristics and E is the error term. to be estimated. Given that PISA has a complex, two-stage stratified sample design, we use survey regressions to estimate equation (1), and we use the balanced repeated replication (BRR) replicate weights provided in the dataset to compensate for differences in the selection probabilities of students." These are needed to compute unbiased-standard error estimates associated with any population parameter estimates.'5 These estimates provide the effect of each of the explanatory variables at the conditional mean of the scores' distribution. However, we also want to know the effect of the explanatory variables at different parts of the score's distribution. That is why we estimate quantile regressions (introduced by Koenker and Basset, 1978) at the 5tb, 25tb, 50tb, 75tb and 95`b quantiles. We follow Fertig (2003) and Rangvid (2003) in this matter. Apart from estimating variables' effects at differentparts of the distribution, quantile regressions have several advantages compared to Ordinary Least Squares (OLS). In the first place, they give lens weight to outlier observations in the dependent variable. Secondly, the estimation method is more robust because it allows the marginal effects of explanatory variables to differ across the quantiles of the dependent variable. Thirdly, when error-terms are non normal, quantile regression estimators may be more efficient than OLS estimators. Finally, the semi-parametric nature of the approach relaxes the restrictions on the parameters to be constant across the entire distribution of the dependent variable. Rangvid (2003, p. 12). Writing equation (1) in terms of the quantile regression model, we have:. = X:130 +//0, Quant(A, I X; ) = X; f3 o with. O E (0,1). (2). where Quant(A, I X) denotes the 9 quantile of the reading (or math) score conditional on the vector of explanatory variables X. , which for exposition simplicity, contains vectors F, 1 and S. of equation (1). For the error term, it is only assumed that. 14 Balanced replicate weights are created breaking the sample hito sub-samples (called replicates) and calculating the estimate of interest (the reading and math score in this case) from the sample and from each replicate. The difference between the estimate of the full sample and each of the replicates is used to determine the standard error around the estimate (http://www.ats.ucla.edu/statistata/Library/replicate_weights.htm). " We use the "svy brr: regress" command of STATA 9.. 76.
(11) WELL-BEING AND SOCIAL POLICY VOL 3, NUM. 1, pp. 69-95. Quante (u / X; ) = O . The O th regression quantile ofA is the solution to the minimization of the sum of the absolute deviation residuals:. N. E pe, —max(0,x 0)}. (3). where Po is a weighting function used to center the data, depending on the quantile. p9 0,t = [ 91(ue;. O) + (1— 6)1(u9 <0)117,t 61 1. and I(.) is an indicator function (Jalan and Ravallion, I 998).'6 The sample was expanded using the sample weights, and standard errors are calculated from 100 bootstrap replications.17 Both in (1) and (2), the dependent variable Ai is the Warm (1989) estimate of the combined reading literacy score and of the math score. The score variables were normalized to mean O and variance 1, so that all the estimated coefficients can be interpreted directly in terms of the standard deviation. Table 1 describes the defmition of each variable used in the model are and Table 2 shows the weighted summary statistics. Table 1 Description of Variables Description. Variable PISA Reading Score PISA Math Score. Warm (1989) estimate (Weighted Likelihood Estimate) of the combined reading ability. Warm (1989) estimate (Weighted Likelihood Estimate) of the math ability.. Family Background Ckaracteristks Father with upper secondary education 1 if student's father highest schooling degree is complete upper secondary education; O otherwise. 1 if student's father highest schooling degree is complete tertiary education; O Father with tertiary education otherwise. • 1 if student's mother highest schooling degree is complete upper secondary Mother with upper secondary school education; O otherwise. 1 if student's mother highest schooling degree is complete tertiary education; Mother with Tertiary School O otherwise. •. For example, in the median regression, positive and negative residuals receive equal weight. We use the "bscireg" command in STATA 9. The bootstrapping technique, introduced by Efron (1979), consists of sampling observations with replacement from the original sample and computing the estimate with each sample. As we used 100 replications, each estimate was computed 100 times, and with those values, standard errors were calculated. ". 77.
(12) QUALITY OF EDUCATION IN ARGENTINA: DETERMINANTS AND DISTRIBUTION USING PISA 2000 TEST SCORE Table 1 (continued) Description. Variable. Father full working Mother full working. 1 if father is working full-time; O otherwise. 1 if mother is working full-time; O otherwise.. Student immigrant. 1 if student was not bom in Argentina; O otherwise.. Parents immigrants. 1 if student's mother or father were not bom in Argentina;. Student lives in a single family. O otherwise. 1 if student lives with mother, father or guardian; O otherwise.. Middle child. 1 if student lives with mother and mate guardian, father and female guardian, two guardians, or other combination; O otherwise. 1 if the student is neither the first nor the last-born in the family;. Youngest child. O otherwise. 1 if the student is the last-bom in the family; O otherwise.. Student lives in a mixed family or other type. Number of younger siblings Number of older siblings Number of siblings of the same age Index of cultural communication with parents. Index of home educational resources. Books at home (Discrete ordinal variable). Number of younger brothers or sisters. Number of older brothers or sisters. Number of brothers or sisters of the same age. This index is derived by PISA from students' reports on the frequency (never, few times/year, once a month, several times/month, several times/week) with which their parents or guardians engage with them in discussing political or social issues, discussing books, films or television programs and listening to classical music. Positive values indicate a higher frequency of cultural communication and negative values indicate a lower frequency of cultural communication. This index is derived from students' reports on the availability in their home of a dictionary, a quiet place to study, a desk for study, textbooks and the number of calculators. Positive values indicate possession of more educational resources and negative values indicate possession of fewer educational resources at home. It takes value 1 if there are none books at the student's borne, 2 if there are 1 to 10 books, 3 if there are 11 to 50, 4 if there are 51 to 100, 5 if there are 101 to 250, 6 if there are 251 to 500 and 7 if there are more than 500.. Student Characteristics. Male Age (in months) Grade Index of engagement in reading. 1 if student is mate; O otherwise. Student's age in months. Student's grade This index is derived by PISA from the student's levet of agreement (strongly disagree, disagree, agree, strongly agree) with the following statements: "I read only if I have to", "Reading is one of my favorite hobbies", "I like talking about books with other people", "I find it hard to finish books", "I feel happy if I receive a book as a present", "For me, reading is a waste of time", "I enjoy going to a bookstore or a library", "I read only to gét information that I need", "I cannot sit still and read for more than a few minutes". Positive values indicate more positive attitudes towards reading and negative values indicate less positive attitudes towards reading.. 78.
(13) WELL-BEING AND SOCIAL POLICY VOL 3, NUM. 1, pp. 69-95 Table 1 (continued). Descríption. Variable. Index of the sense of belonging to school. This index is derived by PISA from students' reports on their level of agreement (strongly disagree, disagree, agree, strongly agree) with the following statements: "I feel like an outsider", "I make friends easily", "I feel like I belong", "I feel awkward and out of place", "Other students seem to like me", "I feel lonely", "1 do not want to go to school", "I often feel bored". Positive values indicate a more positive attitude towards school and negative values indicate a less positive attitude towards school.. School Characteristics School is placed in a village or town (less than 100 000 people). 1 if school is placed in a town (defined as a location with less than 100 000 people); O otherwise.. Percentage of girls at school. Ratio between the number of girls in the school and the total enrolment.. Class size. Number of students in the language or math class, correspondingly.. Class size squared Private School. Square of the number of students in the language or math class, correspondingly. 1 if school is private; O otherwise.. Number of computers per student. Total number of computers in the school divided by the school size.. Index of teachers' autonomy. This index is derived from the number of categories that principals identified as being mainly the responsibility of teachers: hiring/firing teachers, establishing teachers' starting salaries, determining teachers' salary increases, formulating the school budget, deciding on budget allocation within the school, establishing student disciplinary policies, establishing student assessment policies, approving students for admittance to school, choosing which textbooks are used, determining course content and deciding which courses are offered. Positive values indicate higher levels and negative values indicate lower levels of teacher participation in school decisions. A. Index of teachers' behavior. This index is derived by PISA from school principals' reports on the extent (not at all, a little, some, a lot) to which 15-year-olds are hindered in their leaming by: low expectations of teachers; poor student-teacher relations; teachers not meeting individual students' needs, teacher absenteeism, staff resisting change, teachers being too strict with students, and students not being encouraged to achieve their full potential. Positive values indicate that teacher related factors do not hinder the leaming of 15- year-olds, whereas negative values indicate schools in which there is a perception that teacher-related factors hinder the leaming of 15- year-olds.. Index of the quality of school's educational resources. This index is derived by PISA from school principals' reports on the extent (not at all, a little, some, a lot) to which 15-year-olds are hindered in their leaming by: lack of instructional material, lack of computers, poor library, poor multi-media resources, poor science equipment and poor facilities for the fine arts. Positive values indicate that the leaming of 15-year-olds is not hindered by the unavailability of educational resources. Negative values indicate the perception of a lower quality of educational materials at school.. Notes: A: MI the indices provided by PISA were scaled using a weighted maximum likelihood estimate following Warm (1989)'s methodology. ♦ : Tertiary education includes both a tertiary-non-university degree and a university degree. 79.
(14) OUALITY OF EDUCATION IN ARGENTINA: DETERMINANTS AND DISTRIBUTION USING PISA. 2000 TEST SCORES. Table 2 Weighted Summary Statístics Mean. Variable. BRR. Min. Max. Std Err.4•.. 456.64 429.52. 3.42 4.09. 26.57 151.67. 768.03 766.64. 0.54. 0.017. 0. 1. 0.21. 0.009. 0. 1. 0.012. 0. 1. 0.51. 0.02. 0. 1. Mother with upper secondary education Mother with tertiary education. 0.26 0.23. 0.016. 0. 0.013. 0. 1 1. Father not working full-time (Base category). 0.45 0.55. 0.012. 0. 1. Father working full-time. 0.011. 0. 1. Mother not working full-time (Base category). 0.79. 0.01. 0. 1. Mother working full-time. 0.21. 0.006. 0. 1. Student born in Argentina. 0.995. 0.0008. 0. 1. 0.005. 0.0008. 0. 1. Parents boro in Argentina. 0.93. 0.0044. 0. 1. Parents immigrants. 0.07. 0.0044. 0. 1. PISA Reading Score PISA Math Score Family Background. Characteristics Father with no upper secondary education (Base category) Father with upper secondary education. 0.25. Father with tertiary education Mother with no upper secondary education (Base category). (Base category) Student immigrant. 0.8. 0.006. 0. 1. (Base category) Student lives in a single family Student lives in a mixed family or other type. 0.13 0.07. 0.007. 0. 0.39. 0 0. 1 1. First boro child (Base category). 0.005 0.007. 1. Middle child. 0.29. 0.01. 0. 1. Youngest child Number of older siblings. 0.32 1.17. 0.007 0.19. 0 0. 1 4. 1.12. 0.032 0.003. 0. 4. 0.016. 0. 4. 0.59. 0.015. -2.2. 2.71. -0.65 3.54. 0.039 0.042. -5.93 1. 0.76. Student lives in a nuclear family. Number of younger siblings Number of siblings of the same age Index of cultural communication with parents Index of home educational resources Books at home (Discrete ordinal variable). 80. 7.
(15) WELL-BEING AND SOCIAL POLICY VOL 3, NUM. 1, pp. 69-95 Table 2 (continued) Variable. Mean. BRR. Min. Max. Std Err. Student Characteristics Female (Base category). 0.58. 0.013. 0. 1. Male. 0.42. 0.013. Age (in months). 189.59. 0.053. 0 184. 1 195. Grade. 9.86 -0.131. 0.017. 7 -3.03. 11 3.23. 0.38. 0.032. 0. 1. 0.62. 0.032. 0. 0.56. 0.56. 0. 1. 31. 0.38. 2. 75. Index of engagement in reading. 0.013. Index of the sense of belonging to school School Characteristics School is placed in a city (100 000 people or more) (Base category) School is placed in a village or town (less than 100 000 people) Percentage of girls at school Class size Public School (Base category). 0.5. 0.036. 0. I. Private School. 0.5. 0.036. 0. 1. Number of computers per student. 0.048. 0.002. 0.024. 0.08. 0 -1.57. 0.242. Index of teachers' autonomy Index of teachers' behavior. -0.036. 0.042. -2.56. 2.41. 0.063. -3.22. 1.9. 0.024. -3.4. 2.32. Index of the quality of school's educational resources. -0.51. Sample Size for Reading. 2147. Sample size for Math. 1218. 2.5. 4.: Balanced Repeated Replication Standard Enors. Note: All students of the sample were tested in reading and about half of them were also tested in math. The summary statistics presentad in the table correspond to the reading sample. However, the summary statistics of the math sample are very similar.. 4. Results 4.1 Family background characteristics Table 3 presents the survey regression estimation results at the mean of the distribution and the quantile regression results for the reading score. Table 4 presents the same for the math score. Father's education is a significant determinant of student's test score in reading and math. The results from the reading regressions suggest that students with fathers that have finished the upper secondary education have a score that is, on average, 3.2 standard deviation (SD from now. 81.
(16) QUALITY OF EDUCATION IN ARGENTINA: DETERMINANTS AND DISTRIBUTION USING PISA 2000 TEST SCORES. on) higher than students with fathers that have not completed such level of education. It is also worth noting that the coefficient of this variable is even higher in the 5% and 25% quantile regressions, suggesting that the positive impact of having a father with upper secondary education is even bigger among lower-achievers. Fathers with a tertiary degree also have a significant impact over student's reading score, with students having, on average, a reading score that is about 2.1 SD higher than the score of students whose fathers do not have a tertiary degree. At the median of the score distribution, the impact of this variable is of 4.4 SD, more than twice the impact at the mean. The variable is also significant in the 75% and 95% quantile regressions. The results from the math regressions are quite similar. Students with fathers with upper secondary education have, on average, a math score that is 6.4 SD higher than the score of students with fathers that have not completed such level of education. At the median of the conditional distribution, this coefficient is 4.1 SD. The coefficient is even higher in the 25% quantile regression, suggesting, similar to the reading case, that the positive impact of fathers with upper secondary school is bigger among lower achievers than among higher achievers. Students whose fathers completed tertiary education have a math score that is, on average, 7.0 SD higher than the score of students whose fathers have not completed tertiary education; this coefficient is 6.7 SD in the 25% quantile regression and, and 5.4 SD in the regression at the median of the distribution. It is interesting to note that the coefficients for the father's educational variables are higher in the math regressions than in the reading regressions, suggesting that the father's education is more important for his children's academic achievement in math than in reading. Mother's education also seems to be a significant determinant of student's academic achievement in reading. Students with mothers that have completed upper secondary education have a reading score that is, on average, 3.0 SD higher than the score of students whose mothers have not completed this level of education. This variable is also significant in the 25% quantile regression, where the coefficient is even higher. Students whose mothers have a tertiary degree have a score that is, on average, 2.1 SD higher than the score of students with mothers that do not have a tertiary degree. This variable is not significant in any of the quantile regressions. The math regression results for the mothers' educational variables present counterintuitive results. The dummy variable that accounts for mothers with upper secondary education is not significant in any of the regressions and the dummy variable that accounts for mothers with a tertiary degree is significant but with a negative coefficient in the mean and median regressions. There are two dummy variables that take value one if the father or mother is full time employed. We did not have a clear prediction on the sign for these variables. On one hand, full working father and/or mother might result in a lower amount of time devoted to child-bearing and less attention given to children requirements, so that academic achievement could be hindered. However, on the other hand, full working father and/or mother might also result in higher family income which can be beneficial for children in other ways.'8 These two opposite effects might compensate each other. These variables were not significant in any of the mean regressions. The dummy variable that accounts for full working father is significant in the 25% quantile reading regression with a positive coefficient and in the 75% quantile reading regression with a negative coefficient,. `a Children may enjoy a better nutrition or parents may hire private teachers to compensate their lower time devoted to children. Moreover, parents with higher income might send children to better schools.. 82.
(17) WELL-BEING AND SOCIAL POLICY VOL 3, NUM. 1, pp. 69-95. suggesting that among lower achievers it is the income-effect the one that dominates, and among higher achievers, the time-effect the one that dominates. The variable for full working mothers has a positive but weakly significant coefficient in the 95% quantile reading regression. For the case of math, full working fathers have a positive and significant impact on student's score at the median of the distribution. Among family background characteristics, there are also two dummy variables, one with value one if the student was born in another country and the other with value one if the parents were born in another country. We expected immigrant children and children of immigrant parents to do worse than non-immigrants because immigration in Argentina comes from the less educated sectors of countries from the region. The 2001 Census data show that 34% of the population of 15 to 24 years old who are immigrants come from Bolivia and Paraguay in the first place (11 and 10% correspondingly), Chile and Peru (4% each), Uruguay (3%) and Brazil (1%). It also shows that only 20% of the total immigrant population of 15 years or older have completed the secondary education and only 7% have a university or tertiary degree Finally, it is worth noting that immigrants of all ages and origins were, in 2001, only 4% of the total population. Estimation results suggest that immigrant students do not perforen significantly different from non-immigrant students in reading and math. However, results also suggest that the children of immigrant parents have a significantly higher reading score. This dummy variable is significant in the mean regression and in the 5% and 75% quantile regressions. In the case of the math regressions, this variable is only weakly significant and also positive in the 5% quantile regression. The result that students with immigrant parents have a better academie performance is a counterintuitive result that we did not expect. Further research is needed to understand it. The model also contains variables that account for the structure of the family: single-parent family (student lives with mother, father or guardian), mixed-family (the student lives with mother and male guardian, father and female guardian or two guardians) or other type of family. Base category is the nuclear family (student lives with mother and father). It can be argued that students in nuclear families benefit from the education and support of both parents at home, in which case they might have a better performance. However, results are not conclusive. The dummy variable that accounts for single-parent families has a positive coefficient but significant only at the 10% level in the 25% quantile regression, and it has a negative and highly significant coefficient in the 75% quantile of the reading score distribution. This variable also has a negative although weakly significant (significant at the 10% level) coefficient in the mean regression of the math score. Students living in mixed families have a significantly lower reading score in the 75% quantile regression and a lower math score in the 95% quantile (but in this case the variable is significant only a the 10% levet). There is a set of dummy variables that accounts for the effect of birth order and the number of siblings. The number of older, younger and equal siblings is included together with the birth order dummy variables to avoid the effect of birth order being compounded with the effect of family size.' We follow Parish and Willis (1993) and Wolter and Vellacott (2002) in this specification. Results suggest that birth order plays a significant role in academie achievement of both reading. 19 We would have liked to distinguish older, younger and same-age siblings by gender, but this information is not available in the dataset.. 83.
(18) QUALITY OF EDUCATION IN ARGENTINA: DETERMINANTS AND DISTRIBUTION USING PISA 2000 TEST SCORES. and math. The birth order effects suggest that students who are the middle child perform significantly worse than those who were first born. The middle child dummy variable is negative and significant in the mean, 75% and 95% quantile reading and math regressions. Students who were last bort) do not perform significantly different in reading and math than those who were first born, except for the case of the 95% quantile math regression, where the variable is negative and significant. These results are consistent with evidence found in Wolter and Vellacott (2002)'s study with PISA data for Switzerland. These authors argue that some of the parental resources are divided amongst children and that the first born child enjoys a period in which he/she is the only child, while the youngest might enjoy the same situation later in life, but for the middle children, the competition for parental resources is the fiercest. The results on the number of siblings' variables suggest that a higher number of younger siblings does not affect performance (this variable is only weakly significant and negative in the 95% quantile math regression), which is consistent with the privilege enjoyed by the first born child. The number of siblings of the same age (either twin-siblings or adopted children), is not significant either. However, the number of older siblings has a negative and significant coefficient in the mean, 25% and 50% quantile reading and math regressions. There is only one case in which this variable is positive and significant, which is in the 95% quantile math regression. Overall, results suggest that family size does play a role and that, for children who are neither the first nor the last born, the higher the number of older brothers and sisters, the lower the performance in reading and math. The three last variables in the vector of family background characteristics are directly related to the learning environment the student has at home. The first one is the index of cultural communication with parents, which measures the frequency with which their parents or guardians engage with them in discussing political or social issues, books, films or television programs, and listening to classical music. The second variable is the index of home educational resources, which reflects the availability of a dictionary, a quiet place to study, a desk, textbooks and calculators at home. Finally, the number of books is a discrete ordinal variable also included in the mentioned vector. We expected all these three variables to have a positive impact on the students' performance. The index of cultural communication with parents is not significant in any of the regressions. However, results indicate that the grater the availability of educational resources and books at home, the better the student's performance. The index of home educational resources is positive and significant in all the reading regressions (except for the one at the 95% quantile) and in the 75% and 95% quantile math regressions. The number of books at home is highly significant and positive in all the reading regressions and in all the math regressions, except for the one at the 5% quantile. 4.2 Student characteristics Results show a very interesting gender pattern. Girls outperform boys in reading. On average, boys score 4.37 SD lower than girls. Moreover, the quantile regressions show that the effect of boys having lower reading scores than girls is higher at lower quantiles of the reading score's distribution. That is, amongst lower achievers, the difference in reading test scores between boys and girls is bigger than amongst higher achievers. However, boys outperform girls in math. On average, boys score 4.26 SD higher than girls. Conversely to the case of reading, the difference in math test scores between boys and girls is bigger amongst higher achievers than amongst lower achievers.. 84.
(19) WELL-BEING AND SOCIAL POLICY VOL 3, NUM. 1, pp. 69-95. The age and grade variables were added as control variables in the model. We will not comment on this. The index of engagement in reading, which measures the extent to which the student enjoys reading and has the habit of doing it, is positive and significant in all the reading regressions and its coefficient is very similar at the different parts of the reading score's distribution. Interestingly, good reading habits seem to benefit other areas of knowledge too. This variable is also positive and significant in all the math regressions, again with similar coefficients along the score's distribution. Finally, the index of the sense of belonging to school, which intends to measure how well integrated to the school is the student, has a positive and significant coefficient in the mean and median reading and math regressions. It is also positive and significant in the 25% quantile reading regression, and in the 5% quantile math regression.. 4.3 School characteristics Students attending schools located in a village or town (defined as locations with less than 100 000 people) seem to have a worse performance in math. On average, students have a score that is 3.4 SD lower than the score of students attending schools located in cities (defined as locations with more than 100 000 people). This variable is also negative and significant in the median, 75% and 95% quantile math regressions, and the estimated coefficient is higher at higher quantiles. Among the reading regressions, this variable is negative but only weakly significant (significant in the 10%) in the median regression and in the 95% quantile regression. Results also suggest that the higher the percentage of girls at school, the better the average performance in reading. Quantile regressions also suggest that the positive and significant effect of this variable is bigger among lower reading achievers than among higher reading achievers. These results are consistent with the previously discussed advantage of girls over boys in reading. In the math regressions, the percentage of girls variable was positive but weakly significant only in the 5% quantile regression. Given that each gender seems to be stronger in a different area of knowledge and that a higher percentage of girls at school improves the average reading score, we could conclude that mixed-gender schools should be favored against single-gender schools.2° Class size and its square were also included in the model. In the case of the reading regressions, the linear terco is positive and significant only in the mean regressions, and the squared term is never significant. This kind of result for the class size variable is usually found. OECD (2003b)'s multilevel regression for Argentina find that class size is non significant and OECD (2003a) finds only the linear term significant for all Latin American countries in general. However, in the math regressions, the estimates of the mean regression show the inverted-U pattem suggesting that class size should not exceed 32 students. These variables are also significant in the 5% quantile regression, suggesting that among lower achievers, it would be convenient for the math class size not to exceed 25 students, and in the 95% quantile, indicating an optimum of 28 students.. " Given that girls outperform boys in reading, it could be argued that mixed gender schools might be beneficial for boys to improve their reading performance, but not for girls. In an alternative specification of the model, we tried replacing this variable for two dummy variables, one with value one for all-girls school and the other with value one for all-boys school. The results from this alternative model suggest that girls also benefit from mixed-gender schools.. 85.
(20) QUALITY OF EDUCATION IN ARGENTINA: DETERMINANTS AND DISTRIBUTION USING PISA 2000 TEST SCORES. The reading and math regressions suggest that, after controlling for all the other variables included in the model, students attending private schools do not perforen significantly different than those attending public schools. Two indices intend to capture teachers' characteristics. One of them, the index of teachers' autonomy, is derived from the number of categories that principals identified as being mainly the responsibility of teachers (such as formulating school budgets, allocating school budgets, establishing student disciplinary policy, etc). This index is not significant in any of the reading regressions and it is weakly significant (significant at the 10 levet) in three of the six math regressions, with a positive sign in the mean and in the 75% quantile regression and a negative sign in the 5% quantile regression. Therefore, the effect of teachers' autonomy over students' academic achievement is not clear. This is consistent with OECD (2005) results where it is remarked that the association between different aspects of school autonomy and student performance within a given country is often weak, but countries with higher degrees of autonomy in key aspects of school management tend to have higher average performance. The other index is the index of teachers' behavior. This is derived by PISA from principals' reports on the extent to which 15-year-olds are hindered in their learning by issues such as the low expectations of teachers; poor student-teacher relations; teachers not meeting individual students' needs and teacher absenteeism, among others. This index is positive and significant in all the reading regressions and in ah the math regressions except for the one at the 5% quantile. Finally, two indices are included to capture the school's educational resources. One of them is the number of computers per student. This index has a positive and significant coefficient in many of the reading regressions (the mean, the 5%, 25% and 50% quantile regressions). It is also positive and significant in the mean and 5% quantile math regressions. The other index is the index of the quality of school's educational resources. This is based on the school principals' reports on the extent to which 15-year-olds are hindered in their learning by a lack ofresources such as books, multi-media resources and laboratory equipment. This index is positive and highly significant in all the reading regressions and math regressions (except for the one in the 95% quantile). It is worth mentioning that the index of teachers' behavior and the index of the quality of school's educational resources are subjective. Both are based uniquely on the principals' reports on teachers' altitudes and on the available educational resources. Principals in a school that caters to upper-class students might answer that resources are not of sufficient quality because the school does not have brand new computers, whereas a principal in a school in a poor ama might answer that resources are sufficient because each student has a desk, although little else. The fact that most of the school variables are collected through the principals' questionnaire is a limitation of the dataset. However, ignoring all the variables in the dataset that can be subjective would leave us with very little information about the schools. Besides, even if subjective, it could also be argued that given that schools' principals are the ones facing daily educational challenges, resources' shortage and teachers and parents' complaints, they might be the most qualified people to determine whether the staff and the educational resources they count with are enough and of good quality or not. A more objective set of variables available in the dataset are the proportion of language teachers with a tertiary or university degree in language, the proportion of math teachers with a tertiary or university degree in math, the proportion of teachers with a tertiary or university degree in pedagogy and the proportion of teachers certified by the appropriate authority. When these. 86.
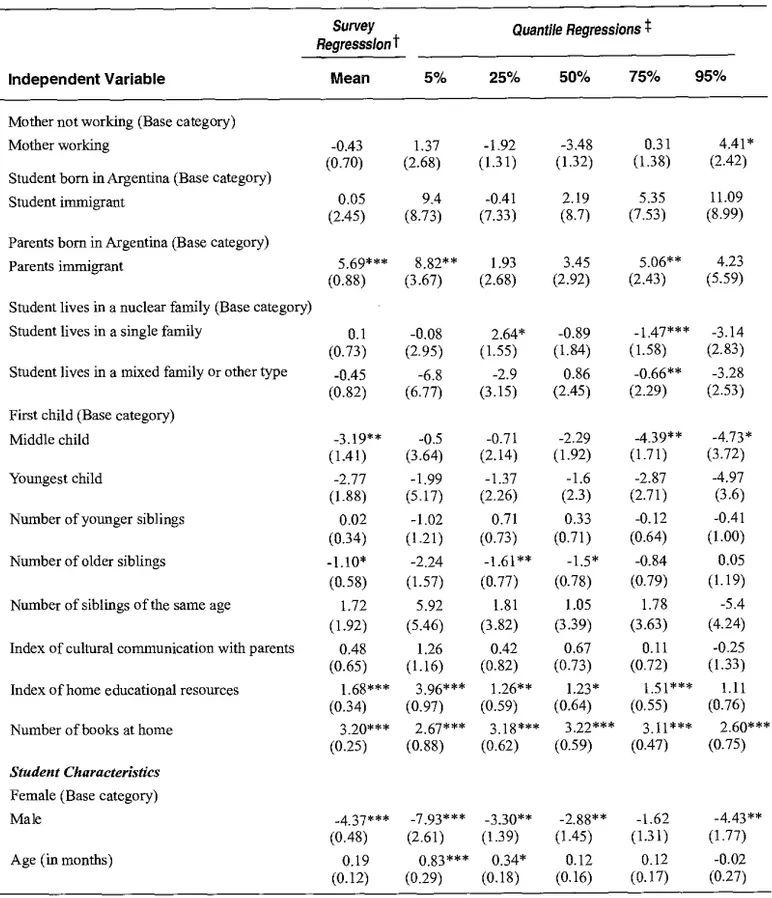
(21) WELL-BEING AND SOCIAL POLICY VOL 3, NUM. 1, pp. 69-95. variables are included in the reading and math regressions (together with the previously discussed variables), they are not significant. However, we tried a different specification of the model in which we do not include the two indices thought to be subjective (the index of teachers' behavior and the index of the quality of educational resources) and we include these more objective variables; results are as follows: in the reading regressions, when the proportion of language teachers with a tertiary or university degree in language is included together with the proportion of teachers with a tertiary or university degree in pedagogy and the proportion of certified teachers, any of these variables is significant. However, when each of these variables is included alone, the proportion of language teachers with a tertiary or university degree in language and the proportion of teachers with a tertiary or university degree in pedagogy are positive and significant at the 10% level in the mean regression and positive and significant at the 5% level in the median regressions, but the proportion of certified teachers is only weakly significant (significant at the 10% level) in the median regression. In the math regressions, as in the case of reading, when the three variables related to teachers' certification and degrees are included together, none of them is significant and when each of them is included alone, only the proportion of math teachers with a tertiary or university degree in math is significant, and only in the mean regression. These results, suggest that, despite being a subjective index, the index of teachers' behavior is successful in capturing the teachers' quality since this variable is highly significant in alI regressions. Table 3 Education Production Function Estimated at the Mean and at Different Quantiles of the Conditional Distribution of PISA 2000 Test Scores — Reading Survey Regresssion t. Independent Variable. Quantile Regressions t. Mean. 5%. 3.20*** (0.58). 5.66* (3.12). 2.07*** (0.75). 2.23 (2.95). 0.74 (2.04). 4.43** (1.79). 3.02*** (0.8). 0.29 (3.67). 4.27** (1.66). 2.56 (1.67). 2.33 (1.54). 1.99 (2.63). 2.11*** (0.72). -2.52 (3.33). 2.43 (1.78). 2.55 (1.72). 1.4 (1.88). -0.91 (2.63). -0.29 (0.58). -2.42 (2.03). 0.82 (1.22). -2.26** (1.23). 0.66 (1.74). 25%. 50%. 75%. 95%. Family Background Characteristics Father with no upper secondary education (Base category) Father with upper secondary education Father with tertiary education. 4.41** (1.7). 2.04 (1.61). 1.19 (1.75) 3.71** (1.6). 5.01* (2.57) 3.78* (2.23). Mother with no upper secondary education (Base category) Mother with upper secondary education Mother with tertiary education Father not working (Base category) Father working. 87. 333** (1.4).
(22) QUALITY OF EDUCATION IN ARGENTINA: DETERMINANTS AND DISTRIBUTION USING PISA 2000 TEST SCORES. Table 3 (continued). Survey Regresssion t Independent Variable. Quantile Regressions t 5%. Mean. 25%. 50%. 75%. 95%. Mother not working (Base category) -0.43 (0.70). 1.37 (2.68). -1.92 (1.31). -3.48 (1.32). 0.31 (1.38). 4.41* (2.42). 0.05 (2.45). 9A (8.73). -0.41 (7.33). 2.19 (8.7). 5.35 (7.53). 11.09 (8.99). 5.69*** (0.88). 8.82** (3.67). 1.93 (2.68). 3.45 (2.92). 5.06** (2.43). 4.23 (5.59). Student lives in a single family. 0.1 (0.73). -0.08 (2.95). 2.64* (1.55). -0.89 (1.84). -1.47*** (1.58). Student lives in a mixed family or other type. -0.45 (0.82). -6.8 (6.77). -2.9 (3.15). 0.86 (2.45). M.66** (2.29). -3.14 (2.83) -3.28 (2.53). -3.19** (1.41) -2.77 (1.88). -0.5 (3.64). -0.71 (2.14). -2.29 (1.92). -4.39** (1.71). -4.73* (3.72). -1.99 (5.17). -1.37 (2.26). -1.6 (2.3). -2.87 (2.71). -4.97 (3.6). Number of younger siblings. 0.02 (0.34). -1.02 (1.21). 0.71 (0.73). 0.33 (0.71). -0.12 (0.64). -0.41 (1.00). Number of older siblings. -1.10* (0.58). -1.61** (0.77). -1.5* (0.78). -0.84 (0.79). 0.05 (1.19). Number of siblings of the same age. 1.72 (1.92). -2.24 (1.57) 5.92 (5.46). 1.81 (3.82). 1.05 (3.39). 1.78 (3.63). -5.4 (4.24). Index of cultural communication with parents. 0.48 (0.65). Index of home educational resources. 1.68*** (0.34) 3.20*** (0.25). 0.11 -0.25 0.67 0.42 1.26 (1.33) (0.73) (0.72) (0.82) (1.16) 1.11 1.51*** 1.23* 3.96*** 1.26** (0.76) (0.64) (0.55) (0.97) (0.59) 2.60*** 3.22*** 3.11*** 3.18*** 2.67*** (0.75) (0.59) (0.47) (0.62) (0.88). -4.37*** (0.48). -7.93*** -330** (1.39) (2.61). -2.88** (1.45). -1.62 (1.31). -4.43** (1.77). 0.19 (0.12). 0.83*** 0.34* (0.18) (0.29). 0.12 (0.16). 0.12 (0.17). -0.02 (0.27). Mother working Student bom in Argentina (Base category) Student immigrant Parents born in Argentina (Base category) Parents immigrant Student lives in a nuclear family (Base category). First child (Base category) Middle child Youngest child. Number of books at home Student Characteristics Female (Base category) Male Age (in months). 88.
(23) WELL-BEING AND SOCIAL POLICY VOL 3, NUM. 1, pp. 69-95. Table 3 (continued) Survey Regresssiont Independent Variable. Ouantile Regressions*. Mean. 5%. Grade. 11.25*** (0.66). 10.94*** (2.40). 11.17*** 13.15*** (1.51) (1.54). 10.82*** 6.95*** (1.74) (2.20). Index of engagement in reading. 5.54*** (0.24). 4.90*** (0.97). 5.30*** 5.84*** (0.95) (0.72). 6.52*** 4.98*** (0.60) (0.95). 0.94*** (0.0). 1.39 (0.88). 1.55** (0.73). 1.15* (0.63). 0.76 (0.60). -0.21 (0.82). -1.48 (0.9). 1.92 (2.43). -1.49 (1.38). -2.50* (1.3). -1.65 (1.17). -3.19* (1.67). 23.06*** (8.35). 10.47** (4.28). 5.6 (3.93). 5.13 (3.71). -5.45 (4.92). 0.35 (0.63). 0.55 (0.63). 0.48 (0.34). 0.74 (0.56). -0.54 (0.91). -0.004 (0.003). -0.005 (0.01). -0.006 (0.01). -0.003 (0.006). -0.008 (0.009). 0.01 (0.01). -1.25 (1.39). -2.09 (3.55). -2.98 (1.91). -2.77 (1.8). -1.11 (1.68). -2.57 (2.92). Index of teachers' autonomy. -0.66 (0.54). 1.37 (1.3). 0.07 (0.85). -0.93 (0.8). 0.31 (0.66). 0.86 (1.04). Index of teachers' behavior. 2.60*** (0.59). 2.72* (1.58). 1.72* (0.89). 1.52** (0.69). 2.72*** (1.02). Index of the sense of belonging to school. 25%. 50%. 75%. 95%. School Characteristics School is placed in a city (100 000 people or more) (Base category) School is placed in a village or town (less than 100 000 people) Percentage of girls at school Class size Class size squared Public school (Base category) Private school. Number of computers per student Index of the quality of school's educational resources Sample size R-squared (or Pseudo R-squared). 8.11*** (2.88) 0.44** (0.2). 2.12** (0.68). 49.67*** 115.86*** 49.25** 59.76** 31.74 -0.89 (17.09) (40.11) (19.88) (21.1) (21.73) (32.00) 3.17*** 3.48*** 3.82*** 2.15*** 3.21*** 4.02*** (0.43) (1.17) (0.67) (0.61) (0.74) (1.03) 2147 0.36. 0.23. 0.2. 0.19. 0.21. 0.21. *,** and ***: Variable statistically significant at the 10%, 5% and 1% level correspondingly. Standard Errors are reponed in parenthesis. t: In the survey regression we weight observations and estimate standard errors using the sample weights (obtained with the Balanced Repeated Replication methodology). $: In the quantile regressions the sample was expanded using the sample weights. The expanded sample is of 2 646 observations. Standard errors in the quantile regressions were calculated from 100 bootstrap replications.. 89.
(24) QUALITY OF EDUCATION IN ARGENTINA: DETERMINANTS AND DISTRIBUTION USING PISA 2000 TEST SCORES. Table 4 Education Production Function Estimated at the Mean and at Different Quantiles of the Conditional Distribution of PISA 2000 Test Scores - Math. Survey Regresssion t Independent Variable. Mean. Quantile Regressions* 5%. 25%. 50%. 75%. 95%. Family Background Characteristics Father with no upper secondary education (Base category) Father with upper secondary education. 6.37*** (1.05). 8.67 .(5.66). 8.22*** (2.22). 4.10** (2.00). 2.89 (2.36). 1.85 (2.51). Father with tertiary education. 7.00*** (0.93). 3.72 (5.95). 6.75** (2.88). 5.40*** (1.97). 3.25 (2.07). 4.81 (3.75). -0.35 (1.20). 3.31 (5.01). -0.01 (2.14). -2.66 (1.98). -1.35 (1.93). -1.55 (2.66). -2.36** (1.06). -3.24 (6.29). -3.43 (2.53). -5.76** (2.57). -1.33 (2.82). 0.75 (2.93). -0.08 (0.82). -4.07 (3.31). -0.10 (L75). 5.13*** (1.70). -0.63 (1.77). 0.11 (2.00). 0.70 (1.07). -0.99 (4.45). -3.15 (2.35). 0.22 (1.76). 0.87 (2.51). 3.67 (2.73). -0.96 (3.70). -9.49 (16.62). 6.21 15.35. -8.29 (7.95). -1.75 -2.95 (7.51) (10.01). Mother with no upper secondary education (Base category) Mother with upper secondary education Mother with tertiary education Father not working (Base category) Father working Mother not working (Base category) Mother working Student boa' in Argentina (Base category) Student immigrant Parents bom in Argentina (Base category) 0.91 (1.98). 10.45* (6.07). 2.13 (3.63). -0.21 (2.51). -1.98 (2.45). -0.03 (3.84). Student lives in a single family. -2.34* (1.36). 7.30 (4.76). 3.45 (2.44). 1.74 (2.58). -0.55 (2.41). -0.72 (3.23). Student lives in a mixed family or other type. -0.95 (1.00). 1.30 (7.91). -0.89 (3.68). 1.76 (2.62). -0.89 (2.71). -6.59* (3.35). Middle child. -4.54*** (1.12). -5.19 (5.83). -0.33 (3.00). -2.29 (2.39). -3.92* -16.1*** (2.35) (3.80). Youngest child. -2.12 (1.54). -5.47 (6.99). 5.47 (3.43). -1.03 (2.89). -4.47 (2.98). -24.76*** (5.53). Number of younger siblings. 0.55 (0.34). -0.12 (1.96). 1.35 (1.05). 0.63 (0.94). -0.12 (0.93). -2.23* (1.24). Parents immigrant Student lives in a nuclear family (Base category). 90.
(25) WELL-BEING AND SOCIAL POLICY VOL 3, NUM. 1, pp. 69-95. Table 4 (continued). Survey Regresssion t Independent Variable. Number of older siblings. Mean. Quantile Regressionst 5%. 25%. 50%. (0.80). -0.54 (1.03). 3.86** (1.50). 75%. 95%. -1.18*** (0.43). -1.64 (2.65). -1.94* (1.02). Number of siblings of the same age. -2.81 (2.31). -9.47 (8.85). -0.56 (7.22). 2.28 (4.15). -1.40 (4.66). Index of cultural communication with parents. 0.06 (0.61). -0.31 (2.01). -8.83 (9.74) -0.37 (1.25). 0.84 (0.96). -0.83 (0.93). 0.68 (1.89). Index of home educational resources. 0.51 (0.32). 0.70 (1.68). 0.65 (1.0 ). 0.74 (0.62). 1.19* (0.68). 1.75* (0.94). Number of books at home. 3A7*** (0.39). 2.18 (1.72). 2.68*** (0.71) (0.54). 3.39*** 2.48** (0.57) (0.99). Male. 4.26*** (0.62). 3.52 (3.23). 3.80** (1.91) (1.74). 5.16*** (1.71). 5.35*** (2.00). Age (in months). 0.35*** (0.11). -0.13 (0.45). 0.65** (0.28) (0.19). 0.27 (0.20). -0.16 (0.28). Grade. 9.08*** (1.07). 6.10** (2.94). 11.29*** (2.55) (2.17). Index of engagement in reading. 3.21*** (0.61). 3.66** (1.81). 3.75*** (1.07) (0.79). 10.15*** 8.95*** (2.18) (2.84) 3.46*** 3.44*** (0.59) (1.24). Index of the sense of belonging to school. 0.78*** (0.27). 2.78* (1.62). 0.72 (0.97). (0.65). 0.60 (0.84). -3.40*** (0.97). -2.47 (3.69). -1.21 (1.96). -4.30** (1.76). -5.18*** -5.25** (1.59) (2.12). 22.37* (11.84). 3.30 (6.28). -2.42 (4.12). -3.11 (4.21). -0.70 (6.13). 1.02*** 1.13 (0.96) (1.08) -0.02*** -0.02 (0.02) (0.02). 0.46 (0.44). 0.71* (0.42). -0.006 (0.007). -0.01 (0.01). 1.12** (0.51) -0.02** (0.01). Student Characteristics Female (Base category). School Characteristics School is placed in a city. -1.21 (0.93). (100 000 people or more) (Base category) School is placed in a village or town (fess than 100 000 people) Percentage of girls at school. 3.27 (3.18). Class size. 1.02*** (0.36). Class size squared. -0.016*** (0.005). Public school (Base category) Private school. 1.97 (1.27). 4.27 (5.25). 0.85 (2.40). 0.44 (2.00). -1.19 (2.00). -1.98 (3.36). Index of teachers' autonomy. 1.05* (0.54). -3.67* (2.20). 1.59 (1.04). 1.60 (1.13). 1.88* (1.00). 2.55 (1.58). 91.
(26) QUALITY OF EDUCATION IN ARGENTINA: DETERMINANTS AND DISTRIBUTION USING PISA 2000 TEST SCORES Table 4 (continued) Survey Regresssion t. Quantile Regressions t. Independent Variable. Mean. 5%. 25%. Index of teachers' behavior. 3.10*** (0.58). -0.48 (1.80). 2.56** (1.20). Number of computers per student Index of the quality of school's educational resources. 39.01** (18.08) 3.67*** (0.46). Sample size. 1218. R-squared. 0.32. 74/8 170.06** (73.64) (35.57) 6.49*** 5.58*** (1.16) (2.15). 0.20. 0.20. 50%. 75%. 95%. 4.08*** 3.45*** 2.81*** (0.97) (1.35) (1.02) 27.32 (20.58) 3.54*** (0.9). 0.19. 36.69 (25.30). 83.79 (54.33). 2.50*** (0.78). 0.18. 0.10 (1.31). 0.23. * ** and ***: Variable statistically significant at the 10%, 5% and 1% levet correspondingly. Standard Errors are reported in parenthesis. t: In the survey regression we weight observations and estimate standard errors using the sample weights (obtained with the Balanced Repeated Replication methodology). t: In the quantile regressions the sample was expanded using the sample weights. The expended. sample is of 1 490 observations. Standard errors in the quantile regressions were calculated from 100 bootstrap replications.. 5. Policy Implications and Concluding Remarks In this paper we intended to study the determinants and distribution of Argentina's educational quality measured by PISA 2000 reading and math test scores. In the first place we studied the determinants of the average score, found to be relatively low when compared to the other participating countries in PISA assessment. In the second place we studied the determinants of test scores at different parts of the conditional test score's distribution using quantile regressions. Results suggest several issues to be considered in the design of an educational policy. In the first place there seems to be a gender gap in favor of girls in the reading performance, and a gender gap in favor of boys in the math performance. Both should be taken into account for the design of a policy. It is possible that reading teaching strategies that work very well for girls are not equally successful for boys, and the converse being trae for the case of math. Each gender might feel attracted to the same subject in a very different way. Then, teachers could start trying different approaches to the same issue for each gender. At the same time, results suggest that both genders can benefit from the interaction with the other one in mixed-gender schools. Class size is another issue to be considered by educational policy. The math regressions results suggest that class size should not exceed 32 students. Also, a higher quality of educational resources such as libraries, muhi-media resources, science laboratory equipment, facilities for the fine arts and computers, all of them contribute significantly to higher students' scores. Human resources, teachers, also proved to be important for students' achievements. Teachers do matter. Teachers more committed to their work, with lower rate of absenteeism, with better relationships with students and more opened to change, also increase students' performance. This is suggested by the índex of teachers' behavior being significant and with a positivo coefficient.. 92.
Figure
Documento similar
Given the importance of that sector in the structure of the Brazilian economy, a specific simulation was carried out, imposing trade openness between Brazil and Argentina in
This document examines SDI’s as a possible educational resource to address the contents linked to Geographic Information in the context of the secondary education of two
Frecuencia de presencia de las seis especies de crustáceos decápodos y estomatópodos registrados para el estuario del río Gallegos Santa Cruz-Argentina.. Frequency of presence for
The paper analyzes the degree of targeting of health policies directed to pregnant women and children under 4 in Argentina, using information from two Living Standards
and depression. In this study, we analyzed pharmacoresistant epilepsy with con- monitoring in a tertiary care center in Argentina and determined the presence of co-morbid
Communications Policies and the Production of Audiovisual Content in Argentina Carla Rodríguez Miranda Ornela Carboni The introduction of digital terrestrial television and the
With the aim of evaluating the yield of three green asparagus hybrids in the Province of San Luis, Argentina, a field trial was carried out within the framework of an existing
While some journals in databases especially in the field of Library Science such as Library trend, Library and Information Science Abstract LISA, International Journal of Library and
