Board structures, liberal countries, and developed market economies Do they matter in environmental reporting? An international outlook
53
0
0
Texto completo
(2) BOARD STRUCTURES, LIBERAL COUNTRIES AND DEVELOPED MARKET ECONOMIES. DO THEY MATTER IN ENVIRONMENTAL REPORTING?: AN INTERNATIONAL OUTLOOK. Abstract Preceding empirical evidence has shown the effect of most corporate governance mechanisms on CSR and environmental disclosure. However, there is scant empirical evidence based on examining the influence of liberal countries, developed market economies and board structures on environmental disclosure. Thus, this research aims at exploring how liberal and developed countries and board structures affect environmental reporting. We hypothesise that there is a linear and positive association between firms located in countries with liberal and developed market economies and environmental reporting. Moreover, we also hypothesise that one-tier board structures affect negatively environmental disclosure. Focusing on 13,100 firms from 2005 to 2015 domiciled in 39 different countries, we find that firms located in liberal and developed economies are more likely to disclose environmental information, while one-tier boards have a negative effect on it. Keywords: Environmental disclosure, varieties of capitalism, developed countries, one-tier boards, two-tier boards.
(3) 1. Introduction There is a growing concern in society about the commitment of businesses toward environmental issues (Mårtensson and Westerberg, 2016). As a result, companies are more engaged with corporate sustainability reporting practices (Gray et al., 1995), tending particularly to disclose more social and environmental information to their stakeholders. According to Azzone et al. (1997), the environmental report shows the extent to which the company’s products impact on the environment, its engagement with stakeholders and the relevance of the strategic environmental management of the firm. Among the reasons why companies disclose environmental information, there are several. For Deegan and Samkin (2006), one of the reasons is to show the responsibility of the company in environmental issues toward the society and to respond to stakeholders’ expectations. For Vanhamme and Grobben (2009), the most important is to protect the reputation and identity of the company engaging with interested parties through what others have described as a form of moral discourse. Another reason for companies to disclose environmental information is to improve their image. Most of past research based on the environmental field has focused on analysing business characteristics affecting environmental disclosure such as size, leverage or profitability that affect environmental disclosure (Rizwan and Ali, 2013, Eleftheriadis and Anagnostopoulou, 2015). Other scholars have explored the impact of environmental reporting on corporate performance (Hassan and Romilly, in press) or the quality of environmental disclosure (Iatridis, 2013). However, other issues related to the institutional environment, the economic development and the geographic area have received less attention by researchers and, therefore, their effect on environmental reporting merits a deeper analysis. Thus, the aim of our research focuses on examining how countries located in liberal and developed market economies and board structures impact on environmental disclosure. Regarding a liberal market economy, it is placed within the framework of varieties of capitalism (Hall and Soskice, 2001), which considers companies as the core of analysis and it is an appropriate framework to explore the differences among countries at a company level in environmental matters. In relation to developed countries, there is still a great controversy about their influence on environmental disclosure by companies in comparison to developing countries. In the case of board structures, there is also debate on whether the presence of a one-tier or two-tier board increases the environmental competences of the different directors in order to improve environmental disclosure by companies..
(4) According to above arguments, there are different theories underlying the disclosure of environmental information, particularly institutional and stakeholder theory. The institutional theory tries to explain why companies evolve and behave in a particular way (Hall, 1996). In this regard, Scott (1995) posits that institutions are management processes based on rules that transcend companies and characterise their social behaviour. In this context, institutions will help understand corporate environmental reporting not only as a voluntary discourse, but also as a requirement imposed by the business environment. On the other hand, stakeholder theory recognises that in addition to creditors and shareholders, there are other players who are interested in knowing the environmental performance of companies and, therefore, they demand information on the environmental impact of their activities. Thus, to the extent that companies recognise the legitimacy of their stakeholders, they tend to voluntarily report their environmental information to meet their requests (Deegan, 2002). This study contributes to prior literature focused on environmental disclosure in several ways. Firstly, this study is based on 39 countries, which allows us to analyse the importance of separating them between liberal and developed market economies and of exploring their impact on environmental reporting. Secondly, although past research mostly focuses on greenhouse gas emissions (Hassan and Romilly, in press), climate change (Eleftheriadis and Anagnostopoulou, 2015) or carbon disclosure (Calza et al., 2017), this research also takes into account other environmental factors in the environmental disclosure measures such as renewable clean energy products, policy energy efficiency or environment management training, among others, which gives a comprehensive view of how businesses manage the disclosure of environmental issues in the countries analysed. Thirdly, we have tried to answer the following questions: a) What is the association between companies domiciled in countries operating in liberal market economies and environmental disclosure?, b) What is the relationship between firms domiciled in countries operating in developed market economies and environmental reporting? and c) What is the effect of board structures on environmental disclosure?. The results show that liberal and developed market economies have a positive impact on environmental disclosure, while board structure affects negatively. We argue that the country origin is a relevant factor in the disclosure of environmental information companies (Gray et al., 1995; Reverte, 2009). Moreover, board structure has a negative effect on environmental disclosure when there is a one-tier system, since this structure does not guarantee board independence and, therefore, it does not engage with stakeholders’ needs such as environmental disclosure..
(5) The rest of the paper is structured as follows. The next section provides the theoretical background and hypotheses. The third section describes the methodology of the study, the sample and the variables. The fourth section presents the findings of the study and, finally, the fifth section contains a summary of the findings, draws conclusions, and provides limitations and future lines of research. 2. Theoretical framework and hypotheses The existence of a unique theoretical framework to explain the determinants of corporate environmental disclosure is still difficult to achieve (Gray et al., 1995). Authors such as Cormier and Gordon (2001) argue that the association between the political, social and institutional context and environmental disclosure are theoretically supported by sociopolitical theories. Among social-political theories, the institutional and stakeholder approaches are considered of the most relevant. Precisely, we focus on institutional and stakeholder theories to explore how liberal economies, developed market economies and board structures affect environmental reporting. These theories have also been used by Dögl and Behnam (2015) in the corporate environmental responsibility’s context. Institutional theory posits an explanation of why companies evolve and behave in a particular way (Hall, 1996). In this regard, Scott (1995) shows that institutions are steering processes focused on rules, which transcend companies and characterise their social behaviour. Institutional theory argues that companies operating in similar environments tend to adopt the same strategic behaviour and focus on the deeper aspects of social structures (DiMaggio and Powel, 1983, Claessens and Fan, 2002). According to this theory, the structures that include routines, norms, schemes and rules are established as authorized guidelines for social behaviour (Ntim and Soobaroyen, 2013). Institutional approach also supports the idea that companies respond to the pressures of their stakeholders (e.g., demand for environmental disclosure) by imitating the practices of leading companies in their industry with the aim of gaining legitimacy (Aerts et al., 2006). In this context, institutions help understand corporate environmental reporting not only as a voluntary discourse, but also as a requirement imposed by the corporate environment. This process is called isomorphism by DiMaggio and Powell (1983). Isomorphism refers to a process in which a company behaves similarly to another company by adopting the characteristics of the other organization (Rodrigues and Craig, 2007). The structures of the companies are influenced by their social and institutional environment and, therefore, the.
(6) companies that wish to survive use isomorphism by adapting to their external context (Meyer and Rowan, 1991). This is due to the fact the companies operating under the same institutional environment are pressured to behave in a similar way, which leads companies to be homogeneous within a particular context and, accordingly, these companies will adopt, for example, the same model of environmental disclosure. In this regard, Brammer et al. (2012) consider that institutional theory will be an appropriate framework for understanding and explaining how and why environmental issues assume different forms in different countries. Stakeholder approach argues that companies should consider all stakeholders demands when environmental strategies are implemented because if stakeholders are disregarded, then, there is risk that they will withdraw their support to firms. Environmental disclosure is considered a relevant tool for mitigating stakeholders’ pressure regarding environmental matters when there are not environmental regulations (Brammer and Pavelin, 2006). Thus, to the extent that firms recognise the legitimacy of their stakeholders, they tend to voluntarily report on environmental aspects to meet their needs (Deegan, 2002). Stakeholders can be classified into two categories: external stakeholders, who are suppliers, creditors, agencies, customers, governments, among others; and internal stakeholders, who are managers, employees and shareholders (Mitroff, 1983; Ferrell et al., 2009). The interaction between firms’ managers and stakeholders is reciprocal (Wernerfelt, 1984) since stakeholders provide resources to firms, which allow them to survive, while that firms will satisfy stakeholders’ interests and demands. In this regard, Roberts (1992) documents that environmental disclosure is considered as a part of the dialogue between firms and their stakeholders. The latter are interested in knowing the environmental performance of firms and, therefore, they will demand firms information on the environmental impact of their activities. Drawing on institutional and stakeholder theories, we examine how countries located in liberal and developed market economies and board structures impact on environmental disclosure.. 2.1. Liberal market economies According to Hall and Soskice (2001), the varieties of capitalism depend on the social agents and institutional contexts, which are result of political commitments, being the institutional theory the most widely used to analyse corporate environmental disclosure (Matten and Moon, 2008) in cross-country research. In this regard, Jackson and Apostolakou.
(7) (2010) based their research on institutional theory in order to explore the association between the varieties of capitalism and the context of corporate social and environmental reporting. The varieties of capitalism are situated within the institutional theory, developed in the political economy to understand the institutional differences and similarities among the economies. According to the varieties of capitalism approach, firms are considered the core of the analysis, considering also what governments can and cannot achieve. Hence, this perspective is a suitable framework for examining the differences among countries at company level in environmental matters (Gjølberg, 2009, Hartmann and Uhlenbruck, 2015). The main emphasis of scholars in this field focuses on the distinctive nature of the national institutional contexts where companies operate, in aspects such as the legal system and government, the financing sources and the education systems. They postulate that there is a coordinated market economy (CME) when companies interact to solve problems oriented to stakeholders, while liberal market economies (LME) occur when the shareholders and creditors prevail in front of other stakeholders. According to Kang and Moon (2012), CME are characterised by strong state dominance and influenced by the interests of organizations such as employers' associations and unions, whereas LME countries are characterised by strong market dominance and a strong notion of property rights. Aguilera and Jackson (2003) also refer to LME and CME by indicating that LME is characterised by active capital markets, dispersed ownership, flexible labour market and weak cooperation link between businesses, in contrast to CME, which is characterised by capital markets with low activity, ownership concentration, rigid labour market, and strong inter-firm cooperation. According to the Anglo-Saxon corporate governance system, LME firms may adopt voluntarily policies and practices based on social and environmental issues (Khanna and Palepu, 2006) since the participation of stakeholders are not strongly institutionalised. Contrary to this, companies operating in CME may adopt many implicit forms of corporate social responsibility such as environmental issues, being stronger in the adoption of minimum standards of corporate social responsibility (Jackson and Apostolakou, 2010). In line with above arguments, Hummel et al. (2017) find that in LME there is relatively less regulation on corporate social responsibility practices such as environmental disclosure, but firms are more engaged with the disclosure of social and environmental information, while CME countries have more environmental regulations, but the reporting of social and environmental issues is limited. It can, therefore, be assumed that companies located in liberal market economies are more likely to disclose corporate social responsibility information such as environmental.
(8) matters than companies located in coordinated market economies. Therefore, we propose the following hypothesis: Hypothesis 1: Firms domiciled in countries with liberal market economies are positively associated with environmental reporting. 2.2. Developed countries Developing countries in comparison to developed countries may not disclose environmental information since society in these countries is, in general, less strict in the demand of this information and are less informed. Additionally, as Tsang (1998) evidences, the increase in the level of CSR disclosure in developing countries such as Singapore is due to the presence of several big multinationals firms from developed countries operating in these developing countries. Past literature focused on developing countries shows a decrease in environmental reporting (De Villers et al., 2006) because the expectations over the time have changed (Lindblom, 1994). On the other hand, Yu et al. (in press) show that the disclosure of environmental information is high in countries where the level of economic development is high, due to higher levels of resources and greater awareness of social and environmental problems. In this respect, Dögl and Behnam (2015) argue that in a study carried out by the Press Freedom Index 2011/12, several differences are found in environmental matters between Germany or the USA as developed countries compared to other less developed countries such as India, which occupies a Rank of 131 with respect to Germany with the position 16 and USA 47. This can be due to the fact that in these developed countries, stakeholders’ firms are more sensitive to corporate environmental practices. Preceding empirical research (Gnyawali, 1996; Husted, 2005) also supports the view that economic development is a relevant driver for increasing environmental disclosure. In this regard, Gnyawali (1996) finds that rich societies tend to demand firms more social and environmentally responsible performance because people in these societies are better informed. Yu et al. (in press) also report that in countries with a high level of economic development, namely, developed countries, firms are more likely to disclose environmental information. These authors argue that their findings were expected because as other scholars evidence (Gnyawali, 1996; Husted, 2005), low economic development contributes to the environmental degradation. According to stakeholder perspective, in developed market economies it is more likely to disclose environmental information since this information is more relevant for stakeholders to make relevant decisions related to social and financial.
(9) issues. Firms provide environmental and specific information, which is more sensible for stakeholders, but in addition, as Aldrugi and Abdo (2014) find, companies report environmental information because they have many other concerns, including reputation, legal requirements and public pressures. Thus, the hypothesis proposed is the following: Hypothesis 2: Firms domiciled in countries with developed market economies are positively associated with environmental reporting. 2.3. Board Structure There are two prevalent board structures, one-tier board or unitary model, and two-tier board or dual model (supervisory and management board are separated). One-tier boards are composed by both executive and non-executive directors and CEO duality is possible. In contrast, two-tier boards are characterised by independent management and supervisory boards (Choudhur, 2017) and CEO duality cannot take place. Supervisory boards are composed by non-executive or outside directors, whose functions are based on advising and monitoring management behaviour. On the other hand, management boards are integrated by executive directors, whose activities are focused on managing daily firms. Thus, a two-tier board structure will be a better system than a one-tier board structure because all its board members are non-executive. This allows them to be more objective and more independent in monitoring and controlling the performance of executive managers. In one-tier board system, corporate boards are considered the highest governing body, whose main functions are the establishment of company’s policies and make important strategic decision, among other things. In this regard, in a one-tier board system, boards can be made up by both executive and non-executive members. Boards represent shareholders and their directors, mainly non-executive, will have to monitor behaviours, decisions and policies of management team, which have to be in line with shareholders and stakeholders’ expectations (Dunn and Sainty, 2009). However, the credibility, independence and objectivity of executive directors when monitoring managers may be challenged since they may be also part of the management team (Ahmad et al., 2017). Consequently, independent directors lose the ability to monitor managers’ behaviour and the decision making process because independent and executive directors share the same board (Block and Gerstner, 2016) and, accordingly, the latter might control and influence all decisions made by independent directors. Thus, in one-tier system it is more difficult to find ways for guaranteeing that a certain number of board members are independent and, thereby, it is more likely that members in one-tier board structures discourage the reporting of environmental information..
(10) On the other hand, other authors such as Calza et al. (2017) show that the presence of a two-tier board increases the environmental competences of the different directors, improving the commitment of companies with environmental issues compared to those that adopt a one-tier board system. Jaffar et al. (2013) suggest that it is expected a positive association between a two-tier board structure and voluntary disclosure such as environmental reporting, because in these board systems all board directors are non-executive. These board members may perform their duties more independent, objective and effectively because they are not involved with managerial tasks and cannot hold executive positions. Thus, they might encourage the reporting of environmental information and, accordingly, agency cost may be mitigated. Therefore, according to previous arguments, it seems that a two-tier board structure is more likely to encourage environmental reporting than a one-tier board system. Hence, we put forward the following hypothesis: Hypothesis 3: Firms domiciled in countries with one-tier boards are negatively associated with environmental reporting. 3. Empirical Design 3.1. Sample The sample of this study consists of 16,687 firm-year observations companies from 2005 to 2015 (both inclusive) belonging to 39 different countries (Australia, Austria, Belgium, Bermuda, Brazil, Canada, Chile, China, Czech Republic, Denmark, Egypt, Finland, France, Germany, Greece, Hong Kong, India, Ireland, Isle of Man, Israel, Italy, Japan, Jersey, Luxembourg, Macau, Mexico, Netherlands, New Zealand, Norway, Papua New, Portugal, Russia, South Africa, Spain, Sweden, Switzerland, Thailand, United Kingdom and United States). We collected all information about our variables from Thomson Reuters database, which provides corporate governance, economic and financial information. We have removed firms from financial sector because they comply with special accounting rules, which make more difficult the comparison of their financial statements with those of non-financial firms. Additionally, we have also removed that firms for which all data was not available. Therefore, our final sample consists of 13,100 international firms, building an unbalanced panel data sample, which is as consistent and reliable as balanced panel data (Arellano, 2003). Table 1 offers the number of observations by country as well as their percentages over the total sample. As can be seen from Table 1, United States is the country with the highest representation in the sample (27.58%), followed by Japan (13.48%), United Kingdom.
(11) (9.19%) and Canada (8.82%), while Isle of Man is the country with the lowest representation (0.008%). <Insert Table 1 about here> Table 2 provides the 9 sectors in which our sample is divided. We have used the TRBC economic classification provided by Thomson Reuters. As can be seen in Table 2, more than 21.34% of the analysed companies fit into industrial sector, 18.85% and 14.08% represent consumer cyclical and basic materials sectors, respectively. The sector with less representation is Telecommunications services sector with 3.95%. <Insert Table 2 about here> 3.2. Variables Environmental disclosure (ED_SCORE) is our dependent variable. Past literature has created different types of indexes for measuring it. For example, Hossain et al. (2006) take into account 18 items, Iatridis (2013) considers 95 items and Helfaya and Moussa (2017) 32 items, among others. In line with these authors, we have calculated our dependent variable as the addition of several items concerning environmental issues. Each item will take the value 1 if the item considered is disclosed by the firm and 0, otherwise. Our index consists of 54 environmental items disclosed by firms, which are classified into three environmental categories: (1) resource use; (2) emissions; (3) innovation. Environmental items in the category of resource use are: policy water efficiency, policy energy efficiency, policy environment supply chain, renewable energy use, green buildings, among others. In the classification of emissions have been considered, among others, policy emissions, targets emissions, biodiversity impact reduction, emissions trading, climate change commercial risks opportunities, particulate matter emission reduction and waste reduction total, while in innovation the following items have been examined: environmental products, eco-design products, noise reduction, hybrid vehicles, environmental project financing, product environmental responsible use, renewable clean energy products and water technologies. We have used three different independent variables. Firstly, we define Liberal Market Economy as LME and it is measured as a dummy variable that takes the value 1 if the country operates in a liberal market economy and 0, if the country operates in a coordinated market economy (Hall and Soskice, 2001; Hall and Soskice, 2006; Gallego-Álvarez and QuinaCustodio, 2017). The second independent variable represents if the country is a developed or developing country and it is labelled as DEVEP. This variable is calculated as a dummy variable that takes the value 1 if the firm operates in a developed country and 0, if the firm operates in a developing or emerging country. Finally, we also use board structure, defined as.
(12) BOARD_STRUCTURE, and it is calculated as a dummy variable that takes the value 1 if the company has a one-tier board structure and 0, if the company has a two-tier board structure, in line with Calza et al. (2017). This analysis also includes several control variables representing independent directors, board size, boards meetings, CEO duality, firm size, profitability, leverage, CSR committees and activity sector. Independent directors (INDEP_MEMBERS) are measured as the ratio between the total number of independent directors on boards and the total number of directors on boards (Iatridis, 2013; Calza et al., 2017). We also control for board size (BSIZE), calculated as the total number of directors on boards (Calza et al., 2017). Activity of corporate boards is defined as BMEET and it is calculated as the numbers of meetings held by boards each year (Pucheta-Martínez and Chiva-Ortells, in press). Regarding CEO duality (CEODUALITY), it is measured as a dummy variable that equals the value 1 if the same person serves simultaneously as CEO and President of the board and 0, otherwise, in line with Helfaya and Moussa (2017). Firm size is denoted as SIZE and it is measured as the log of total sales (Iatridis, 2013; Gallego-Álvarez et al., 2017). The variable return on assets is also used, denoted as ROA and calculated as the operate income before interests and taxes over total assets (Iatridis, 2013). We also control for leverage of the company, defined as LEV. It is calculated as the ratio of book value of debt over total assets, in line with Iatridis (2013). CSR committee is also controlled and is defined as CSR_COMMT. It is measured as a dummy variable that equals the value 1 if firms have a Corporate Social Responsibility Committee and 0, otherwise (Helfaya and Moussa, 2017). To measure activity sector, we have used the TRBC economic classification provided by Thomson Reuters (Gallego-Álvarez and QuinaCustodio, 2017; Yu et al., in press), which considers nine sectors: basic materials, consumer cyclical,. consumer. non-cyclical,. energy,. healthcare,. industrial,. technology,. telecommunications services and utilities. This variable is denoted by SECTOR and is measured as a dummy variable that takes the value 1 if the firm operates in the sectors analysed and 0, otherwise. Finally, we also control for year effects, YEARt, using a dummy variable where t represents the years of the sample. In Table 3, we present the summary of all the variables used. <Insert Table 3 about here> Thus, we develop the following empirical model to test our hypotheses: ED_SCOREit = β0 + β1LMEit + β2DEVEPit + β3BOARD_STRUCTUREit + β4INDEP_MEMBERSit + β5BSIZEit + β6BMEETit + β7CEODUALITYit + β8SIZEit + β9ROAit + β10LEVit + β11CSR_COMMTit + ∑k=1220 βk SECTORit +.
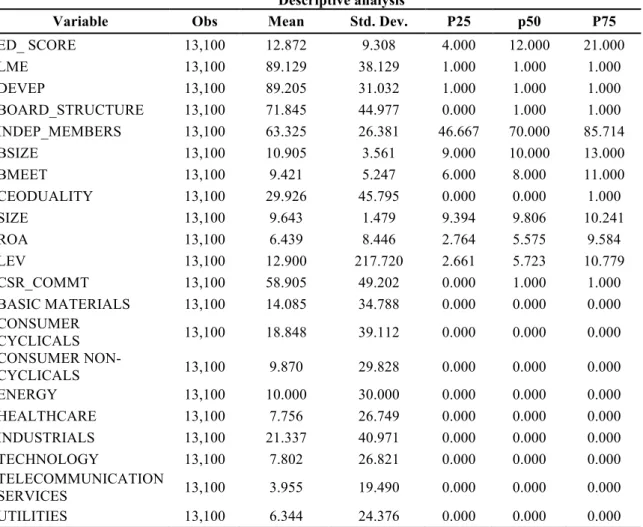
(13) ∑t=2131 βt YEARt + ηi + µit where ηi represents constant and non-observables characteristics of firms potentially related to environmental disclosure (the unobservable heterogeneity) and µit is the error term. The empirical model has been estimated using a Tobit regression panel data. This methodology is used when the dependent variable is left- and right-side censored. In our research, this variable ranges between 0 and 54, which is the number of items used to construct the environmental disclosure index. 4. Results and Discussion 4.1. Descriptive statistics Table 4 shows descriptive statistics of our variables. We find that firms disclose, on average, 12.87 items out of 54. With respect to the variables that represent LME and DEVEP, the average value is 89.13 % and 89.21% respectively. Thus, 89.13% of the firms of our sample operate in liberal market economies and 89.21% in developed economies. Furthermore, the variable board structure (BOARD_STRUCTURE) shows, on average, that 71.85% of the sample boards have a one-tier board. The ROA is, on average, 6.44%, board size (BSIZE) is 10.91 members, board meetings (BMEET) are 9.42, CEO duality (CEODUALITY) is 29.93%, firm size (SIZE) is 9.64 and leverage (LEV) is 12.90%. We also find that, on average, 58.91% of firms have a CSR committee (CSRC) and the proportion of independent directors (INDEP_MEMBERS) on boards is, on average, 63.33%. <Insert Table 4 about here> Table 5 presents the correlations matrix for the variables used in our research. As appreciated in Table 5, none of the coefficients is higher than 0.8, in line with Ramón-Llorens et al. (2018), who come to the same conclusion. Hence, multicollinearity does not bias the coefficients of our model and, accordingly, it is not a concern in our research. <Insert Table 5 about here> 4.2. Multivariate Regression Analyses Table 6 provides the results obtained for the three models built in order to test our three hypotheses. <Insert Table 6 about here>.
(14) In Model 1, the variable LME has a significant and positive sign, as expected. Hence, the hypothesis 1 cannot be rejected. Our evidence suggests that firms operating in liberal market economies disclose more environmental information than companies operating in coordinated market economies, consistent with Jackson and Apostolakou (2010) and Hummel et al. (2017), who also provide this evidence. Furthermore, authors such as Favotto et al. (2016) come to the same conclusion for a research carried out in companies of several countries: USA, Germany, Switzerland and the Netherlands. The authors find that firms operating in LME countries disclose more environmental information, while companies operating in CME countries report more in the social fields of labour and human rights. This could be explained because in liberal market economies, governments endorse less environmental laws, firms commit itself, and society fulfil environmental recommendations and principles since the participation of stakeholders are not strongly institutionalised. In this regard, Hall and Gingerich (2009) argue that firms located in LME countries generally receive financing from large capital markets and these markets have typically institutionalized strong disclosure requirements to facilitate contracting (La Porta et al., 2006), which generally indicates a greater appreciation of the information disclosed by firms operating in LME countries. As the stock market is the most important source of capital, companies must provide a high degree of transparency and accountability to shareholders and investors (Crane and Matten, 2004). In Model 2, the results show a significant and positive relationship between DEVEP and ED_SCORE, as predicted. This suggests that companies operating in developed countries disclose more environmental information than firms operating in an emerging country or developing country. Thus, the hypothesis 2 is also confirmed. This result is consistent with prior studies (Bhattacharyya and Cummings, 2014; Wei and Wang, 2016). Our evidence also supports the premise that firms located in developed countries are vulnerable to stakeholders’ pressures, which are satisfied by reporting more specific environmental information. The results obtained are also in line with Dögl and Behnam (2015), who find that in developed countries the company's stakeholders are more sensitive to corporate environmental practices. In Model 3, the results find that board structure is negative and significantly associated with environmental reporting, thus confirming the third hypothesis. Therefore, companies with a one-tier board structure are less likely to disclose environmental information. A possible explanation is that when all board members have the same tasks and responsibilities, outside directors are most likely to fail to carry out their monitory functions correctly (Ahmad et al., 2017). Countries under a two-tier board system are more likely to orientate firms.
(15) toward stakeholders and, therefore, these firms will tend to report more environmental information. Calza et al. (2017) also support that the presence of a two-tier board seems to increase the environmental competences of the different directors, improving the commitment of companies with environmental issues in comparison with those that adopt a one-tier board system. Regarding control variables, board size, firm size, CSR committees and telecommunication services present a positive and statistically sign in all models. The proportion of independent directors provides a negative and significant coefficient for Models 1 and 2. Return on assets is also negative and statistically significant in the three models. BMEET presents a negative and significant coefficient only for Model 3, as predicted by Pucheta-Martínez and Chiva-Ortells (in press). The remainder of control variables are insignificant. In this research, it is possible that endogeneity concerns take place and, accordingly, we have to check if these concerns exist. We wonder whether firms operating in LME countries, in developed countries and with a one-tier board structure affect environmental reporting, or, whether companies with a better environmental disclosure are located in LME countries, in developed countries and have a two-tier board system. This matter has been addressed by lagging the three independent variables and estimating the three models again. We provide the findings in Table 7, where it can be observed that they are consistent with the core results exhibited in our baseline models. Consequently, we can conclude that our models are free of endogeneity problems. <Insert Table 7 about here> 5. Conclusions This paper aims to analyse whether the varieties of capitalism and board structure might have an impact on environmental disclosure. In this respect, institutional and stakeholder approaches are used to explore such association, which is examined by employing a sample of 13,100 international firms belonging to 39 countries. The findings show that liberal and developed market economies are associated with environmental reporting, in line with Jackson and Apostolakou (2010) and Hummel et al. (2017). In liberal market economies policymakers tend to issue less laws and rules concerning environmental reporting, but companies are engaged with environmental issues. This finding suggests that legal requirements are not the most effective mechanism for encouraging a higher environmental reporting. Countries with a low level of rules focused on environmental issues are more likely to disclose environmental information. Furthermore, the level of.
(16) economic development of a country is also another factor influencing environmental disclosure. Our result is in line with Yu et al. (in press), who report that the disclosure of environmental information in developed countries is more relevant for stakeholders since it allows them to make decisions not only focused on social and environmental issues, but also financial decisions. Finally, one-tier board structure has a negative influence on environmental disclosure since this system reduces the objectivity and credibility of the directors when monitoring managerial team (Ahmad et al., 2017). Countries where firms have a two-tier structure tend to disclose more environmental information, since the supervisory board represent an effective mechanism for protecting environmental matters. This paper has several implications. Firstly, this research shows that the institutional contexts where firms operate are determinants of the disclosure of environmental information. Particularly, our evidence reports that companies located in LME countries and in developed countries are more likely to disclose environmental information. The scarce regulation toward environmental issues in LME countries and, the economic development in developed countries may support the fact that companies in these types of countries are more engaged with environmental issues by reporting environmental information. Thus, firms operating in countries with strong regulation on environmental practices and low economic development should think about extending their business to LME and developed countries if these companies are sensitive toward environmental issues. Secondly, our results show that the type of board structures (one-tier or two-tier boards) is a factor to take into account when environmental disclosure is addressed. One-tier or two-tier board structures depend on the legal system of each country and firms with a two-tier board system tend to report more environmental information. Thus, stakeholders located in countries where two-tier board structures prevail will be more likely to receive environmental information and, therefore, there is a high probability that their needs and interests are satisfied. Thirdly, this paper may be of interest for regulatory bodies because our findings report that stricter regulations about environmental practices not necessarily result in better environmental actions such as the disclosure of environmental information. Maybe it would be more relevant that policymakers take actions in line with becoming aware firms, managers and other business actors on the relevance of reporting environmental issues. Fourthly, researchers should extend our research exploring the effect of other characteristics of different institutional contexts on environmental disclosure. Race, religion or gender diversity are demographic factors, which depend on the institutional context and, thereby, they merit our attention..
(17) The findings of this study should be interpreted in light of certain limitations. It is possible that there are unknown factors that could affect our dependent variable, which it is possible that we have disregarded. The authors observe some opportunities for future research. Firstly, scholars may extend the results of this study by exploring the factors impacting the quality of environmental information disclosed by listed firms. Secondly, it would be interesting to analyse if the existence of a sustainability committee could encourage firms to engage in socially responsible actions. REFERENCES Aerts, W, Cormier, D., Magnan, M. 2006. Intra-industry imitation in corporate environmental reporting: An international perspective. Journal of Accounting and Public Policy 25:199–331. Aguilera, R. V., Jackson, G. 2003. The cross-national diversity of corporate governance: Dimensions and determinants. Academy of Management Review 28: 447–465. Ahmad, N.B. J., Rashid, A., Gow, J. 2017. Board Independence and Corporate Social Responsibility (CSR) Reporting in Malaysia, Australasian Accounting, Business and Finance Journal 11(2): 61-85. Aldrugi, A., Abdo, H. 2014. Determining the motives or reasons that make companies disclose environmental information. Journal of Economics, Business and Management 2(2): 117–121. DOI: http://dx.doi.org/10.7763/JOEBM.2014.V2.109 Arellano, M. 2003. Panel data econometrics. Oxford, UK: Oxford University Press. Azzone, G., Bianchi, R., Mauri, R., Noci G. 1997. Defining operating environmental strategies: Programmes and plans within Italian industries. Environmental Management and Health 81: 4-19. Bhattacharyya, A., Cummings, L. 2014. Attitudes towards environmental responsibility within Australia and India: a comparative study. Journal of Environmental Planning and Management 57(5): 769–791. DOI: ://doi.org/10.1080/09640568.2013.768972 Block, D., Gerstner, A. M. 2016. One-tier vs. two-tier board structure: A comparison between the United States and Germany. Comparative Corporate Governance and Financial Regulation. Paper 1. http://scholarship.law.upenn.edu/fisch_2016/1 Brammer, S., Pavelin, S. 2006. Voluntary Environmental Disclosures by Large UK Companies. Journal of Business Finance and Accounting 33(7–8): 1168–1188. Brammer, S., Jackson, G., Matten, D. 2012. Corporate social responsibility and institutional theory: New perspectives on private governance. Socio-Economic Review 10: 3–28. Calza, F., Profumo, G., Tutore, I. 2017. Boards of directors and firms’ environmental proactivity. Corporate Governance and Organizational Behavior Review 1 (1): 52-64. Cordano M, Marshall RS, Silverman M. 2010. How do Small and Medium Enterprises Go “Green”? A Study of Environmental Management Programs in the U.S. Wine Industry. Journal of Business Ethics 92: 463–478. Cormier, D., Gordon, I.M., 2001. An examination of social and environmental reporting strategies. Accounting, Auditing and Accountability Journal 14 (5): 587–616. Choudhuri, A. 2017. Effectiveness of Board Structure in India and Germany: A Comparative Study. IUP Journal of Corporate Governance 16(1): 46–58. Claessens, S., Fan, J. 2002. Corporate governance in Asia: A survey. International Review of Finance 3 (2): 71–103..
(18) Crane, A., Matten, D. 2004. Business Etichs: A european perspectivs. Managing corporate citizenship and sustainability in the age of globalization. Oxford University Press: Oxford, UK. De Villiers, C., Van Staden, C. J. 2006. Can less environmental disclosure have a legitimising effect? Evidence from Africa. Accounting, organizations and society 31(8): 763–781. DOI: https://doi.org/10.1016/j.aos.2006.03.001 Deegan, C. 2002. The legitimising effect of social and environmental disclosures – a theoretical foundation. Accounting, Auditing and Accountability Journal 15 (3), 282– 311. Deegan, C., Samkin, G. 2006. New Zealand financial accounting, Manukau: McGraw-Hill. Dölg, C., Behnam, M. 2015. Environmentally Sustainable Development through Stakeholder Engagement in Developed and Emerging Countries. Business Strategy and the Environment 24: 583-600. DiMaggio, P. J., Powell, W. 1983. The iron cage revisited: Institutional isomorphism and collective rationality in organizational fields. American Sociological Review 48: 147– 160. Dunn, P., Sainty, B. 2009. The relationship among board of director characteristics, corporate social performance and corporate financial performance. International Journal of Managerial Finance 5: 407-423, https://doi.org/10.1108/17439130910987558 Eleftheriadis, I. M., Anagnostopoulou, E. G. 2015. Relationship between corporate climate change disclosures and firm factors. Business Strategy and the Environment 24(8): 780–789. DOI: https://doi.org/10.1002/bse.1845 Favotto, A., Kollman, K., Bernhagen, P. 2016. Engaging firms: The global organisational field for corporate social responsibility and national varieties of capitalism. Policy and Society 35: 13-27. Ferrell, O.C., Fraedrich, J., Ferrell, L. 2009. Business Ethics: Ethical Decision Making and Cases. Mason: South-Western Cengage Learning. Gallego-Álvarez, I., Quina-Custodio, I.A. 2017. Corporate social responsibility Reporting and varieties of capitalism: an international analysis of state-led and liberal market economies. Corporate Social Responsibility and Environmental Management 24 (6): 478-495. Gallego-Álvarez, I., Ortas, E., Vicente-Villardón, J.L., Álvarez-Etxeberria, I. 2017. Institutional Constraints, Stakeholder Pressure and Corporate Environmental Reporting Policies. Business Strategy and the Environment 26: 807-825. Gjølberg, M. (2009). The origin of corporate social responsibility: Global forces or national legacies?, Socio-Economic Review 7: 605–637. Gnyawali, D. F. (1996). Corporate social performance: An international perspective. Advances in International Comparative Management 11: 251–273. Gray, R., Kouhy, R., Lavers, S. 1995. Corporate social and environmental disclosure. Accounting, Auditing and Accountability Journal 8 (1): 44–77. Hall, R. H. (1996) Organizations, Structures, Processes and Outcomes (Englewood Cliffs, NJ: Prentice-Hall). Hall, P. A., Solskice, D. A. 2001. Varieties of capitalism: The institutional foundations of comparative advantage. Oxford: Oxford, University Press. Hall, P., Soskice, D. 2006. Variedades de Capitalismo: algunos aspectos fundamentales. Desarrollo Económico 45 (180): 17. Hall, P., Gingerich, D. 2009. Varieties of capitalism and institutional complementarities in the political economy: An empirical analysis. British Journal of Political Science 39(3): 449–482..
(19) Hartmann, J., Uhlenbruck, K. 2015. National institutional antecedents to corporate environmental performance. Journal of World Business 50: 729-741. Hassan, O. A., Romilly, P. in press. Relations between corporate economic performance, environmental disclosure and greenhouse gas emissions: New insights. Business Strategy and the Environment. DOI: https://doi.org/10.1002/bse.2040 Helfaya, A., Moussa, T. 2017. Do Board's Corporate Social Responsibility Strategy and Orientation Influence Environmental Sustainability Disclosure? UK Evidence. Business Strategy and the Environment 26(8): 1061–1077. Hossain, M., Islam, K., Andrew, J. 2006. Corporate social and environmental disclosure in developing countries: Evidence from Bangladesh. Hummel, K., Mittelbach-Hoermanseder, S., Cho, C. H., Matten, D. 2017. Implicit Versus Explicit Corporate Social Responsibility Disclosure: A Textual Analysis (December 20, 2017). Available at SSRN: https://ssrn.com/abstract=3090976 or http://dx.doi.org/10.2139/ssrn.3090976 Husted, B. W. (2005). Culture and ecology: A cross-national study of the determinants of environmental sustainability. Management International Review 45(3): 349–370. Iatridis, G. E. 2013. Environmental disclosure quality: Evidence on environmental performance, corporate governance and value relevance. Emerging Markets Review 14: 55–75. Jackson, G., Apostolakou, A. 2010. Corporate social responsibility in Western Europe: an institutional mirror or substitute? Journal Business Ethics 94: 371–394. DOI: 10.1007/s10551-009-0269-8 Jaffar, R., Mardinah, D., Ahmad, A. (2013). Corporate governance and voluntary disclosure practices: Evidence from a two tier board systems in Indonesia. Jurnal Pengurusan, 39, 83-92. Kang, N., Moon, J. 2012. Institutional complementarity between corporate governance and corporate social responsibility: A comparative institutional analysis of three capitalisms. Socio-Economic Review 10: 85–108. Khanna, T., Palepu, K. 2006. Strategies that fit emerging markets. Harvard Business Review 84: 60–69. La Porta, R., Lopez-de-Silanes, F., Shleifer, A. 2006. What Works in Securities Laws?, Journal of Finance 61(1): 1–32. Lindblom, C. K. 1994. The Implications of Organizational Legitimacy for Corporate Social Performance and Disclosure. Critical Perspectives on Accounting Conference, New York. Mårtensson K, Westerberg K. 2016. Corporate environmental strategies towards sustainable development. Business Strategy and the Environment 25(1): 1–9. DOI: https://doi.org/10.1002/bse.1852 Matten, D., Moon, J. 2008. “Implicit’’ and ‘‘Explicit’’ CSR: a conceptual framework for a comparative understanding of corporate social responsibility. Academy of Management Review 33:404–424. Meyer, J.W., Rowan, B. 1977. Institutionalized organizations: Formal structure as myth and ceremony. American Journal of Sociology 83: 340–363. Mitroff, I. 1983. Stakeholders of the Organizational Mind: Toward a New View of Organizational Policy Making. San Francisco: Jossey-Bass. Ntim, C. G., Soobaroyen, T. 2013. Corporate governance and performance in socially responsible corporations: New empirical insights from a neo-institutional framework. Corporate Governance: An International Review 21(5): 468–494. Pucheta-Martínez, M. C., Chiva-Ortells, C. In press. The role of directors representing institutional ownership in sustainable development through corporate social.
(20) responsibility reporting. Sustainable Development, DOI: https://doi.org/10.1002/sd.1853 Ramón-Llorens, M.C., García-Meca, E., Pucheta-Martínez, M.C. (2018) The role of human and social board capital in driving CSR reporting. Long Range Planing, doi.org/10.1016/j.lrp.2018.08.001. Reverte C. 2009. Determinants of corporate social responsibility disclosure ratings by Spanish listed firms. Journal of Business Ethics, 88: 351–366. DOI: 10.1007/s10551-0089968-9 Rizwan, M., Ali, W. 2013. Factors influencing corporate social and environmental disclosure (CSED) practices in the developing countries: An institutional theoretical perspective. International Journal of Asian Social Science 3(3): 590–609. Roberts, C.B. 1992. Environmental disclosures in corporate annual reports in Western Europe, in Owen, D.L. (Ed.), Green Reporting: The Challenge of the Nineties, Chapman and Hall, London, pp. 139-65. Rodrigues, L., Craig, R. 2007. Assessing international accounting harmonization using Hegelian dialectic, isomorphism and Foucault. Critical Perspectives on Accounting 18: 739–757. Scott, W. R. (1995) Institutions and Organizations (Thousand Oaks, CA: Sage). Tsang, E. W. 1998. A longitudinal study of corporate social reporting in Singapore: The case of the banking, food and beverages and hotel industries. Accounting, Auditing and Accountability Journal 11(5): 624–635. DOI: https://doi.org/10.1108/09513579810239873 Vanhamme, J., Grobben, B. 2009. Too good to be true! The effectiveness of CSR history in countering negative publicity. Journal of Business Ethics 85: 273–283. Wei, J.T., Wang, I.M. 2016. Environmental disclosure, investors' investment decisions and their perceptions of the credibility of management. Global Journal of Business Research 10(4): 17-25. Wernerfelt, B. 1984. A resource-based view of the firm. Strategic Management Journal 5(2): 171–180. Yu, E. P. Y., Guo, C. Q., Luu, B. V. In press. Environmental, social and governance transparency and firm value. Business Strategy and the Environment. DOI: 10.1002/bse.2047.
(21) Table 1 Number of observations by country Observations Percentage. Cum.. Australia Austria Belgium. 816 41 97. 6.229 0.313 0.740. 6.229 6.542 7.282. Bermuda Brazil Canada. 15 257 1,155. 0.115 1.962 8.817. 7.397 9.359 18.176. Chile China Czech Republic Denmark Egypt Finland France Germany Greece Hong Kong India Ireland; Isle of Man Israel Italy Japan Jersey Luxembourg. 106 335 8 112 22 142 575 405 10 126 170 174 1 6 132 1,766 20 65. 0.809 2.557 0.061 0.855 0.168 1.084 4.389 3.092 0.076 0.962 1.298 1.328 0.008 0.046 1.008 13.481 0.153 0.496. 18.985 21.542 21.603 22.458 22.626 23.710 28.099 31.191 31.267 32.229 33.527 34.855 34.863 34.908 35.916 49.397 49.550 50.046.
(22) Macau Mexico Netherlan New Zealand Norway Papua New Portugal Russia South Africa Spain Sweden Switzerland Thailand United Kingdom United States Total. 5 122 220. 0.038 0.931 1.679. 50.084 51.015 52.695. 53 70 7 29 190 80 207 259 389 97 1,204 3,612 13,100. 0.405 0.534 0.053 0.221 1.450 0.611 1.580 1.977 2.969 0.740 9.191 27.573 100. 53.099 53.634 53.687 53.908 55.359 55.969 57.550 59.527 62.496 63.237 72.427 100. Table 2 Number of observations by activity sector Number of Percentage TRBC economic sector name observations Basic Materials 1,845 14.084 Consumer cyclical. 2,469 18.847 Consumer Non-Cyclical 1,293 9.870 Energy 1,310 10.000 Healthcare 1,016 7.756 Industrial 2,795 21.336 Technology 1,022 7.802 Telecommunications Services 518 3.954 Utilities 832 6.351 13,100 100 Total. Cum.. 14.084 32.931 42.802 52.802 60.557 81.893 89.695 93.649 100. Table 3 Variable description Variables ED_ SCORE LME. Description The aggregation of the 54 items considered. Each item will take the value 1 if the item considered is disclosed by the firm and 0, otherwise. Dummy variable equals value 1 if the country operates in a liberal market economy and 0 if the country operates in a coordinated market economy. DEVEP. Dummy variable equals value 1 if the firm operates in a developed country and 0 if the firm operates in a developing country. BOARD_STRUCTURE. Dummy variable equals value 1 if the company has a one-tier board and 0 if the company has a two-tier board The ratio between the total number of independent directors on boards and the total number of directors on boards The total number of directors on boards. INDEP_MEMBERS BSIZE.
(23) BMEET CEODUALITY SIZE ROA LEV CSR_COMMT BASIC MATERIALS CONSUMER CYCLICALS CONSUMER NONCYCLICALS ENERGY HEALTHCARE INDUSTRIALS TECHNOLOGY TELECOMMUNICATION SERVICES UTILITIES. The numbers of meetings held by boards each year Dummy variable equals value 1 if the same person serves simultaneously as CEO and President of the board and 0, otherwise The log of total sales Operate income before interests and taxes over total assets Debt over total assets Dummy variable equals value 1 if the firms have a Corporate Social Responsibility Committees and 0, otherwise Dummy variable: 1= Basic Materials; 0 = Otherwise Dummy variable: 1= Consumer Cyclicals; 0 = Otherwise Dummy variable: 1= Consumer Non-Cyclicals; 0 = Otherwise Dummy variable: 1= Energy; 0 = Otherwise Dummy variable: 1= Healthcare; 0 = Otherwise Dummy variable: 1= Industrial; 0 = Otherwise Dummy variable: 1= Technology; 0 = Otherwise Dummy variable: 1= Telecommunication Services; 0 = Otherwise Dummy variable: 1= Utilities; 0 = Otherwise. Table 4 Descriptive analysis Mean Std. Dev.. Variable. Obs. P25. p50. P75. ED_ SCORE LME DEVEP BOARD_STRUCTURE INDEP_MEMBERS BSIZE BMEET CEODUALITY SIZE ROA LEV CSR_COMMT BASIC MATERIALS CONSUMER CYCLICALS CONSUMER NONCYCLICALS ENERGY HEALTHCARE INDUSTRIALS TECHNOLOGY TELECOMMUNICATION SERVICES UTILITIES. 13,100 13,100 13,100 13,100 13,100 13,100 13,100 13,100 13,100 13,100 13,100 13,100 13,100. 12.872 89.129 89.205 71.845 63.325 10.905 9.421 29.926 9.643 6.439 12.900 58.905 14.085. 9.308 38.129 31.032 44.977 26.381 3.561 5.247 45.795 1.479 8.446 217.720 49.202 34.788. 4.000 1.000 1.000 0.000 46.667 9.000 6.000 0.000 9.394 2.764 2.661 0.000 0.000. 12.000 1.000 1.000 1.000 70.000 10.000 8.000 0.000 9.806 5.575 5.723 1.000 0.000. 21.000 1.000 1.000 1.000 85.714 13.000 11.000 1.000 10.241 9.584 10.779 1.000 0.000. 13,100. 18.848. 39.112. 0.000. 0.000. 0.000. 13,100. 9.870. 29.828. 0.000. 0.000. 0.000. 13,100 13,100 13,100 13,100. 10.000 7.756 21.337 7.802. 30.000 26.749 40.971 26.821. 0.000 0.000 0.000 0.000. 0.000 0.000 0.000 0.000. 0.000 0.000 0.000 0.000. 13,100. 3.955. 19.490. 0.000. 0.000. 0.000. 13,100. 6.344. 24.376. 0.000. 0.000. 0.000. Mean. standard deviation and percentiles. ED_ SCORE is calculated as the aggregation of the 54 items considered. Each item will take the value 1 if the item considered is disclosed by the firm and 0, otherwise; LME is measured as Dummy variable equals value 1 if the country operates in a liberal market economy and 0 if the country operates in a coordinated market economy; DEVEP is calculated as Dummy.
(24) variable equals value 1 if the firm operates in a developed country and 0 if the firm operates in a emerging country; BOARD_STRUCTURE is determined as Dummy variable equals value 1 if the company has a one-tier board and 0 if the company has a two-tier board; INDEP_MEMBERS is the ratio between the total number of independent directors on boards and the total number of directors on boards; BSIZE is the total number of directors on boards; BMEET is the numbers of meetings held by boards each year; CEODUALITY is the Dummy variable equals value 1 if the same person serves simultaneously as CEO and President of the board and 0, otherwise; SIZE is the log of total sales; ROA is operate income before interests and taxes over total assets; LEV is the debt over total assets; CSR_COMM Tis the Dummy variable equals value 1 if the firms have a Corporate Social Responsibility Committees and 0, otherwise; BASIC MATERIALS if the company operates in Basic Materials sector and 0, otherwise; CONSUMER CYCLICALS if the company operates in Consumer Cyclicals sector and 0, otherwise; CONSUMER NON-CYCLICALS if the company operates in Consumer Non-Cyclicals sector and 0, otherwise; ENERGY if the company operates in Energy sector and 0, otherwise; HEALTHCARE if the company operates in Healthcare sector and 0, otherwise; INDUSTRIALS if the company operates in Industrials sector and 0, otherwise; TECHNOLOGY if the company operates in Technology sector and 0, otherwise; TELECOMMUNICATION SERVICES if the company operates in Telecommunication Services sector and 0, otherwise; UTILITIES if the company operates in Utilities sector and 0, otherwise..
(25) Table 5 Correlation Matrix (1) ED_SCORE (1) LME (2). (2). (3). (4). (5). (6). (7). (9). (10). (11). (12). (13). (14). (15). (16). (17). (18). (19). (20). (21). 1.000 0.062 ***. 1.000. DEVEP (3). 0.063***. 0.696***. 1.000. BOARD_STRUCTURE (4). -0.185***. 0.011. 0.013. 1.000. INDEP_MEMBERS (5). -0.022**. 0.251***. 0.249***. 0.387***. 1.000. BSIZE (6). 0.313***. -0.073***. -0.073***. -0.055***. -0.077***. 1.000. BMEET (7). 0.080***. -0.044***. -0.040***. -0.160***. -0.112***. -0.085***. 1.000. CEODUALITY (8). (8). 0.017*. 0.085***. 0.089***. 0.170***. 0.192***. 0.091***. -0.105***. 1.000. SIZE (9). 0.505***. -0.057***. -0.056***. -0.112***. 0.041***. 0.501***. 0.046***. 0.133***. 1.000. ROA (10). -0.134***. -0.098***. -0.099***. 0.210***. 0.093***. -0.085***. -0.233***. 0.023***. -0.199***. 1.000. LEV (11). 0.141***. -0.000. 0.003. -0.076***. -0.013. 0.174***. 0.092***. 0.024***. 0.285**. -0.379***. 1.000. CSR_COMMT (12). 0.616***. 0.051***. 0.053***. -0.069***. 0.011. 0.184***. 0.111***. -0.029***. 0.289***. -0.131***. 0.102***. BASIC MATERIALS (13). 0.053***. -0.051***. -0.052***. -0.046***. 0.000. -0.064***. 0.013. -0.087***. -0.061***. -0.074***. -0.047***. 0.085***. 1.000. CONSUMER CYCLICALS (14). -0.053***. 0.079***. 0.078**. 0.041***. -0.066***. -0.015*. -0.105***. 0.011. -0.083***. 0.030***. -0.033***. -0.049***. -0.195***. 1.000. CONSUMER NON-CYCLICALS (15). 0.025***. -0.023***. -0.024***. 0.034***. -0.036***. 0.063***. -0.020**. 0.003. 0.006. 0.057***. 0.045***. 0.033***. -0.134***. -0.159***. 1.000. ENERGY (16). -0.059***. -0.123***. -0.124***. 0.087***. 0.076**. -0.0169. 0.010. 0.012. 0.093***. 0.043***. -0.097***. 0.001. -0.135***. -0.161***. -0.110***. 1.000. HEALTHCARE (17). -0.064***. 0.057***. 0.057***. -0.003. 0.087**. -0.074***. -0.016**. 0.024***. -0.075***. 0.087***. -0.091***. -0.046***. -0.117***. -0.139***. -0.096***. -0.097***. INDUSTRIALS (18). 0.019**. 0.071***. 0.070***. -0.119***. -0.075***. 0.038***. 0.022**. 0.013. 0.002. -0.081***. 0.131***. -0.011. -0.117***. -0.139***. -0.096***. -0.097***. -0.043***. 1.000. TECHNOLOGY (19). 0.013. 0.046***. 0.045***. 0.026***. 0.052****. -0.079****. 0.006. 0.023. -0.065***. 0.103. -0.219***. -0.056***. -0.118***. -0.140***. -0.096***. -0.097***. -0.084****. -0.152***. 1.000. 1.000. 1.000. TELECOMMUNICATION SERVICES (20) -0.014. -0.059***. -0.047***. -0.008. -0.024**. 0.073***. 0.090***. -0.012. 0.105***. -0.009. 0.113***. -0.013. -0.082***. -0.098***. -0.067****. -0.068***. -0.059. -0.106***. -0.059***. UTILITIES (21). -0.060***. -0.061***. 0.033***. 0.041***. 0.104***. 0.064***. 0.022**. 0.164***. -0.132***. 0.215***. 0.054***. -0.105***. -0.125***. -0.086***. -0.087***. -0.076***. -0.136***. -0.076***. 0.087***. -0.053***. 1.000. Correlation matrix. ED_ SCORE is calculated as the aggregation of the 54 items considered. Each item will take the value 1 if the item considered is disclosed by the firm and 0, otherwise; LME is measured as Dummy variable equals value 1 if the country operates in a liberal market economy and 0 if the country operates in a coordinated market economy; DEVEP is calculated as Dummy variable equals value 1 if the firm operates in a developed country and 0 if the firm operates in a emerging country; BOARD_STRUCTURE is determined as Dummy variable equals value 1 if the company has a one-tier board and 0 if the company has a two-tier board; INDEP_MEMBERS is the ratio between the total number of independent directors on boards and the total number of directors on boards; BSIZE is the total number of directors on boards; BMEET is the numbers of meetings held by boards each year; CEODUALITY is the Dummy variable equals value 1 if the same person serves simultaneously as CEO and President of the board and 0, otherwise; SIZE is the log of total sales; ROA is operate income before interests and taxes over total assets; LEV is the debt over total assets; CSR_COMMT is the Dummy variable equals value 1 if the firms have a Corporate Social Responsibility Committees and 0, otherwise; BASIC MATERIALS if the company operates in Basic Materials sector and 0, otherwise; CONSUMER CYCLICALS if the company operates in Consumer Cyclicals sector and 0, otherwise; CONSUMER NON-CYCLICALS if the company operates in Consumer Non-Cyclicals sector and 0, otherwise; ENERGY if the company operates in Energy sector and 0, otherwise; HEALTHCARE if the company operates in Healthcare sector and 0, otherwise; INDUSTRIALS if the company operates in Industrials sector and 0, otherwise; TECHNOLOGY if the company operates in Technology sector and 0, otherwise; TELECOMMUNICATION SERVICES if the company operates in Telecommunication Services sector and 0, otherwise; UTILITIES if the company operates in Utilities sector and 0, otherwise. *p-value<0.1 **p-value<0.05 ***p-value<0.01.
(26) Table 6 Multivariate analysis results ED_SCORE LME. MODEL 1 Coef. P>|t| 3.969*** (0.000). DEVEP. MODEL 2 Coef. P>|t| 4.001*** (0.000). BOARD_STRUCTURE INDEP_MEMBERS BSIZE BMEET CEODUALITY SIZE ROA LEV CSR_COMMT BASIC MATERIALS CONSUMER CYCLICALS CONSUMER NON-CYCLICALS ENERGY HEALTHCARE INDUSTRIALS TECHNOLOGY TELECOMMUNICATION SERVICES N Test statistic. MODEL 3 Coef. P>|t|. -1.848*** (0.000). -0.009** (0.014) 0.212*** (0.000) -0.018 (0.140) 0.129 (0.340) 0.048* (0.082) -0.011* (0.076) 0.000 (0.730) 3.256*** (0.000) 0.965 (0.454) -0.957 (0.446) 0.989 (0.461) -1.694 (0.201) -1.807 (0.196). -0.010** (0.014) 0.213*** (0.000) -0.019 (0.138) 0.130 (0.343) 0.049* (0.081) -0.012* (0.076) 0.000 (0.730) 3.257*** (0.000) 1.036 (0.422) -0.888 (0.479) 1.606 (0.430) -1.621 (0.221) -1.738 (0.213). -0.005 (0.136) 0.209*** (0.000) -0.026** (0.036) 0.209 (0.126) 0.046* (0.094) -0.011* (0.072) 0.000 (0.721) 3.288*** (0.000) 1.216 (0.343) -0.351 (0.778) 1.296 (0.332) -1.535 (0.244) -1.298 (0.349). 0.999 (0.423) 0.631 (0.649) 3.625** (0.013) 13,100. 1.067 (0.391) 0.699 (0.614) 3.698** (0.011) 13,100. 1.331 (0.282) 1.238 (0.369) 3.868*** (0.008) 13,100. 19217.23***. 19217.62***. 19196.23***. ED_ SCORE is calculated as the aggregation of the 54 items considered. Each item will take the value 1 if the item considered is disclosed by the firm and 0, otherwise; LME is measured as Dummy variable equals value 1 if the country operates in a liberal market economy and 0 if the country operates in a coordinated market economy; DEVEP is calculated as Dummy variable equals value 1 if the firm operates in a developed country and 0 if the firm operates in a emerging country; BOARD_STRUCTURE is determined as Dummy variable equals value 1 if the company has a one-tier board and 0 if the company has a two-tier board; INDEP_MEMBERS is the ratio between the total number of independent directors on boards and the total number of directors on boards; BSIZE is the total number of directors on boards; BMEET is the numbers of meetings held by boards each year; CEODUALITY is the Dummy variable equals value 1 if the same person serves simultaneously as CEO and President of the board and 0, otherwise; SIZE is the log of total sales; ROA is operate income before interests and taxes over total assets; LEV is the debt over total assets; CSR_COMMT is the Dummy variable equals value 1 if the firms have a Corporate Social Responsibility Committees and 0, otherwise; BASIC MATERIALS if the company operates in Basic Materials sector and 0, otherwise; CONSUMER CYCLICALS if the company operates in Consumer Cyclicals sector and 0, otherwise; CONSUMER NON-CYCLICALS if the company operates in Consumer Non-Cyclicals sector and 0, otherwise; ENERGY if the company operates in Energy sector and 0, otherwise; HEALTHCARE if the company operates in Healthcare sector and 0, otherwise; INDUSTRIALS if the company operates in Industrials sector and 0, otherwise; TECHNOLOGY if the company operates in Technology sector and 0, otherwise; TELECOMMUNICATION SERVICES if the company operates in Telecommunication Services sector and 0, otherwise; UTILITIES if the company operates in Utilities sector and 0, otherwise. *p-value<0.1 **p-value<0.05 ***p-value<0.01.
(27) Table 7 Estimates of the baseline models lagging the independent variables ED_SCORE. LME-1. MODEL 1 Coef. P>|t| 4.034*** (0.000). MODEL 2 Coef. P>|t| 4.071*** (0.000). DEVEP-1. -1.740*** (0.000). BOARD_STRUCTURE-1 INDEP_MEMBERS BSIZE BMEET CEODUALITY SIZE ROA LEV CSR_COMMT BASIC MATERIALS CONSUMER CYCLICALS CONSUMER NON-CYCLICALS ENERGY HEALTHCARE INDUSTRIALS TECHNOLOGY TELECOMMUNICATION SERVICES N Test statistic. MODEL 3 Coef. P>|t|. -0.013*** (0.001) 0.194*** (0.000) -0.020 (0.127) 0.107 (0.442) 0.030 (0.319) -0.012* (0.065) 0.000 (0.591) 3.398*** (0.000) 0.849 (0.515) -1.094 (0.389) 1.053 (0.440) -1.759 (0.189) -1.674 (0.237). -0.013*** (0.000) 0.194*** (0.000) -0.020 (0.125) 0.106 (0.445) 0.029 (0.318) -0.012* (0.065) 0.000 (0.591) 3.397*** (0.000) 0.927 (0.477) -1.020 (0.421) 1.129 (0.407) -1.680 (0.210) -1.599 (0.259). -0.009** (0.027) 0.191*** (0.000) -0.029** (0.030) 0.167 (0.229) 0.029 (0.325) -0.013** (0.048) 0.000 (0.579) 3.416*** (0.000) 1.064 (0.413) -0.497 (0.694) 1.392 (0.305) -1.620 (0.225) -1.212 (0.390). 0.719 (0.569) 1.371 (0.331) 3.340** (0.023) 13.100. 0.793 (0.529) 1.445 (0.305) 3.418** (0.020) 13.100. 1.057 (0.400) 1.925 (0.170) 3.555** (0.015) 13.100. 12217.59***. 12218.00***. 12202.07***. ED_ SCORE is calculated as the aggregation of the 54 items considered. Each item will take the value 1 if the item considered is disclosed by the firm and 0, otherwise; LME is measured as Dummy variable equals value 1 if the country operates in a liberal market economy and 0 if the country operates in a coordinated market economy; DEVEP is calculated as Dummy variable equals value 1 if the firm operates in a developed country and 0 if the firm operates in a emerging country; BOARD_STRUCTURE is determined as Dummy variable equals value 1 if the company has a one-tier board and 0 if the company has a two-tier board; INDEP_MEMBERS is the ratio between the total number of independent directors on boards and the total number of directors on boards; BSIZE is the total number of directors on boards; BMEET is the numbers of meetings held by boards each year; CEODUALITY is the Dummy variable equals value 1 if the same person serves simultaneously as CEO and President of the board and 0, otherwise; SIZE is the log of total sales; ROA is operate income before interests and taxes over total assets; LEV is the debt over total assets; CSR_COMMT is the Dummy variable equals value 1 if the firms have a Corporate Social Responsibility Committees and 0, otherwise; BASIC MATERIALS if the company operates in Basic Materials sector and 0, otherwise; CONSUMER CYCLICALS if the company operates in Consumer Cyclicals sector and 0, otherwise; CONSUMER NON-CYCLICALS if the company operates in Consumer Non-Cyclicals sector and 0, otherwise; ENERGY if the company operates in Energy sector and 0, otherwise; HEALTHCARE if the company operates in Healthcare sector and 0, otherwise; INDUSTRIALS if the company operates in Industrials sector and 0, otherwise; TECHNOLOGY if the company operates in Technology sector and 0, otherwise; TELECOMMUNICATION SERVICES if the company operates in Telecommunication Services sector and 0, otherwise; UTILITIES if the company operates in Utilities sector and 0, otherwise. *p-value<0.1 **p-value<0.05 ***p-value<0.01.
(28) BOARD STRUCTURES, LIBERAL COUNTRIES AND DEVELOPED MARKET ECONOMIES. DO THEY MATTER IN ENVIRONMENTAL REPORTING?: AN INTERNATIONAL OUTLOOK. Abstract Preceding empirical evidence has shown the effect of most corporate governance mechanisms on CSR and environmental disclosure. However, there is scant empirical evidence based on examining the influence of liberal countries, developed market economies and board structures on environmental disclosure. Thus, this research aims at exploring how liberal and developed countries and board structures affect environmental reporting. We hypothesise that there is a linear and positive association between firms located in countries with liberal and developed market economies and environmental reporting. Moreover, we also hypothesise that one-tier board structures affect negatively environmental disclosure. Focusing on 13,100 firms from 2005 to 2015 domiciled in 39 different countries, we find that firms located in liberal and developed economies are more likely to disclose environmental information, while one-tier boards have a negative effect on it. Keywords: Environmental disclosure, varieties of capitalism, developed countries, one-tier boards, two-tier boards.
(29) 1. Introduction There is a growing concern in society about the commitment of businesses toward environmental issues (Mårtensson and Westerberg, 2016). As a result, companies are more engaged with corporate sustainability reporting practices (Gray et al., 1995), tending particularly to disclose more social and environmental information to their stakeholders. According to Azzone et al. (1997), the environmental report shows the extent to which the company’s products impact on the environment, its engagement with stakeholders and the relevance of the strategic environmental management of the firm. Among the reasons why companies disclose environmental information, there are several. For Deegan and Samkin (2006), one of the reasons is to show the responsibility of the company in environmental issues toward the society and to respond to stakeholders’ expectations. For Vanhamme and Grobben (2009), the most important is to protect the reputation and identity of the company engaging with interested parties through what others have described as a form of moral discourse. Another reason for companies to disclose environmental information is to improve their image. Most of past research based on the environmental field has focused on analysing business characteristics affecting environmental disclosure such as size, leverage or profitability that affect environmental disclosure (Rizwan and Ali, 2013, Eleftheriadis and Anagnostopoulou, 2015). Other scholars have explored the impact of environmental reporting on corporate performance (Hassan and Romilly, in press) or the quality of environmental disclosure (Iatridis, 2013). However, other issues related to the institutional environment, the economic development and the geographic area have received less attention by researchers and, therefore, their effect on environmental reporting merits a deeper analysis. Thus, the aim of our research focuses on examining how countries located in liberal and developed market economies and board structures impact on environmental disclosure. Regarding a liberal market economy, it is placed within the framework of varieties of capitalism (Hall and Soskice, 2001), which considers companies as the core of analysis and it is an appropriate framework to explore the differences among countries at a company level in environmental matters. In relation to developed countries, there is still a great controversy about their influence on environmental disclosure by companies in comparison to developing countries. In the case of board structures, there is also debate on whether the presence of a one-tier or two-tier board increases the environmental competences of the different directors in order to improve environmental disclosure by companies..
(30) According to above arguments, there are different theories underlying the disclosure of environmental information, particularly institutional and stakeholder theory. The institutional theory tries to explain why companies evolve and behave in a particular way (Hall, 1996). In this regard, Scott (1995) posits that institutions are management processes based on rules that transcend companies and characterise their social behaviour. In this context, institutions will help understand corporate environmental reporting not only as a voluntary discourse, but also as a requirement imposed by the business environment. On the other hand, stakeholder theory recognises that in addition to creditors and shareholders, there are other players who are interested in knowing the environmental performance of companies and, therefore, they demand information on the environmental impact of their activities. Thus, to the extent that companies recognise the legitimacy of their stakeholders, they tend to voluntarily report their environmental information to meet their requests (Deegan, 2002). This study contributes to prior literature focused on environmental disclosure in several ways. Firstly, this study is based on 39 countries, which allows us to analyse the importance of separating them between liberal and developed market economies and of exploring their impact on environmental reporting. Secondly, although past research mostly focuses on greenhouse gas emissions (Hassan and Romilly, in press), climate change (Eleftheriadis and Anagnostopoulou, 2015) or carbon disclosure (Calza et al., 2017), this research also takes into account other environmental factors in the environmental disclosure measures such as renewable clean energy products, policy energy efficiency or environment management training, among others, which gives a comprehensive view of how businesses manage the disclosure of environmental issues in the countries analysed. Thirdly, we have tried to answer the following questions: a) What is the association between companies domiciled in countries operating in liberal market economies and environmental disclosure?, b) What is the relationship between firms domiciled in countries operating in developed market economies and environmental reporting? and c) What is the effect of board structures on environmental disclosure?. The results show that liberal and developed market economies have a positive impact on environmental disclosure, while board structure affects negatively. We argue that the country origin is a relevant factor in the disclosure of environmental information companies (Gray et al., 1995; Reverte, 2009). Moreover, board structure has a negative effect on environmental disclosure when there is a one-tier system, since this structure does not guarantee board independence and, therefore, it does not engage with stakeholders’ needs such as environmental disclosure..
Figure

Documento similar
The expansionary monetary policy measures have had a negative impact on net interest margins both via the reduction in interest rates and –less powerfully- the flattening of the
Jointly estimate this entry game with several outcome equations (fees/rates, credit limits) for bank accounts, credit cards and lines of credit. Use simulation methods to
In our sample, 2890 deals were issued by less reputable underwriters (i.e. a weighted syndication underwriting reputation share below the share of the 7 th largest underwriter
Each application of x 0 will change the negative tree by moving the root caret to a right caret and the topmost left caret to the root, if there is a left caret.. If there is no
Each item will take the value 1 if the item considered is disclosed by the firm and 0, otherwise; LME is measured as Dummy variable equals value 1 if the country operates in a
If the company discloses information concerning each item, it will take the value 1, and 0 otherwise; POW_DIST represents the power distance, one of the six culture
in the previous year; the natural logarithm of firm growth from the Equation (4); firm size; a proxy of the firm environment though a dummy if the firm is established in an
They split into two different nests if the number of living agents is equal to the maximum and the amount of food in the nest is larger than a given value.. A new nest is created in
