Optimization of the separation of a group of antifungals by capillary zone electrophoresis
9
0
0
Texto completo
(2) 338. A.L. Crego et al. / J. Chromatogr. A 917 (2001) 337 – 345. former triazole antifungal agents described, which have proved to be highly effective against a broad spectrum of systemic mycotic infections [12,13], particularly Aspergillus sp. [14,15]. Their use in oncology and in patients with AIDS is on the rise. Voriconazole is a new triazole antifungal agent with a broad range of fungal pathogens including Aspergillus fumigatus and Candida krusei [16,17]. On the other hand, all antimycotic agents are not imidazole and triazole derivatives, e.g., terbinafine is a new powerful antifungal agent of the allylamine class [18]. This drug is highly active in the treatment of dermatomycoses [19] and indicated for other mycoses [20]. Simple and accurate methods to determine antifungal agents in biological samples are necessary. Although gas chromatography and bioassays have also been used, high-performance liquid chromatography (HPLC) has been since 1990 the technique most extensively used for these analysis (e.g., ketoconazole [21,22]; clotrimazole [23]; itraconazole [24–27]; fluconazole [28–31]; voriconazole [32,33]; or terbinafine [34–36]. Capillary electrophoresis (CE) has been shown to be a powerful technique for the separation of a wide variety of compounds including drugs. For this reason, CE is gaining popularity as a complementary technique to HPLC with the advantage of requiring only small volumes of sample. This is very important in the case of neonates or children. Nevertheless, although in numerous cases CE offers a more favorable profile compared to the established biochemical or chromatographic techniques [37,38], the simultaneous analysis of different antifungal drugs by CE has not been extensively reported. Only three works have been reported on analyses of antifungal compounds with CE [39–41]. Electrokinetic chromatography (EKC) and capillary zone electrophoresis (CZE) have been used for the separation of cationic substances with various hydrophobicities and including ketoconazole and itraconazole [39]. On the other hand, micellar electrokinetic chromatography (MEKC) with UV detection at 190 nm was reported for the determination of fluconazole in human plasma [40], and, very recently, an optimized CZE method for the simultaneous separation of a mixture of three imidazole antifungals (ketoconazole, clotrimazole and econazole) was employed to determine these drugs in pharmaceutical forms [41].. In this work, two different CZE methods were optimized for the analysis of seven antifungal compounds, ketoconazole, clotrimazole, terbinafine, itraconazole, fluconazole, and voriconazole as standard compounds, and one GlaxoWellcome product under development (GW-product), together with verapamil and imidazole, which were tested as internal standards. The separation conditions investigated were the pH, concentration, and type of running electrolyte, as well as the addition of a few additives, and the effect of different instrumental conditions such as the injection volume, separation temperature, and applied voltage. Upon optimization of the above-referenced separation conditions, analytical performances of the methods were also investigated. The parameters involved were precision (repeatability and reproducibility), linearity, and limits of detection (LODs) and quantitation (LOQs).. 2. Experimental. 2.1. Instrumentation The analyses were carried out in a CE apparatus Model P/ACE 5510 from Beckman Instruments (Fullerton, CA, USA), equipped with a diode array detection (DAD) system. The instrument was under control of a Compact Deskpro personal computer running Beckman System Gold software. CZE was carried out in fused-silica capillary tubing of 37 cm (30 cm effective length)375 mm I.D. purchased from Composite Metal Services (Worcester, UK). The capillary was thermostatted. Temperatures ranging from 25 to 408C were selected to carry out separations. Samples were injected hydrodynamically using N 2 pressure of 0.5 p.s.i. (1 p.s.i.56894.76 Pa). For separation, voltages ranging from 15 to 25 kV (anode on sampling end) were applied. Electropherograms were recorded at detection wavelengths of 210 nm. The pH of the running electrolytes was measured using a Titriprocessor (Model 670) with a combined LL glass electrode from Metrohm (Herisau, Switzerland).. 2.2. Chemicals All chemicals were of analytical-reagent grade and.
(3) A.L. Crego et al. / J. Chromatogr. A 917 (2001) 337 – 345. 339. used as received. Sodium dihydrogenphosphate, phosphoric acid, triethanolamine hydrochloride and ethanesulfonic acid were purchased from Aldrich (Milwaukee, WI, USA); formic acid, dimethyl sulfoxide (DMSO), sodium hydroxide (NaOH) and hydrochloric acid (HCl) were supplied by Merck (Darmstadt, Germany); glacial acetic acid was from Sigma (St. Louis, MO, USA); b-cyclodextrin was purchased from Fluka (Buchs, Switzerland). Methanol (MeOH) was of HPLC grade from Scharlab (Barcelona, Spain). The solutions for calibration of the pH electrode (pH values 2.00, 4.00, and 7.00) were purchased from Panreac (Barcelona, Spain). Water was purified by using a Milli-Q system from Millipore. The standard of verapamil hydrochloride was purchased from Aldrich, imidazole from Fluka, ketoconazole and clotrimazole from Sigma, itraconazole from Janssen Pharmaceutica (Beerse, Belgium), fluconazole and voriconazole from Pfizer (New York, NY, USA), terbinafine from Novartis Pharma (Basel, Switzerland), and GW-product was provided by GlaxoWellcome (Madrid, Spain). Molecular structures of these compounds are shown in Fig. 1 except for GW-product which is under development within GlaxoWellcome Group Research.. 2.3. Preparation of samples, buffers and capillary Stock solutions of the different compounds were prepared in DMSO at a concentration of 2 mg / ml. All sample solutions were prepared by adding appropriate aliquots of stock solutions to methanol–water (1:1, v / v). Two samples were used as test mixtures to show the separations obtained with different running electrolytes: (i) imidazole (5 mg / ml), ketoconazole (5 mg / ml), clotrimazole (3 mg / ml), terbinafine (5 mg / ml), verapamil (5 mg / ml), GWproduct (15 mg / ml), and itraconazole (5 mg / ml); (ii) imidazole (5 mg / ml), ketoconazole (5 mg / ml), clotrimazole (3 mg / ml), terbinafine (5 mg / ml), verapamil (5 mg / ml), GW-product (15 mg / ml), itraconazole (5 mg / ml), fluconazole (10 mg / ml), and voriconazole (10 mg / ml). Eight solutions with concentrations in the range 0.5–20 mg / ml were used as standard solutions to study the linearity of the detector response. Each standard solution contained ketoconazole, clotrimazole, terbinafine, verapamil, itraconazole, fluconazole, and voriconazole. In order to study the effect of the pH, the. Fig. 1. Molecular structures for the compounds studied except for the GW-product whose structure is confidential information (it is a basic drug currently under development within the GlaxoWellcome Research Group).. phosphate running buffers with pH values ranging from 2.0 to 4.0 were prepared by adjusting a 0.025 M aqueous solution of NaH 2 PO 4 to pH required with 0.5 M H 3 PO 4 . To study the effect of the concentration of phosphate in the running buffer, different buffers with concentrations ranging from 0.025 to 0.1 M were prepared by adding appropriate aliquots of 0.5 M H 3 PO 4 into water and adjusting to pH 2.3 with 0.1 M NaOH. Additives such as triethanolamine, ethanesulfonic acid, or b-cyclodextrin were added in the latter phosphate running buffers before adjusting to pH 2.3 with 0.1 M NaOH. Finally, other running electrolytes were prepared by adding appropriate aliquots of formic or / and acetic acid into water, measuring their pH values. All.
(4) 340. A.L. Crego et al. / J. Chromatogr. A 917 (2001) 337 – 345. electrolyte solutions were filtered through 0.45-mm pore size disposable nylon filters from Millipore. Before first use, a new capillary was preconditioned by rinsing with 1 M NaOH for 30 min, followed by a 15 min rinse with water. At the start of each day, the capillary was conditioned with the running electrolyte for 15 min, and two injections with a solution of methanol–water (1:1, v / v) were achieved to equilibrate the system. In order to increase migration time reproducibility, the capillary was rinsed between injections with the running electrolyte for 2 min. In addition, this rinsing step is needed to eliminate those components of the sample still remaining in the capillary during the analysis time. An injection of running electrolyte (1 s) after the sample zone is used to improve the precision by avoiding a cross-contamination [42] and to prevent loss of sample when the separation is started, due to the buffer and sample expansion [43]. At the end of each day, the capillary was rinsed with MeOH for 2 min, 0.1 M NaOH for 2 min, 0.1 M HCl for 2 min and water for 5 min.. 3. Results and discussion. the instrumental parameters were fixed at 3 s for the hydrodynamic injection, at 258C for the separation temperature and at 15 kV for the applied voltage. Secondly, the effect on the separation of instrumental parameters (injection volume, applied voltage, and separation temperature) was studied. Fig. 2 shows the electropherograms obtained for a mixture of seven compounds using a phosphate running buffer at a pH ranging from 2.0 to 4.0. It can be observed that the pH of the separation buffer has a major influence on the separation of these analytes. According to these electropherograms, the best pH to perform the separation of these compounds ranges from pH 2.0 to 2.5. In fact, at this pH, these analytes are fully ionized and are separable by CZE with the electroosmotic flow virtually eliminated [46]. Under these conditions, it was possible to use the same running buffer during the whole day with good repeatability in the separations, because buffer depletion (acidification and alkalinisation of running electrolyte in the anode and cathode reservoirs) [47] is negligible in practice [48]. In Table 1 it can be observed that the values for the plate number in phosphate buffer are the highest when compared to those obtained in formic and. 3.1. Method development The use of water or an organic solvent with low conductivity has shown to improve peak efficiency by stacking [44]. The optimization of the separation conditions for all the antifungals studied in this work was carried out by preparing the solutions of analytes in methanol–water (1:1, v / v). This hydro–organic mixture increases the solubility of compounds with low solubility in water and avoids evaporation [45] when only one organic solvent is used. The highest sensitivity for ketoconazole, clotrimazole, itraconazole, fluconazole, voriconazole and verapamil was obtained at about 198 nm, but improved sensitivity for terbinafine was obtained at 220 nm (data not shown). Thus, a wavelength of 210 nm was chosen for the analysis of all compounds studied. The method development was performed by optimizing initially the chemical parameters such as pH, concentration, and type of running electrolyte, as well as the use of a few additives. In this first step,. Fig. 2. Electropherograms of a mixture of seven basic compounds showing the effect of the pH on the CZE separation with phosphate buffer (¯0.025 M). Capillary, 37 cm (effective length 30 cm)375 mm I.D. Applied voltage, 15 kV. UV detection at 210 nm. Temperature, 258C. Hydrodynamic injection, 0.5 p.s.i. for 3 s. Compounds (see Section 2.3): (1) imidazole; (2) ketoconazole; (3) clotrimazole; (4) terbinafine; (5) verapamil; (6) GW-product; and (7) itraconazole..
(5) A.L. Crego et al. / J. Chromatogr. A 917 (2001) 337 – 345. 341. Table 1 Effect of the concentration and type of the running electrolyte on the separation Ketoconazole. Clotrimazole. Terbinafine. Verapamil. GW-product. Itraconazole. Running electrolyte. Time (min) Plates Resolution. 4.2 106 000. 4.9 98 000 12.8. 5.2 91 000 3.3. 5.8 72 000 8.6. 6.2 48 000 5.2. 7.2 26 000 7.4. 0.025 M pH 2.31 64 mA. Time (min) Plates Resolution. 4.2 128 000. 4.8 107 000 12.0. 5.0 104 000 3.7. 5.8 80 000 11.5. 6.2 48 000 5.5. 7.6 25 000 8.3. 0.050 M pH 2.30 107 mA. Time (min) Plates Resolution. 4.9 130 000. 5.5 112 000 9.0. 5.7 106 000 3.4. 6.8 81 000 14.5. 7.3 49 000 5.1. 9.1 25 000 9.3. 0.100 M pH 2.32 185 mA. Time (min) Plates Resolution. 2.8 47 000. 3.2 50 000 9.1. 3.3 45 000 1.9. 3.5 31 000 3.0. 3.8 31 000 2.7. 4.2 19 000 4.1. 0.050 M pH 2.55 24 mA. Time (min) Plates Resolution. 3.0 64 000. 3.6 61 000 11.6. 3.7 49 000 2.2. 4.0 37 000 3.6. 4.3 41 000 3.2. 4.8 25 000 4.8. 0.100 M pH 2.30 36 mA. Time (min) Plates Resolution. 3.3 77 000. 4.0 76 000 14.6. 4.3 72 000 2.8. 4.6 57 000 4.4. 4.9 51 000 3.5. 5.4 35 000 5.3. 0.200 M pH 2.15 49 mA. Time (min) Plates Resolution. 3.2 79 000. 3.4 106 000 3.7. 3.5 53 000 1.9. 3.8 30 000 3.8. 4.2 8500 3.0. 4.9 5000 3.0. 0.050 M pH 2.95 7 mA. Time (min) Plates Resolution. 3.4 77 000. 3.7 95 000 6.3. 3.8 56 000 2.1. 4.1 34 000 3.8. 4.5 17 000 3.2. 5.2 8500 3.9. 0.100 M pH 2.80 10 mA. Time (min) Plates Resolution. 3.6 73 000. 4.0 77 000 8.6. 4.3 55 000 2.1. 4.6 32 000 3.5. 4.9 24 000 3.1. 5.5 15 000 4.5. 0.2000 M pH 2.65 14 mA. Time (min) Plates Resolution. 3.5 70 000. 4.2 63 000 10.7. 4.3 56 000 2.2. 4.6 44 000 3.6. 4.9 36 000 3.2. 5.5 19 000 4.8. 0.05 / 0.05 M pH 2.45 24 mA. Time (min) Plates Resolution. 3.8 66 000. 4.6 60 000 11.9. 4.8 58 000 2.3. 5.1 46 000 3.8. 5.4 41 000 3.2. 6.1 27 000 5.1. 0.1 / 0.1 M pH 2.35 33 mA. Phosphate. Formic acid. Acetic acid. Acetic–formic acids. Capillary, 37 cm (effective length 30 cm)375 mm I.D. Hydrodynamic injection, 0.5 p.s.i. for 3 s. Applied voltage, 15 kV. UV detection at 210 nm. Temperature, 258C. Average values for n53.. acetic acids and their mixtures, but migration times are also the highest. Formic acid provides better results (probably because it generates more acid pH values) than acetic acid or the acetic acid–formic acid mixture as far as efficiency and resolution are concerned, but the migration times obtained with these running electrolytes were very similar. On the other hand, in general terms, efficiency and res-. olution improved when the running electrolyte concentration was increased, but as increases in current intensities were also obtained, the use of high concentrations is only recommended if a stable baseline can be obtained. Therefore, the concentration of phosphate is limited at a maximum of 0.025 M. The use of some additives (b-cyclodextrin,.
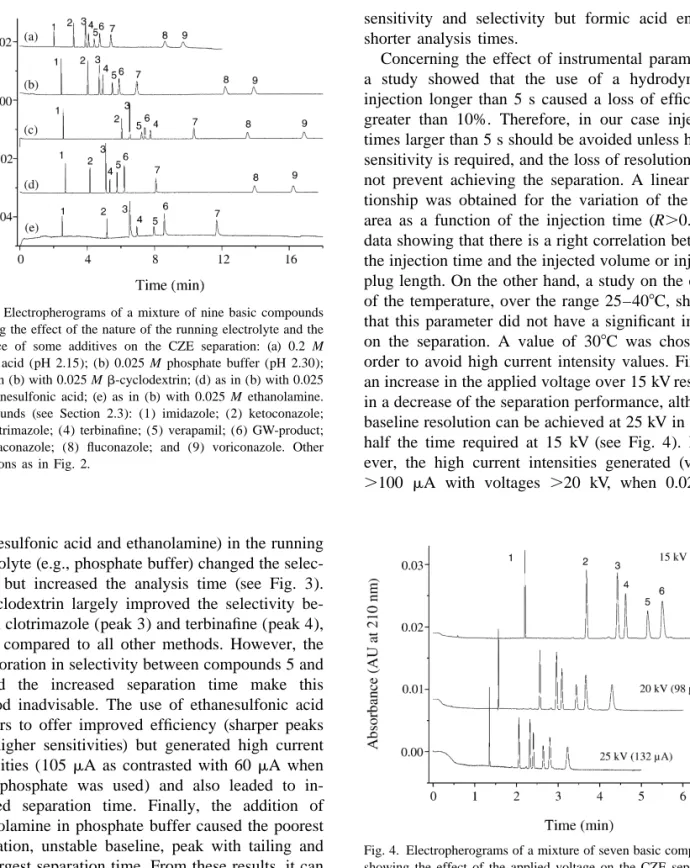
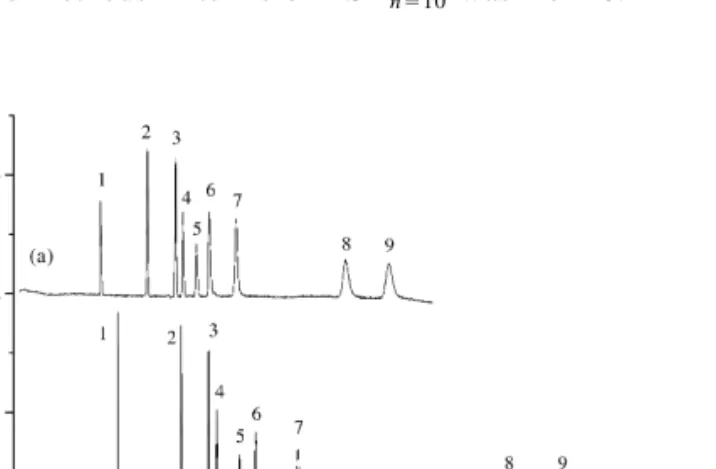
(6) 342. A.L. Crego et al. / J. Chromatogr. A 917 (2001) 337 – 345. Fig. 3. Electropherograms of a mixture of nine basic compounds showing the effect of the nature of the running electrolyte and the presence of some additives on the CZE separation: (a) 0.2 M formic acid (pH 2.15); (b) 0.025 M phosphate buffer (pH 2.30); (c) as in (b) with 0.025 M b-cyclodextrin; (d) as in (b) with 0.025 M ethanesulfonic acid; (e) as in (b) with 0.025 M ethanolamine. Compounds (see Section 2.3): (1) imidazole; (2) ketoconazole; (3) clotrimazole; (4) terbinafine; (5) verapamil; (6) GW-product; (7) itraconazole; (8) fluconazole; and (9) voriconazole. Other conditions as in Fig. 2.. ethanesulfonic acid and ethanolamine) in the running electrolyte (e.g., phosphate buffer) changed the selectivity but increased the analysis time (see Fig. 3). b-Cyclodextrin largely improved the selectivity between clotrimazole (peak 3) and terbinafine (peak 4), when compared to all other methods. However, the deterioration in selectivity between compounds 5 and 6 and the increased separation time make this method inadvisable. The use of ethanesulfonic acid appears to offer improved efficiency (sharper peaks and higher sensitivities) but generated high current intensities (105 mA as contrasted with 60 mA when only phosphate was used) and also leaded to increased separation time. Finally, the addition of ethanolamine in phosphate buffer caused the poorest separation, unstable baseline, peak with tailing and the largest separation time. From these results, it can be stated that the best separations for the group of nine compounds studied are obtained using a 0.025 M phosphate buffer (pH 2.30) or a 0.2 M formic acid (pH 2.15), both without additives. Phosphate buffer can be a good choice in order to obtain a better. sensitivity and selectivity but formic acid enables shorter analysis times. Concerning the effect of instrumental parameters, a study showed that the use of a hydrodynamic injection longer than 5 s caused a loss of efficiency greater than 10%. Therefore, in our case injection times larger than 5 s should be avoided unless higher sensitivity is required, and the loss of resolution does not prevent achieving the separation. A linear relationship was obtained for the variation of the peak area as a function of the injection time (R.0.999), data showing that there is a right correlation between the injection time and the injected volume or injected plug length. On the other hand, a study on the effect of the temperature, over the range 25–408C, showed that this parameter did not have a significant impact on the separation. A value of 308C was chosen in order to avoid high current intensity values. Finally, an increase in the applied voltage over 15 kV resulted in a decrease of the separation performance, although baseline resolution can be achieved at 25 kV in about half the time required at 15 kV (see Fig. 4). However, the high current intensities generated (values .100 mA with voltages .20 kV, when 0.025 M. Fig. 4. Electropherograms of a mixture of seven basic compounds showing the effect of the applied voltage on the CZE separation with a 0.025 M phosphate buffer. Capillary, 37 cm (effective length 30 cm)375 mm I.D. UV detection at 210 nm. Temperature, 308C. Hydrodynamic injection, 0.5 p.s.i. for 5 s. Compounds (see Section 2.3): (1) imidazole; (2) ketoconazole; (3) clotrimazole; (4) terbinafine; (5) verapamil; (6) GW-product; and (7) itraconazole..
(7) A.L. Crego et al. / J. Chromatogr. A 917 (2001) 337 – 345. phosphate running buffer was used) together with the loss in the separation capacity and sensitivity discourage the use of high applied voltages (.20 kV) unless higher sample through-put is desired. In conclusion, as it can be seen in Fig. 5, the use of CZE with 0.2 M formic acid (pH 2.15) or 0.025 M phosphate buffer (pH 2.3) as running electrolytes enables the separation of all compounds studied (including seven antifungals) in less than 10 min at an applied voltage of 20 kV and a temperature of 308C. These conditions provide a good compromise between resolution, analysis time, and current intensity.. 3.2. Analytical characteristics of the method Upon optimization of the separation conditions for the antifungals, the analytical characteristics of the method were investigated. The parameters involved were precision, linearity, sensitivity, LODs, and LOQs. Precision (repeatability and reproducibility) was assessed as relative standard deviation (RSD) for all studied antifungal compounds studied. Repeatability on 10 consecutive injections obtained for the developed methods in terms of RSD n510 was from 0.1. Fig. 5. Electropherograms of a mixture of nine basic compounds obtained by CZE using the optimized methods: (a) 0.2 M formic acid (pH 2.15); (b) 0.025 M phosphate buffer (pH 2.30). Compounds (see Section 2.3): (1) imidazole; (2) ketoconazole; (3) clotrimazole; (4) terbinafine; (5) verapamil; (6) GW-product; (7) itraconazole; (8) fluconazole; and (9) voriconazole. Applied voltage, 20 kV. Other conditions as in Fig. 4.. 343. to 0.3% for migration times, from 1.4 to 3.4% for peak areas, and from 2.3 to 4.7% for the number of theoretical plates. Reproducibility was assessed on 5 different days, each injection by duplicate. RSD n510 values from 0.3 to 1.0% for migration times, from 1.4 to 4.3% for peak areas, and from 2.7 to 5.3% for the number of theoretical plates were obtained. Although the precision obtained in the migration times and peak areas was satisfactory, the possibility of using an internal standard (I.S.), imidazole or verapamil was also tested. Thus, repeatabilities for relative migration times of different antifungals studied were better than 0.1% and reproducibilities were better than 0.4% when verapamil was used to calculate the relative migration times. On the other hand, repeatabilities for peak area ratios (antifungal / verapamil) were better than 1.5% and reproducibilities were better than 2.2%. However, there was not a significant improvement in the values for the precision neither for relative migration times nor peak area ratios when imidazole was used as I.S. instead of verapamil. This result indicates that imidazole is not a good choice as I.S. possibly due to its migration times, since imidazole had the smallest migration time whereas verapamil’s migration time was intermediate [49,50]. On the other hand, the reproducibility of the method was also determined as the RSD for interday calibration slopes using new running electrolytes every day (n55). Values from 1.5 to 2.7% were obtained using peak areas to establish the calibration plots for each standard antifungal compound. Reproducibilities better than 1.0% were obtained when verapamil was used as I.S. to calculate the peak area ratios (antifungal / verapamil) employed in the calibration plots. Results obtained for linearity, sensitivity, LODs and LOQs are grouped in Table 2. The calibration plots for the six standard antifungals studied showed linear ranges for concentrations between 0.5 and 2.0 and 15 mg / ml (see Table 2) using both, peak areas (R 2 .0.999) and peak heights (R 2 .0.996). The sensitivity was measured as the slope of the calibration lines using peak heights for each one of the six studied standard antifungals investigated. These values show that the use of phosphate buffer as running electrolyte enables to obtain a better sensitivity than formic acid. The highest value was obtained for.
(8) A.L. Crego et al. / J. Chromatogr. A 917 (2001) 337 – 345. 344. Table 2 Results for the linearity, sensitivity, limits of detection (LODs) and limits of quantitation (LOQs) obtained by CZE using the optimized methods: (a) 0.2 M formic acid (pH 2.15) and (b) 0.025 M phosphate buffer (pH 2.30) Compound. Linearity a (range: mg / ml). Analytical characteristics Formic acid b. Ketoconazole Clotrimazole Terbinafine Itraconazole Fluconazole Voriconazole. 0.5–15.0 0.5–15.0 0.5–15.0 1.0–15.0 2.0–15.0 2.0–15.0. Phosphate buffer. Sensitivity (AU ml / mg). LOD (mg / ml). LOQ (mg / ml). Sensitivity (AU ml / mg). LOD (mg / ml). LOQ (mg / ml). 0.00173 0.00277 0.00150 0.00069 0.00038 0.00038. 0.35 0.22 0.40 0.87 1.60 1.60. 1.16 0.72 1.30 2.90 5.20 5.20. 0.00198 0.00310 0.00178 0.00083 0.00046 0.00046. 0.20 0.12 0.22 0.50 0.90 0.90. 0.62 0.40 0.72 1.60 3.00 3.00. Capillary, 37 cm (effective length 30 cm)375 mm I.D. Hydrodynamic injection, 0.5 p.s.i. for 5 s. Applied voltage, 20 kV. Temperature, 308C. UV detection at 210 nm. a At least five standard solutions, each solution injected twice. b Measured as the slope of the calibration line using peak heights. The equations for the calibration lines were calculated using at least five standard solutions, each solution injected twice.. clotrimazole, and the lowest values for fluconazole and voriconazole. On the other hand, the values of the LOD and LOQ (Table 2) were calculated from the calibration plots obtained using peak heights: LOD is the concentration corresponding to a signalto-noise ratio of 3, and LOQ is the concentration corresponding to a signal-to-noise ratio of 10. The noise was estimated as the largest deviation of the detector signal from the baseline measured in a section of about 5 min in the absence of analyte and at 210 nm. The noise values (1.2?10 24 AU with phosphate buffer, and 2.0?10 24 AU with formic acid) show that the use of phosphate buffer as running electrolyte generates a smaller noise than formic acid. Therefore, the use of phosphate buffer enables smaller background noise and higher sensitivities than formic acid, which results in lower LODs and LOQs. Thus, when phosphate buffer is used as running electrolyte the lowest LOD was obtained for clotrimazole (0.12 mg / ml) and the highest value for fluconazole and voriconazole (0.90 mg / ml). Also, the lowest and the highest LOQ were, respectively, 0.40 mg / ml for clotrimazole and 3.00 mg / ml for fluconazole and voriconazole.. 4. Conclusions The present work is intended to demonstrate the. potential of CZE to achieve fast and very efficient separations of a variety of antifungals with fusedsilica capillaries with no additives in the running electrolyte. Resolutions better than 1.5 in less than 10 min are obtained using 0.025 M phosphate buffer (pH 2.30) or 0.2 M formic acid (pH 2.15), with an applied voltage of 20 kV and a temperature of 308C. The pH of the running electrolyte has a major influence on the separation of these analytes, and the best condition is at acidic medium (pH about 2). Phosphate buffer can be a good choice in order to obtain a better sensitivity and selectivity but formic acid enables shorter analysis times. The addition of b-cyclodextrin or ethanesulfonic acid to a phosphate buffer has also demonstrated that, for some analytes, these additives can lead to improved selectivity or sensitivity, respectively, but at the expense of increased separation time. Therefore, the use of these additives should be considered in the future development of related methods.. Acknowledgements A.L.C. thanks GlaxoWellcome for his stay at its R&D Center in Madrid (Spain) within a collaborative work with the Department of Analytical Chemis´ The authors also try of the University of Alcala. thank M.C. Marina for linguistic assistance..
(9) A.L. Crego et al. / J. Chromatogr. A 917 (2001) 337 – 345. References [1] M.S. Saag, W.E. Dismukes, Antimicrob. Agents Chemother. 32 (1988) 1. [2] J.E. Bennett, in: A. Goodman, A. Gilman, T.W. Rall, A.S. Nies, P. Taylor (Eds.), Goodman and Gilman’s The Pharmacological Basis of Therapeutics, Pergamon Press, New York, 1990, p. 1165, Chapter 50. [3] T.K. Daneshmend, D.W. Warnock, Clin. Pharmacokinet. 8 (1983) 17. [4] V. Joly, J. Bolard, P. Yeni, Antimicrob. Agents Chemother. 36 (1992) 1799. [5] C.L. Terrel, C.S. Hughes, Mayo Clin. Proc. 67 (1992) 69. [6] J.A. Como, W.E. Dismukes, New Engl. J. Med. 330 (1994) 263. [7] R.C. Heel, R.N. Brogden, A. Carmine, P.A. Morley, T.M. Speight, G.S. Avery, Drugs 23 (1982) 1. [8] Z. Itani, Med. Welt. 23 (1972) 498. [9] A. Espinel-Ingroff, S. Shadomy, R.J. Gebhart, Antimicrob. Agents Chemother. 26 (1984) 5. [10] S.M. Grant, S.P. Clissold, Drugs 37 (1989) 310. [11] P.F. Troke, R.J. Andrews, K.W. Brammer, M.S. Marriott, K. Richardson, Antimicrob. Agents Chemother. 28 (1985) 815. [12] S.M. Grant, S.P. Clissold, Drugs 39 (1990) 877. [13] S.F. Kowalsky, D.M. Dixon, Clin. Pharm. 10 (1991) 179. [14] B. Dupont, J. Am. Acad. Dermatol. 23 (1990) 607. [15] H.J. Schmitt, F. Edwards, J. Andrede, Y. Niki, D. Armstrong, Chemotherapy 36 (1992) 118. [16] R.P. Dickinson, A.S. Bell, C.A. Hitchcock, S. Narayanaswami, S.J. Ray, K. Richardson, P.F. Troke, Bioorg. Med. Chem. Lett. 6 (1996) 2031. [17] M.V. Martin, J. Yates, C.A. Hitchcock, Antimicrob. Agents Chemother. 41 (1997) 13. ¨ Science 224 (1984) 1239. [18] G. Petrany, N.S. Ryder, A. Stutz, [19] N.S. Ryder, Antimicrob. Agents Chemother. 27 (1985) 252. ¨ J. Med. Chem. [20] P. Nussbaumer, I. Leitner, K. Mraz, A. Stutz, 38 (1995) 1831. [21] E.R.M. Kedor-Hackmann, M.M.F. Nery, M.I.R.M. Santoro, Anal. Lett. 27 (1994) 363. [22] K.H. Yuen, K.K. Peh, J. Chromatogr. B 715 (1998) 436. [23] C. Valenta, Pharmazie 47 (1992) 641. [24] S. Allenmark, A. Edebo, K. Lindgren, J. Chromatogr. 532 (1990) 203. [25] J.M. Poirier, M. Lebot, P. Descamps, M. Levy, G. Cheymol, Ther. Drug Monit. 16 (1994) 596. [26] N. Rifai, M. Sakamoto, O. Platt, C. Brugnara, Ther. Drug Monit. 17 (1995) 522.. 345. [27] D. Compas, D.J. Touw, P.N.F.C. de Goede, J. Chromatogr. B 687 (1996) 453. [28] K.K. Hosotsubo, H. Hosotsubo, M.K. Nishijima, T. Okada, N. Taenaka, I. Yoshiya, J. Chromatogr. 529 (1990) 223. [29] K. Inagaki, J. Takagi, E. Lor, M.P. Okamoto, M.A. Gill, Ther. Drug Monit. 14 (1992) 306. [30] F.J. Flores-Murrieta, V. Granados-Soto, E. Hong, J. Liq. Chromatogr. 17 (1994) 3803. [31] C.H.W. Koks, H. Rosing, P.L. Meenhorst, A. Bult, J.H. Beijnen, J. Chromatogr. B 663 (1995) 345. [32] R. Ferretti, B. Gallinella, F. La Torre, L. Zanitti, Chromatographia 47 (1998) 649. [33] P.K. Owens, A.F. Fell, M.W. Coleman, J.C. Berridge, Enantiomer 4 (1999) 79. ¨ H.P. Keller, P. Shaub, C. Delaborde, H. Humbert, [34] J. Denouel, J. Chromatogr. B 663 (1995) 353. ¨ M. Roy, L. Le Saux, P. Shaub, J. [35] H. Zehender, J. Denouel, Chromatogr. B 664 (1995) 347. [36] S.G. Cardoso, E.E.S. Schapoval, J. Pharm. Biomed. Anal. 19 (1999) 809. [37] W. Thormann, C.X. Zhang, A. Schmutz, Ther. Drug Monit. 18 (1996) 506. [38] W. Thormann, Y. Aebi, M. Lanz, J. Caslavska, Forensic Sci. Int. 92 (1998) 157. [39] C.X. Zhang, F. von Heeren, W. Thormann, Anal. Chem. 67 (1995) 2070. [40] F. von Heeren, R. Tanner, R. Theurillat, W. Thormann, J. Chromatogr. A 745 (1996) 165. ´ J.M. Moreda, A. Cid, J. Chroma[41] A. Arranz, C. Echevarrıa, togr. A 871 (2000) 399. [42] K.D. Altria, N.G. Clayton, R.C. Harden, M. Hart, J. Hevizi, J. Makwana, M.J. Portsmouth, Chromatographia 39 (1994) 180. [43] J.H. Knox, K.A. McCormack, Chromatographia 38 (1994) 279. [44] M. Albin, P.D. Grossman, S.E. Moring, Anal. Chem. 65 (1993) 489. [45] S.E. Moring, J.C. Colburn, P.D. Grossman, H.H. Lauer, LC–GC Int. 3 (1990) 46. [46] C. Schwer, E. Kenndler, Anal. Chem. 63 (1991) 1801. [47] T. Zhu, Y.L. Sun, C.X. Zhang, D.K. Ling, Z.P. Sun, J. High Resolut. Chromatogr. 17 (1994) 563. [48] K.D. Altria, H. Fabre, Chromatographia 40 (1995) 313. [49] B.R. Thomas, X.G. Fang, X. Chen, R.J. Tyrell, S. Ghodbane, J. Chromatogr. A 657 (1994) 383. [50] P. Coufal, H.A. Claessens, C.A. Cramers, J. Liq. Chromatogr. 16 (1993) 3623..
(10)
Figure
Documento similar
ABSTRACT Transformation of the Specialized Knowledge of Future Primary Teachers on Fraction Division
From the phenomenology associated with contexts (C.1), for the statement of task T 1.1 , the future teachers use their knowledge of situations of the personal
In the preparation of this report, the Venice Commission has relied on the comments of its rapporteurs; its recently adopted Report on Respect for Democracy, Human Rights and the Rule
La solución que se ha planteado, es que el paso o bien se hiciese exclusivamente por el adarve de la muralla, o que una escalera diese acceso por la RM evitando la estancia (De
The lignin obtained by lowering the pH value of the black liquor from pH 10.72 to pH 2 using phosphoric acid had different thermal properties than the other precipitated
At the same time, higher values of the quantum efficiency were found in the photocatalytic degradation of phenol, methyl 4-hydroxybenzoate and 4-chlorophenol with P25, whereas in
Díaz Soto has raised the point about banning religious garb in the ―public space.‖ He states, ―for example, in most Spanish public Universities, there is a Catholic chapel
The broad “WHO-ICF” perspective on HrWB provided at Figure 1 has a significant implication also for HRQoL. The develop- ment of ICF and its conceptual approach has challenged to
The Global Compact for Safe, Orderly and Regular Migration (Global Compact for Migration hereinafter) has been considered the first instrument to comprehensively address all
