PCB Contamination in surface sediments in the coastal waters of Costa Rica
10
0
0
Texto completo
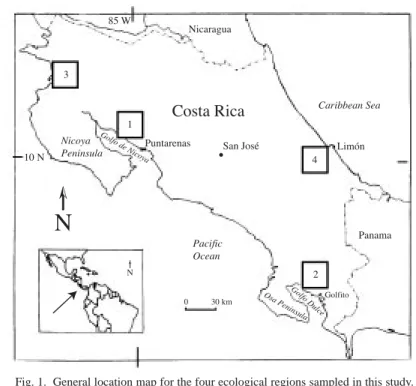
(2) 2. REVISTA DE BIOLOGÍA TROPICAL. particulate phases in the river water, with the Previous studies have been undertaken to dissolved phase and atmospheric deposition assess the levels of PCB contamination in being significantly less. Correlation was found marine sediments in areas thought to have a sigbetween the PCB congeners in street dust and nificant contamination problem. Levels as high the congeners found in the river sediments. as 16 267 pg g-1 dw (picograms per gram dry weight of sediment, sum of 23 congeners) were found in the Arkona Basin of the Western Baltic MATERIALS AND METHODS Sea and Oder River estuary (Dannenberger et al 1997). The drainage basin is highly agricultural Study area: Sediment samples were and pesticide contamination is high. obtained from the coastal areas of Costa Rica Concentration distribution was attributed to sedin four diverse ecological regions (Figure 1). iment dynamics and resuspension and transport Bahia Culebra, Gulf of Papagayo is a region of processes. Lee et al (2001) similarly investigattropical upwelling on the northwestern Pacific ed the PCB contamination in estuarine sedicoast and is composed of highly productive ments on the west coast of Korea. waters and biologically rich reefs. The contiConcentrations ranged from near the detection nental platform is relatively narrow, favoring limits to greater than 580 ng/g-OC (normalized the influence of oceanic waters on the coastal to organic content). The source area is contamiwaters with periods when unusually colder nated by shipping activities, several factories waters may be present (Jiménez 2001). Golfo and large amounts of sewage input. As the samDulce is a deep (up to 200 m) fault-bounded ple location’s distance from the proposed confjord-like gulf located on the southwestern taminant source increased, the total PCB Pacific coast. The western side of the gulf is concentrations decreased and the relative prothe Osa Penninsula which has experienced litportion of lower chlorinated biphenyls tle human influence. The port city of Golfito is increased. A more recent fresh water investigation found total PCB concentrations in soils and sediments from two high altitude European mountain lakes of 0.41–15 ng g-1 dw, with the authors concluding the absence of major pollution sources in these high mountain regions (Grimalt et al. 2003). In contrast, a study by Loganathan et al (1997) on the PCB contamination in a polluted sewershed on the Buffalo River in New York is typical of results elsewhere in the United States influenced by intense human activities. The majority of total PCB concentrations ranged from Fig. 1. General location map for the four ecological regions sampled in this study. 1 – Golfo de Nicoya, 2 = Golfo Dulce, 3 = Bahía Culebra, 4 = Limón. 100-270 ng g-1 dw in.
(3) INTERNATIONAL JOURNAL OF TROPICAL BIOLOGY AND CONSERVATION. on the eastern side of the gulf and was found in a previous study to have considerable metal and organic pollutant contamination (Spongberg and Davis 1999). Golfo de Nicoya is a tropical estuary on the central Pacific coast. Its length is about 90 km and the width is about 50 km (Vargas 1995). The quality of sediments in Golfo de Nicoya is influenced by the thriving cities of Punto Morales and Puntarenas and the water shed for the capital city of San Jose. The area of Limon was the only sampling location of the Caribbean side of the country. Limon is surrounded by shallow warm waters with numerous coral reefs. The sediment quality in the nearshore environment is dominated by human activities of the city and port and the abundant fruit plantations the dominate the landscape. Samples for analyses were obtained during five separate sampling trips as follows: January, 1996 (Golfo de Nicoya and Golfo Dulce), September, 1997 (Golfo Dulce), June, 1999 (Golfo de Nicoya, Golfo Dulce and Limon), 2001 (Bahia Culebra) and August, 2002 (Golfo de Nicoya, Bahia Culebra). Data on pesticide content for many of the Golfo Dulce samples were presented in Spongberg and Davis (1999). Analytical procedures: Samples were prepared as follows. Estuary and shallow samples were collected by hand with a clean core barrel and immediately placed in either prewashed glass jars or plastic bags, depending on the subsequent analyses. Samples were sealed and frozen immediately after collection and transferred to the University of Toledo, Toledo, Ohio still frozen. Samples were dried and refrozen until analysis. All samples were analyzed for grain size distribution using the standard hydrometer technique. Organic matter content was analyzed by thoroughly ashing the oven-dried samples in a muffle furnace at 500ºC, rehydration and drying at 100ºC and comparing pre-and post-ashing weights. The analysis of PCBs followed a modified versions of the EPA Methods 8080 and 3620 (Foreman et al. 1995). Approximately 10 to 20 g of dried sediment were extracted using a Soxtec Organic Extraction Unit for one hour,. 3. using methylene chloride or acetone:methylene chloride (1:1) as the solvents. Samples were immersed in the boiling solvent for fifteen minutes, followed by their suspension over the refluxing solvent for an additional 45 minutes. Sulfur was removed from the extracts by reaction with approximately 1 gram of freshly activated copper overnight. Separation and clean up were achieved by passing the extract through a glass column containing approximately 12 g of florisil (60/100 mesh) topped with sodium sulfate, with diethylether in hexane (3:1) as the eluant. Isooctane was added as a stabilizer. The eluate was evaporated to 2 ml or less using a rotary evaporator. One µl was used for the gas chromatographic analysis. All solvents were pesticide grade. Analyses were performed on a Hewlett Packard 6890 gas chromatograph equipped with a SPB-5 fused silica capillary column (30 m length, 0.25 mm ID, 0.25 µm film thickness, Supelco, Inc.) attached to either a 63Ni electron capture detector (HP 5890 Series II) or a mass selective detector (HP 5972). The carrier and make up gas (for ECD) gases were ultra-high purity helium and nitrogen. Oven temperature was held at 80˚C for 2 minutes and programmed to increase at 3˚C/min to 280˚C and held for 5 minutes. The injection and ECD detector temperatures were 275˚C and 320˚C, respectively. The mass selective detector was run in selective ion monitoring mode for help in identifying congeners and detecting lower concentrations. Quality control included reagent blank determination, matrix spike (0.2 and 1.0 µg/g) recovery, and precision analysis. 2,3,5trichlorobenzene was used as an internal standard. Calibration was checked routinely. Quantification of individual PCB congeners in samples was made by comparison to standard mixtures and confirmed using the extensive library of mass selective detector signatures of individual congeners. Recovery efficiencies varied between 65 and 95%. Detection limits were calculated using the area of the baseline noise over the elution time of each congener using low concentration standards. Limits of.
(4) 4. REVISTA DE BIOLOGÍA TROPICAL. detection were three times the standard deviation of the baseline noise, and averaged 0.2 ng/g. Relative standard deviation of data from five consecutive duplicate runs was 3-5%. Data reported are not corrected for blank concentrations or recovery efficiencies.. RESULTS The data on these congeners is expressed in two ways. The sum of the congeners identified in this study is presented as ΣPCBs. However, because different studies usually identify different congeners and different numbers of congeners, these studies can be difficult to compare. Therefore, the data are also presented as Total PCBs. As stated in Vanier et al (1996), 19 congeners make up about 50% by weight of all congeners in Arochlor 1242, 1253, 1262, 1254, and 1260 (Table 1). Therefore, the concentrations of these 19 congeners are summed and multiplied by 2 and reported as Total PCBs in this study. This value can, hopefully, be more useful for comparisons in future studies. Details on individual basins and individual congeners are given in a subsequent paper. Table 2 lists the PCB data for the Costa Rican sediments. Data are divided by geographic location and include the ΣPCBs and Total PCB concentrations, as well as the percentage of total concentration by number of chlorine atoms on the congener.. DISCUSSION Note that all samples except those from the Golfito area in Golfo Dulce have very low total PCB concentrations. The average sum of congeners analyzed in this study was 2.80 ng/g dw, with a standard deviation of 2.75. The average of the Total PCBs was slightly higher at 3.83, with a standard deviation of 3.66. These numbers are much lower than most values found in the United States and other ‘contaminated’ areas in temperate climates.. TABLE 1 IUPAC identification numbers, chlorine substitutions and classes of congeners used in the calculation of Total PCBs (after Vanier et al. 1996) IUPAC number. Chlorine substitutions. Isomer Class. 18* 31* 44* 49* 52* 87* 101* 110* 118* 138* 151* 153* 170* 180* 194* 195* 196* 199* 209*. 2,2’,5 2,4’,5 2,2’,3,5’ 2,2’,4,5’ 2,2’,5,5’ 2,2’,3,4,5’ 2,2’,4,5,5’ 2,3,3’,4’,6 2,3’,4,4’,5 2,2’,3,4,4’,5 2,2’,3,5,5’,6 2,2’,4,4’,5,5’ 2,2’,3,3’,4,4’,5 2,2’,3,4,4’,5,5’ 2,2’,3,3’,4,4’,5,5’ 2,2’,3,3’,4,4’,5,6 2,2’,3,3’,4,4’,5’,6 2,2’,3,3’,4,5,5’,6’ 2,2’,3,3’,4,4’,5,5’,6,6’. 3 Cl 3 Cl 4 Cl 4 Cl 4 Cl 5 Cl 5 Cl 5 Cl 5 Cl 6 Cl 6 Cl 6 Cl 7 Cl 7 Cl 8 Cl 8 Cl 8 Cl 8 Cl 10 Cl. * These 19 congeners are used in the calculation of Total PCBs.. For example, sediments along the Hudson River have been analyzed with total PCB concentrations as high as 50 ng/g dry sediment weight. However, the soils found in many areas of Costa Rica are dominated by hydrous oxide clays which do not have an affinity for sorption of these compounds. Most sediments analyzed from temperate climates are dominated by ‘young’ 2:1 silicate clay minerals that readily sorb many contaminants. The organic fraction in the Costa Rican sediments ranges from low values of 0.26% to great than 3%. Organic contaminants, such as PCBs, have a greater affinity to sorb to the organic fraction than to the clays. Another reason why the values of Total and Sum PCBs are low might be the warm temperatures in this tropical area. Degradation reactions tend to increase as temperature increases. Therefore, if PCBs were present they may be degrading in this favorably warm climate. Although the possibility that these.
(5) INTERNATIONAL JOURNAL OF TROPICAL BIOLOGY AND CONSERVATION. 5. TABLE 2 Data on PCB concentrations in sediments from the four geographic areas of Costa Rica Internal ID Golfo de Nicoya. Sum Total ng/g dw *1000. 4F 13C 5F 10C PMC 22C 3F 18C 8C 17C 9C. 4717 4732 3892 3730 2888 3200 2893 2403 2428 2693 1507. 6949 6488 5793 5491 4836 4749 4057 3869 3578 3372 2215. 2.11 3.29 0.32 4.30 0.00 4.75 2.22 3.23 6.30 7.27 3.40. 12.89 8.46 6.69 11.85 17.44 15.47 13.01 15.22 14.23 15.55 7.38. 31.32 29.41 13.08 17.12 31.40 30.83 37.43 31.28 27.53 27.26 25.88. 26.62 36.12 30.60 25.00 22.09 18.62 24.16 23.51 21.86 25.73 27.94. 8.94 13.37 27.74 21.78 23.26 17.05 9.02 20.89 17.82 18.17 18.50. 13.08 4.75 12.36 15.40 4.65 10.64 8.93 4.62 9.60 4.60 10.18. 5.04 4.59 9.21 4.56 1.16 2.65 5.24 1.26 2.66 1.42 6.73. 0.00 0.00 0.00 0.00 0.00 0.00 0.00 0.00 0.00 0.00 0.00. 0.00 0.00 0.00 0.00 0.00 0.00 0.00 0.00 0.00 0.00 0.00. 1496 1497. 2170 2154. 4.49 0.00. 13.12 7.32. 18.94 23.17. 17.26 43.90. 24.10 19.51. 17.04 6.10. 5.04 0.00. 0.00 0.00. 0.00 0.00. 1293 1311 1424 1234 1162 1049 960 945 949 705 783 818 503 555 463 518 420 621 297 350. 2032 1935 1931 1701 1636 1534 1500 1413 1280 1208 1180 1135 807 799 691 682 662 468 457 362. 3.60 4.58 5.55 0.00 4.05 7.28 5.62 4.24 9.45 2.97 3.90 0.00 4.82 5.19 4.70 12.38 4.23 53.16 8.91 20.00. 15.32 15.40 14.41 57.76 17.28 21.12 15.77 14.19 18.97 16.92 8.51 10.67 13.76 9.46 11.02 18.56 13.68 13.29 18.43 12.94. 28.29 24.87 30.95 34.66 34.56 29.06 33.52 25.19 22.77 28.21 36.42 41.33 24.08 25.06 29.18 23.39 25.26 15.78 32.53 24.71. 28.95 30.57 33.40 4.15 26.29 24.10 21.61 27.29 23.35 22.56 26.55 32.00 25.23 28.04 27.24 35.52 24.21 13.95 19.52 18.82. 11.13 18.36 9.71 2.35 12.87 11.20 17.97 17.59 13.58 23.69 15.32 14.67 24.08 19.72 19.69 5.45 24.21 2.33 15.18 9.41. 7.73 4.39 3.63 1.08 4.96 4.39 4.41 7.40 9.59 4.51 8.17 1.33 5.73 7.27 5.10 4.70 5.26 1.00 4.34 14.12. 4.98 1.83 2.35 0.00 0.00 2.84 1.10 4.10 2.30 1.13 1.13 0.00 2.29 5.26 3.06 0.00 3.16 0.50 1.08 0.00. 0.00 0.00 0.00 0.00 0.00 0.00 0.00 0.00 0.00 0.00 0.00 0.00 0.00 0.00 0.00 0.00 0.00 0.00 0.00 0.00. 0.00 0.00 0.00 0.00 0.00 0.00 0.00 0.00 0.00 0.00 0.00 0.00 0.00 0.00 0.00 0.00 0.00 0.00 0.00 0.00. 12271 9300 7631. 15688 12353 10875. 0.73 12.07 0.00. 7.58 18.78 5.00. 21.28 35.68 22.50. 48.77 25.95 42.50. 19.54 7.51 26.25. 2.10 0.00 3.75. 0.00 0.00 0.00. 0.00 0.00 0.00. 0.00 0.00 0.00. 7883 9151 4524. 10722 9929 7437. 9.93 16.81 0.00. 16.65 16.45 12.57. 40.27 40.72 36.13. 22.91 20.42 21.99. 8.25 4.20 16.75. 1.99 1.40 12.57. 0.00 0.00 0.00. 0.00 0.00 0.00. 0.00 0.00 0.00. 5015 3923 3994 3830 3280. 6539 6429 5802 5106 4703. 11.69 0.00 12.40 12.06 7.42. 16.55 15.48 18.66 23.95 17.96. 39.54 34.19 41.49 35.39 37.74. 17.06 21.94 17.43 21.63 31.30. 10.23 14.19 6.32 5.00 4.61. 4.93 14.19 3.70 1.97 0.97. 0.00 0.00 0.00 0.00 0.00. 0.00 0.00 0.00 0.00 0.00. 0.00 0.00 0.00 0.00 0.00. 3257. 4604. 8.53. 20.44. 37.67. 21.17. 9.97. 2.22. 0.00. 0.00. 0.00. 3221. 4515. 0.97. 9.69. 22.83. 44.60. 18.45. 3.45. 0.00. 0.00. 0.00. Punta Morales, Playa Blanca Punta Morales Barranca River Car ferry lane Puntarenas Mid-gulf Punta Morales, Playa Blanca Estero Puerto Alto Mid-gulf Estero Pitahaya Vieja Between Islas Caballo and Bejuco 2C North of Isla Chira PMA Punta Morales, Frente a Cortezas inlet 20C Puntarenas 19C Puntarenas 16C Río Esquinas PMA-X Punta Morales, Mangroves 20D Río Esquinas 23C Lagarto River 14C Estero Pitahaya Nueva 7C Biol Reserve, Pájaros 11C Isla Caballo 21C Puntarenas 12C Punta Morales mud flat PMC-XWC Puntarenas, Angostura 3C Berrugate Point 1C Isla Chira 6C Bejuco PMA-X Punta Morales, Mangroves 5C Bejuco PMB Isla Caballo 4C Bejuco PMB Isla Caballo Golfo Dulce 25D Port of Golfito 7D deep samples, 130 m GD-XA Port of Golfito, frente Hong Kong 11D deep samples, 165 m 10D deep samples, 190 m GD-XA Port of Golfito, frente Hong Kong 12D deep samples, 110 m GD-XC Port of Golfito, Frente UCR 27D deep samples, 190 m 30D deep samples, 110 m 22D Río Coto Colorado sediment plume, 95 m 21D Río Coto Colorado sediment plume, 60 m 24D Golfito Bay, south islet. 2. Percent of Sum with X No. of Chlorines on PCB congener 3 4 5 6 7 8 9. 10.
(6) 6. REVISTA DE BIOLOGÍA TROPICAL TABLE 2 (…continued) Data on PCB concentrations in sediments from the four geographic areas of Costa Rica. Internal ID Golfo de Nicoya. Sum Total ng/g dw *1000. 4D. 3151. 4487. 2.37. 8.40. 41.86. 26.44. 13.08. 7.85. 0.00. 0.00. 0.00. 3083 2563. 3970 3678. 4.24 7.11. 10.02 21.87. 20.89 38.83. 45.80 24.79. 17.83 4.85. 1.22 2.55. 0.00 0.00. 0.00 0.00. 0.00 0.00. 2703. 3555. 12.27. 19.63. 38.65. 20.26. 9.19. 0.00. 0.00. 0.00. 0.00. 2275. 3471. 1.74. 7.72. 24.21. 36.24. 24.73. 5.36. 0.00. 0.00. 0.00. 2361. 3291. 4.14. 8.15. 27.22. 36.29. 19.99. 4.21. 0.00. 0.00. 0.00. 2347. 2972. 7.72. 21.46. 39.77. 23.37. 4.01. 3.66. 0.00. 0.00. 0.00. 1406 1301 1168 1087 995 912 526 473. 2059 1892 1783 1462 1400 1334 764 612. 7.47 5.01 4.54 5.90 4.47 6.08 5.35 2.93. 7.43 15.12 12.92 12.65 10.65 12.22 18.23 9.44. 20.40 40.96 27.76 41.06 26.94 27.53 24.22 30.99. 42.07 27.75 27.23 26.63 32.89 36.22 27.98 43.71. 16.92 8.22 17.83 10.21 18.79 14.20 17.96 10.26. 5.69 2.94 8.44 3.55 6.26 3.74 6.26 2.67. 0.00 0.00 1.28 0.00 0.00 0.00 0.00 0.00. 0.00 0.00 0.00 0.00 0.00 0.00 0.00 0.00. 0.00 0.00 0.00 0.00 0.00 0.00 0.00 0.00. 1316 1733 1102 1770 1540 706. 2012 1656 923 1797 1348 769. 3.69 26.71 35.21 40.97 35.81 27.17. 43.23 20.77 9.74 24.43 12.20 16.82. 36.52 25.52 18.08 18.21 18.30 20.18. 8.06 9.20 21.48 10.15 13.00 22.64. 4.74 4.45 7.28 2.25 7.29 8.54. 1.46 13.35 8.22 2.00 13.40 4.66. 2.31 0.00 0.00 1.98 0.00 0.00. 0.00 0.00 0.00 0.00 0.00 0.00. 0.00 0.00 0.00 0.00 0.00 0.00. Limón Bay 11355 Cieneguita 8852 Estero Negro 1547 Río Moín 1481 Río Moín 1081 North of Limón 1149 Río La Estrella 985 Puerto Vargas, Río La Estrella 912 Limón water inlet 709 Río Moín 737 Moín dock 701 Moín dock 482 unknown stream close to ocean 447 Río Moín (sandy) 441 Río Bananito 428 Moín port red buoy 330 Río Vizcaya, sandy 656 Moín port red buoy 215. 15649 11400 2172 1915 1528 1426 1352 1250 1137 1080 930 658 618 618 571 535 474 365. 3.37 3.40 0.21 0.00 0.00 8.72 0.35 0.00 0.00 0.38 0.00 0.00 0.00 2.94 0.00 0.99 55.49 0.00. 11.17 8.95 15.72 8.54 18.67 7.39 8.36 9.30 10.31 10.09 8.99 13.41 14.23 19.32 6.45 16.50 12.99 17.75. 29.12 25.27 34.72 30.49 29.33 48.07 35.71 30.09 29.47 44.44 39.33 43.90 40.05 45.35 58.05 44.55 20.66 34.91. 27.35 24.50 18.06 23.17 40.00 15.11 23.55 43.67 14.11 24.02 23.60 17.07 16.15 26.06 21.35 21.59 6.61 24.85. 14.12 16.94 16.39 17.07 10.67 15.62 17.21 11.69 45.03 12.29 16.85 15.86 16.91 4.22 4.98 10.11 2.83 14.20. 10.41 15.11 14.71 20.73 1.33 4.38 13.77 4.24 1.07 6.71 10.11 8.54 11.09 2.11 8.30 4.28 1.42 8.28. 4.46 5.82 0.19 0.00 0.00 0.72 1.06 1.00 0.00 2.08 1.12 1.22 1.58 0.00 0.87 1.97 0.00 0.00. 0.00 0.00 0.00 0.00 0.00 0.00 0.00 0.00 0.00 0.00 0.00 0.00 0.00 0.00 0.00 0.00 0.00 0.00. 0.00 0.00 0.00 0.00 0.00 0.00 0.00 0.00 0.00 0.00 0.00 0.00 0.00 0.00 0.00 0.00 0.00 0.00. 15D 17D 23D 3D 13D 29D 19D 6D 15C 14D 18D 9D 8D 26D. Río Coto Colorado sediment plume, 4 m Golfito Bay, south islet, sandy Río Coto Colorado sediment plume, 74 m Río Coto Colorado sediment plume,150 m Río Coto Colorado sediment plume, 2.5 m Río Coto Colorado sediment plume, 40 m Río Coto Colorado sediment plume, 50 m Río Esquinas Deforested area Río Esquinas Deforested area Río Esquinas Río Rincón Río Rincón Río C. Colorado sediment plume, 10 m, sandy. Bahía Culebra 1F Playa Iguanita BCXD Playa Iguanita BCD Playa Iguanita 2F Playa Panamá BCXA Playa Panamá BCA Playa Panamá Limón G4 G3 5D MC-XC MC-XC 1D 16D 28D 13E G2 MCA MCA 11E 12E G1 2D MCB(G) MCB(G). 2. Percent of Sum with X No. of Chlorines on PCB congener 3 4 5 6 7 8 9. 10.
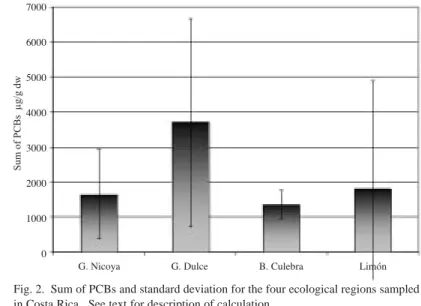
(7) INTERNATIONAL JOURNAL OF TROPICAL BIOLOGY AND CONSERVATION. 7. areas just do not have much PCB contamination should also be considered a reasonable explanation. Many of the sampling locations are remote and would not be expected to have high contamination. Previous work on these same sediments from Golfo de Nicoya and Golfo Dulce has shown that they also contain comparatively low concentrations of pesticide contaminants (Spongberg and Davis Fig. 2. Sum of PCBs and standard deviation for the four ecological regions sampled 1999). Conclusions from in Costa Rica. See text for description of calculation. that work point to either the absence of contaminaFigure 4 is a plot of the average and stantion in many areas, conpounded with the lack of dard errors for the percent of congeners with sorptive capacity within the sediments. varying numbers of chlorines (from 2-10). No The average and standard error of the Sum congeners with 10 chlorines were identified in and Total PCB concentrations for the individthese samples, however, these compounds ual areas are shown in Figures 2 and 3. The could be identified in the standard solutions. average values for Golfo de Nicoya, Papagayo Whether this is due to analytical error, chemiand the Caribbean sediments are similar at cal change during sampling and transport, or 1.66, 1.36, and 1.80 ng/g dw for the Sum whether this is indicative of the samples is not PCBs, respectively, and 2.42, 1.41, and known. Whereas the concentration data men2.42 ng/g dw for Total PCBs, respectively. tioned previously separates the sediments from However, the average Sum and Total values Golfo Dulce apart from the other areas, the disfor Golfo Dulce are 3.61 and 4.93, respectivetribution of chlorines on the Golfo Dulce PCBs ly, which is statistically significantly higher is relatively similar to those from the than the other three areas. Interestingly, Golfo Dulce is surrounded on the west and north by largely pristine, undeveloped lands, with development only in the Golfito Bay area and agriculture in the Coto Colorado watershed. The water depth in Golfo Dulce, however, is much deeper than in any of the other sampled areas, with many samples taken in waters greater than 100 meters. In general, the samples with the highest concentrations of PCBs were taken from either the deep samples in Golfo Dulce and in the heavily used port of Golfito. But, overall, all samples analyzed from Costa Rica show relatively low concentrations of PCBs Fig. 3. Total PCB and standard deviation for the four ecoand are indicative of a lower than average risk logical regions sampled in Costa Rica. See text for associated with the sediments. description of calculation..
(8) 8. REVISTA DE BIOLOGÍA TROPICAL. Fig. 4. Average and standard deviation for percent of congeners with 2-10 chlorines per PCB. = Golfo Dulce, ∆ = Bahía Culebra, ◊ = Limón.. Caribbean and Golfo Nicoya. Statistically, however, the PCBs from the Bahia Culebra area are distinct. A high percentage of these samples were dominated by congeners with fewer chlorine atoms. In fact, more than 50% of all congeners from that area contained 4 or fewer chlorines. Although it is relatively common to lose the lower chlorinated PCBs during analysis, no reason exists why this phenomenon would be biased towards samples from a particular geographic area. Therefore, this trend must be real and not an analytical artifact. The Papagayos (Bahia Culebra) samples appear to be atmospherically deposited compounds, since the lower chlorinated compounds have higher vapor pressures and thus are more likely to be carried further from their source. Alternatively, the Bahia Culebra samples may indicate rapid degradation within the sediments, since the typical pattern for PCB degradation is loss of chlorines from the biphenyl structure. Since there is no known reason why this geographic region, dominated by. = Golfo de Nicoya,. upwelling Pacific currents, ought to promote accelerated dechlorination, it is likely that these low concentration contaminants do not have a local or currently active source. This questions the validity of the calculation of Total PCBs for the Papagayos samples. The calculation is based on the percentage of congeners found is relatively unaltered Alochlor products and does not consider their redistribution upon degradation or biased partitioning during atmospheric transport. A little less apparent in Figure 4 and Table 2, but nevertheless significant is the greater percentage of higher chlorinated PCBs in the samples from the Golfito area of Golfo Dulce, and many of the samples from Golfo de Nicoya and Limon. If PCBs are degrading within the environment the compounds tend to become slowly dechlorinated. These samples that still contain high chlorinated congeners are an indication of either lack of degradation or the presence of nearby or recent releases into the environment. Golfo de Nicoya actually.
(9) INTERNATIONAL JOURNAL OF TROPICAL BIOLOGY AND CONSERVATION. contains samples displaying both the same trend found in Papagayos and in the Limon samples. It appears that within this gulf, some recent releases may be occurring. This variability within Golfo de Nicoya and Golfo Dulce is expounded upon in greater detail in the subsequent article. In conclusion, it is important to note that the overall concentrations of PCB contaminants in all sediments sampled from the four geographic regions in coastal Costa Rica are low. Current research is investigating whether these low values are due to a lack of contamination source in the local areas, or the low affinity of these sediments to adsorb the compounds and therefore a lack of retention of the contaminants within the sediments, or the rapid degradation of the compounds either prior to or following deposition. ACKNOWLEDGEMENTS For this and all work I have done in Costa Rica I sincerely thank the tremendous efforts and kindness of José Vargas, former Director of the Centro de Investigación en Ciencias del Mar y Limnología (CIMAR), and Jenaro Acuña, both at the University of Costa Rica, San Pedro. Eleazar, Davis, Ruth, and many others at CIMAR went out of their way to help make this research a success. Last, but certainly not least, I wish to thank the Costa RicaUnited States of America Foundation for Cooperation (CR-USA) for partially funding this project. RESUMEN Este articulo describe una investigación sobre las concentraciones de bifenilos policlorados (PCB) en cuatro regiones geográficas (tres en el Pacífico y una en el Caribe) costeras de Costa Rica.: Bahía Culebra, Golfo Dulce, Golfo de Nicoya, y Limón. Las concentraciones totales de PCB fueron bajas en todas las regiones excepto en el puerto de Golfito (Golfo Dulce). Las concentraciones promedio fueron de 2.80 ng /g dw, con una desviación estándar de 2.75. Las bajas concentraciones pueden estar. 9. asociadas a: la ausencia de contaminación por PCB, la degradación posterior en éste clima cálido, o la poca capacidad de absorción de los sedimentos.. REFERENCES Broman, D., C. Naf & Y. Zebühr. 1992. Occurrence and dynamics of polychlorinated dibenzo-p-dioxins and dibenzofurans and other combustion related organic pollutants in the aquatic environment of the Baltic. Chemosphere 25: 125-128. Dannenberger, D., R. Andersson & C. Rappe. 1997. Levels and patterns of polchlorinated dibenzo-p-dioxins, dibenzofurans and biphenyls in surface sediments from the Western Baltic Sea (Arkona Basin) and the Oder River estuarine system. Mar. Poll. Bull. 38: 1016-1024. Foreman, W.T., B.F. Connor, E.T. Furlong, D.G. Vaught & L.M. Merten. 1995. Methods of analysis by the U.S. Geological Survey National Water Quality Laboratory – determination of organochlorine pesticides and polychlorinated biphenyls in bottom sediment by dual capillary-column gas chromatography with electron-dapture detection. USGS Open-File Report 95-140. 78p. Grimalt, J. O.; B. L. van Drooge, A. Ribes, R. Vilanova, P. Fernandez & P. Appleby. 2004. Persistent organochlorine compounds in soils and sediments of European high altitude mountain lakes. Chemosphere 54. 1549-1561. Jiménez, C. 2001. Seawater temperature measured at the surface and at two depths (7 and 12 m) in one coral reef at Culebra Bay, Gulf of Papagayo, Costa Rica. Rev. Biol. Trop. 49: 153-161. Lee, K.T., S. Tanage & C. Koh. 2001: Contamination of polyshlorinated biphenyls (PCBs) in sediments from Kyeonggi Bay and nearby areas, Korea. Mar. Poll. Bull. 42: 273-279. Loganathan, B.G., K.N. Irvine, K. Kannan, V. Pragatheeswaran & K.S. Sajwan. 1997. Distribution of selected PCB congeners in the Babcock Street Sewer District: a multimedia approach to identify PCB sources in combined sewer overflows (CSOs) discharging to the Buffalo River, New York. Arch. Environ. Contam. Toxicol. 33: 130-40. Rappe, C. 1993. Environmental concentrations and ecotoxicological effects of PCDDs, PCDFs, and related compounds. DIOXIN 93, Organohalogen Compounds 12: 163-170..
(10) 10. REVISTA DE BIOLOGÍA TROPICAL. Spongberg, A.L. & P. Davis. 1999. Preliminary investigation of pesticide contamination in Golfo Dulce, Costa Rica. Rev. Biol. Trop. 46 (Suppl.5): 111-124.. Vargas, J.A. 1995: The Gulf of Nicoya estuary, Costa Rica: past, present, and future cooperative research. Helgoländer Meeresunters 49: 821-828.. Vanier, C., M. Sylvestre & D. Planas. 1996. Persistence and fate of PCBs in sediments of the Saint Lawrence River. The Science of the Total Environment 192: 229-244.. Wang, H., J.A. Kostel, A.L. St. Amand & K.A. Gray. 1999. 2: The response of a laboratory stream system to PCB exposure: study of periphytic and sediment accumulation patterns. Water Res. 33: 3749-3761..
(11)
Figure

Documento similar
La Información presentada es de carácter informativo para los asesores comerciales independientes de On Vacation y no constituye una oferta mercantil.. El País Une los
Cuando el músculo depresor de la punta nasal es hi- pertrófico y tiene una inserción larga actúa como la cuerda de un arco, movilizando hacia abajo y hacia atrás la
Hay que tomar en cuenta de que una de las características para el ahorro de energía y por ende dinero en este sistema, consiste en ajustar tanto la temperatura de salida
A., “La ciudad romanorrepublicana de La Cabañeta (El Burgo de Ebro, Zaragoza) y la implantación de los modelos arquitectónicos itálicos en el valle medio del Ebro”, en: J..
El Dorado Royale es un hotel todo incluido solo para adultos frente a la playa en Punta Brava, que goza del arrecife artificial más grande de toda Latinoamérica.. Es ideal para
MDSJL del 08 de setiembre del 2017, de la Sub Gerencia de Tránsito, Transporte y Vialidad, el Memorándum Nº 1247-2017-SGFyPE-GDE-MDSJL del 08 de setiembre del 2017, de la
Estados Unidos se compromete para llevar a cabo este plan a prestar una ayuda de 20.000 millones de dólares; pero exige que cada nación rea- lice programas de esfuerzo propio
ANALISIS DE SITUACION DE SALUD DE
