Visualizing Procesos y Diseños Energeticos S A as a 4PL service provider in Colombia using scenario plannig
57
0
0
Texto completo
(2) DOCUMENTO DIGITAL PARA REPOSITORIO El presente formulario debe ser diligenciado en su totalidad como constancia de entrega del documento para ingreso al Respositorio Digital (Dspace).. TITULO. VISUALIZING PROCESOS Y DISEÑOS ENERGETICOS S.A. AS A 4PL SERVICE PROVIDER IN COLOMBIA USING SCENARIO PLANNING. SUBTITULO Iguaran Peña, Diana Catalina AUTOR(ES) Apellidos, Nombres (Completos) del autor(es) del trabajo Scenario Planning PALABRAS CLAVE (Mínimo 3 y máximo 6). 4PL Strategy. RESUMEN DEL CONTENIDO (Mínimo 80 máximo 120 palabras). The objective of this project is to use scenario planning in order to visualize and identify strategies for Energeticos to become a 4PL provider in a horizon plan of 10 years. The methodology includes scenario creation and strategies identification, allowing the firm to acknowledged its relationship with the environment throughout its local factors and driving forces that have an impact of future performance. Scenario planning has therefore provided to the company a methodology to capture a range of possibilities and uncertainties. The process has involved participants from diverse areas, enriching the work through the inclusion of different points of view. In fact, the organization has been able to envision the factors that may possibly affect long-term decisions and therefore has initiated a strategic response process to support the firm’s actions by determining the magnitude and timing of control levers.. Autorizo (amos) a la Biblioteca Octavio Arizmendi Posada de la Universidad de La Sabana, para que con fines académicos, los usuarios puedan consultar el contenido de este documento en las plataformas virtuales de la Biblioteca, así como en las redes de información del país y del exterior, con las cuales tenga convenio la Universidad. De conformidad con lo establecido en el artículo 30 de la Ley 23 de 1982 y el artículo 11 de la Decisión Andina 351 de 1993, “Los derechos morales sobre el trabajo son propiedad de los autores”, los cuales son irrenunciables, imprescriptibles, inembargables e inalienables..
(3) VISUALIZING PROCESOS Y DISEÑOS ENERGETICOS S.A. AS A 4PL SERVICE PROVIDER IN COLOMBIA USING SCENARIO PLANNING by Diana Catalina Iguaran Industrial Engineering, Universidad de Los Andes, 2009. Submitted to the CLI/ CTL-MIT in Fulfillment of the Requirements for the Graduate Certification in Global Logistics & Supply Chain at the MIT Class SCALE Network February, 2013. 1.
(4) ABSTRACT. Procesos y Diseños Energeticos is experiencing growth and sees there is a need to provide more integrated services to its clients. Therefore, the Company wants to explore the possibility of becoming a 4PL 1 service provider in Colombia. The objective of this project is to use scenario planning in order to visualize and identify strategies for Energeticos to become a 4PL provider in a horizon plan of 10 years. The methodology includes scenario creation and strategies identification, allowing the firm to acknowledged its relationship with the environment throughout its local factors and driving forces that have an impact of future performance. Scenario planning has therefore provided to Energeticos an organized methodology to capture a whole range of possibilities and uncertainties. The process has involved participants from diverse areas, enriching the work through the inclusion of different points of view. In fact, the organization has been able to envision the factors that may possibly affect long-term decisions and therefore has initiated a strategic response process to support the firm’s actions by determining the magnitude and timing of control levers. Finally, it is recommended to further develop plans to approach each of the scenarios created and establish metrics to constantly follow up the strategies identified because conditions may change within the planning horizon.. 1. 4PL: Four Party Logistics. Logistics Service Provider that offers all logistics services, directly or indirectly.. 2.
(5) 1 Introduction 1.1 RELEVANCE AND CONTEXT Corporate strategic decisions such as the diversification of the services provided by a Company have an important impact on the organization. Not only because there is uncertainty associated with it, but also because of the different interactions between stakeholders involved. In fact, the decision process is affected by diverse internal and external factors that the Company may or not control The Capstone Project has the purpose of helping Procesos y Diseños Energeticos S.A. to understand different ways to manage the strategic decision of becoming a 4PL service provider in Colombia, through the application of the scenario planning methodology proposed by Professor Dr. Shardul S. Phadnis. Procesos y Diseños Energeticos S.A. is a Colombian Company that belongs to Mustang Engineering (USA) and Wood Group (UK), with over 35 years of experience as a service provider for the Oil and Gas industry. Energeticos offers value to its clients through four different business units: Engineering Services, Supply Chain Management, Project Management, and Construction Management. The scope of a 4PL entails the administration, planning and coordination of all information flows. It also includes the design of the supply chain strategy and the related applied integrated processes though the execution and operational flows are left to specialized operators. Taking this into account, scenario planning as a strategic methodology is a suitable tool that provides different perspectives in order to visualize and prepare the organization to manage long-term. 3.
(6) decisions. Furthermore, this project attempts to answer the following questions: •. What are the local factors and driving forces affecting the Energeticos’ focal decision to become a 4PL in Colombia?. •. What is the importance of and the level of uncertainty attained by the influencing factors?. •. What are the plausible future scenarios in which Energeticos’ long-term decision will be tested?. •. What kinds of strategies and innovative ideas arise from the strategic thinking process for each of the scenarios proposed?. In summary, scenario planning is used to identify the internal and external factors affecting the focal decision, integrate different stakeholders’ opinions, identify the variety of plausible future conditions and measure the impact of the decision in each of these scenarios within the Energeticos’ decision making process.. 2 Literature Review This chapter presents the framework in which this project will be based. In section 2.1 it will be shown how and why environmental uncertainty must be a conscious part of the strategic decision making process. Long-range decisions imply the recognition of the Organization as part of a system. Therefore any change in environment may affect Organizational expectations. Instead of forecasting specific events and shaping the past, long term planning, requires the Organization to prepare for the specific effects of these events. In section 2.2, the relationship between scenario and strategic planning is described. 4.
(7) as well as the evolution of this concept. Section 2.3 refers to the benefits of using scenario planning. Specific advantages have been documented in case studies such as Royal Dutch / Shell Group. However, there are other advantages that are not commonly recognized by scenario planners, and these will be covered in this project. Section 2.4 summarizes different theories and methods used regarding scenario planning. Because this project will be applied to a real decision making process in an Organization related to the strategic goal of becoming a 4PL service provider, section 2.5 explains the concept and gives information about the current situation in Colombia and Latin America.. 2.1 STRATEGIC DECISIONS AND ENVIRONMENTAL UNCERTAINTY Long-range decisions always involve uncertainty. In fact, the longer the period of time, the more environmental turbulence and uncertainty there is. Because of this the effects of a specific decision may not be as clear as if the decision was made in the present. Therefore, the first prudent act is to recognize the firm’s dependency on its environment. In fact, Organizations are part of a system, depending on the environment as much as the environment needs them. As Georgantzas states, “a business firm depends on its environment for resources and support. In turn, the environment depends on business firms for output and jobs” (Georgantzas and Acar, 1995). Decisions must be taken in a more holistic way, understanding their potential effects on the system and vice versa. The role of the environment is crucial in strategy making. Georgantzas and Acar (1995) state that even though there is a perception of uncertainty when managers are formulating. 5.
(8) strategic decisions, some still may be unsure of: •. Variables or states of the environment. •. The effect of environmental states or variables on organizational performance. •. The organization`s capability to take appropriate action. Changes in the environment could be generated either in the outbound or inbound of the organization depending on the level of influence it has over certain factors. Some authors call it the Macro Environment and Task Environment (Georgantzas and Acar, 1995), while others call it the Driving Forces and Local Factors (Schwartz, 1991). A Macro Environment or Driving Force address to a factor outside the range of control and influence of the organization. While the concept of task environment or Local Factor refers to a factor the Organization cannot control, the Organization may be able to influence it. In addition, this factor has a direct and obvious effect; it is often related to clients and customers, suppliers, regulatory agencies, competitors, labor markets, the scientific community, and other relevant stakeholders groups. What is important to understand is that regardless of the change or signals coming from the driving forces or from the local factors, their propagation proceed through the network of cause- effect relationships in which every Organization is embedded (Georgantzas and Acar, 1995). Therefore, envisioning the factors that may possibly affect the Organization will initiate a process of strategic responses, which determines the magnitude and timing of control levers with which a firm might attempt to react. Georgantzas and Acar (1995) distinguish among four major sources of uncertainty. These sources are as follows:. 6.
(9) •. U1: Uncertainty about environmental events and trends. •. U2: Uncertainty regarding competitors moves and signaling tactics. •. U3: Uncertainty about a firm’s decision and action capabilities. •. U4: Uncertainty regarding the co-alignment of implementation tactics. Thus, rather than ignore or overestimate uncertainty and turbulence, it should be managed. Decision makers will have to devise ways to keep track of and to model environmental changes through triggering events and trends. The following sections will explain how this uncertainty could be effectively handled through scenario planning.. 2.2 LINKING SCENARIOS TO STRATEGIC PLANNING Answering the question of whether uncertainty can be captured adequately for effective strategy design is the purpose of this section. Literature will be reviewed in order to understand why scenario planning offers a reasonable answer to the question mentioned above. 2.2.1. Scenario Planning. Scenario planning as a tool for strategic thinking and decision-making is not recent. The concept has evolved since 1960 when it was first used by the United States government to decide what projects should be funded for the development of new weapons systems (Bradfield, et al.2005). Then, the Royal Dutch/ Shell Group started to apply scenario planning techniques in order to coordinate the scheduling of new facilities and the overall feasibility of growing in the industry. Learning from this experience, “when the world changes, managers need to share some common view of the new world (…). Scenarios. 7.
(10) express and communicate this common view, a shared understanding of the new realities to all parts of the organization” (Wack, 1985) Scenario Planning offers a structured methodology in which vision is shared, examined and validated for compatibility between organization’s expectations and environmental changes. Managers may have their own perspective of the future but they might be biased because of their own area of expertise. A single methodology such as scenario planning can combine different perspectives, validate them and build possible projections of the future. “Among the many tools a manager can use for strategic planning, scenario planning stands out for its ability to capture a whole range of possibilities in rich detail. By identifying basic trends and uncertainties, a manager can construct a series of scenarios that will help to compensate for the usual errors in decision making- overconfidence and tunnel vision.” (Schoemaker, 1995) As different authors and practitioners have discussed scenario planning, the methodologies used are diverse. What is important is to validate that the scenario components and assumptions are compatible. Because scenario planning goes beyond objective analysis and includes subjective interpretations, there is no guarantee that scenario components are compatible. Managers and planners must screen both their basic assumptions and the compatibility of their scenarios. Another alternative to validate the coherence of the scenarios that are being recreated is to involve outsiders in the process, such as major customers, key suppliers, regulators, consultants, and academia. Thus, as Harries (2003) states, in scenario-based decision making, strategic decisions are tested for robustness against a series of scenarios describing plausible future worlds. Not. 8.
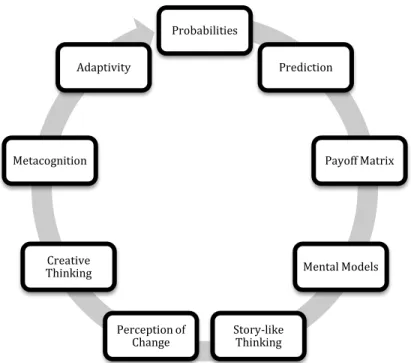
(11) only is the validation and the team involved in the process important, the decision and the reactions derived from the exercise must also be well documented and exposed One of the main purposes of using scenario planning is to encourage decision-makers to generate innovative ideas and chronologically place specific actions over the possible futures imagined. The next subsection describes the benefits of scenario planning not often perceived by planners.. 2.3 BENEFITS OF USING SCENARIO PLANNING As mentioned before, scenario planning has been used as a tool for strategic thinking in several organizations. Many reasons could be attributed to this. As a formal process it has the advantage of encouraging managers to be engaged and attentive. Furthermore, because scenario-based decision-making can be monitored and evaluated, a learning process occurs which provides great benefits to the Organization. Also, scenario planning includes information processing. Humans, who have limited information processing capacity, can with this tool process more information about a complex world. The following figure summarizes the theoretical arguments for scenario-based decision making proposed by Harries (2003).. 9.
(12) Probabilities Adaptivity. Prediction. Metacognition. Payoff Matrix. Creative Thinking. Mental Models. Perception of Change. Story-like Thinking. Figure 1.Theoretical arguments for scenario-based decision making. Decision makers should be fully aware of these components as advantages in order to include them into the scenario-based decision making process. Because of the subjectivity involved in the process and complexity of the environment, planners and managers must constantly assess the coherence of scenario-based decision-making in terms of what is being envisioned today and what can really happen in the future.. 2.4 SCENARIO PLANNING THEORY AND METHODS In order to understand the importance and evolution of scenario planning through different methodologies and examples, the following summary table describes relationships and differences between them.. 10.
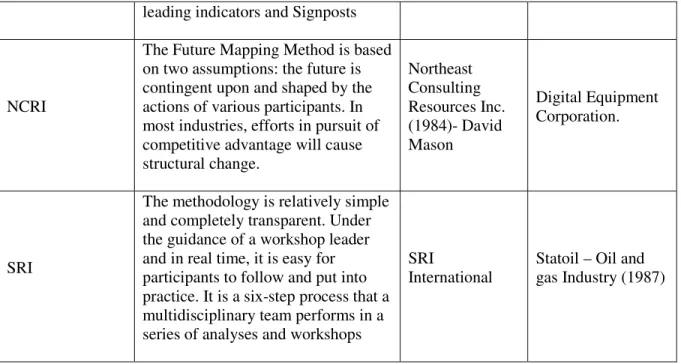
(13) Methodology. Description. Authors. Tool that can help in strategy design from the initial phase of building a model of the situation, to strategic analysis, to fully-fledged system dynamics simulation modeling. Georgantzas and Acar (1995). COMBANK – Financial Industry. Computer-Driven Uses simulation models involving Simulations – e.g. several different types of analysis in STRAT*X the process of making decisions. Jean-Claude Larreche (1984). MARKSTRAT – Cable & Wireless Telecom Industry. The Copenhagen Institute for Future Studies. Exercise that involves creativity training with the participants encouraged to think of the future and compare tendencies in society with the development of the business by looking at new tendencies and trends. Copenhagen Institute for Future Studies (1970). 3M Denmark. The European Commission. Known as Shaping Factors – Shaping Actors. Divided into two stages: define the long run structural factors (socio economical, socio political or cultural), influencing the organization. Second stage: “Shaping Actors”, are those players which are able to influence the Shaping Factors in an interactive fashion. European Commission. EAST ASIA – Regional context. The French School. The Godet approach has evolved over the years and now consists of a number of computer-based tools.. Michel Godet (1970). Iron and Steel Industry in France. Methodology based on trend-impact analysis. The Futures Group, a Glastonbury, Connecticutbased international strategy and policy research firm. US defense companies (1990) – Defense Industry. Peter Schwartz (1987). Pacific Gas and Electric (PG&E) – Electric industry. Comprehensive Situation Mapping (CSM). The Futures Group. Global Business Network. Development of scenarios through the following steps: 1. Identify Focal issue or Decision. 2. Key Forces in the Local Environment. 3. Driving Forces. 4. Rank by importance and uncertainty. 5. Selecting the Scenario logics. 6. Fleshing out the scenarios. 7. Implications. 8. Selection of. Example. 11.
(14) leading indicators and Signposts. NCRI. The Future Mapping Method is based on two assumptions: the future is contingent upon and shaped by the actions of various participants. In most industries, efforts in pursuit of competitive advantage will cause structural change.. Northeast Consulting Resources Inc. (1984)- David Mason. Digital Equipment Corporation.. SRI. The methodology is relatively simple and completely transparent. Under the guidance of a workshop leader and in real time, it is easy for participants to follow and put into practice. It is a six-step process that a multidisciplinary team performs in a series of analyses and workshops. SRI International. Statoil – Oil and gas Industry (1987). Table 1: Scenario planning theory From the table, it can be seen that the concept and methodologies have evolved from many years ago. This suggests the importance the method has for any decision-making process. Furthermore, as we deduct from the table, scenario planning has been applied to diverse industries, regions, and even historical events. 2.5 4PL THEORY Logistics providers are often categorized as 1PL, 2PL, 3PL, or 4PL, depending on the level of the services outsourced or subcontracted between them and the level of integration of the supply chain services offered. 1PL refers to a firm that offers only one service, normally associated with material handling and transporting. 2PL are providers that offer logistic services with some integration and synergy between them. For example, in Colombia these providers are related with warehousing and transportation services. The integration of a services portfolio based on assets, knowledge and technology is known as a 3PL. Finally, 4PL manage the supply chain and are in charge of coordinating the network but subcontract 12.
(15) most of the services offered to their clients. 2.5.1. 4PL Context: Colombia. According to the National Survey for Logistics (Rey, 2008), out of 95 firms, 32.63% considered themselves as 3PL. 29.47% correspond to 1PL firms. And 17.89% considered themselves as 4PL, which means they offer the complete portfolio of logistics services, directly or indirectly. However, the same research shows that although 50.52% of the sample states to be 3PL or 4PL, there are logistics services that are NOT offered in Colombia. Due to the fact Colombia lacks certain logistics services, a natural question arising would be whether or not there is a reason to implement a 4PL solution in Colombia considering the growth experienced by the country in the last 7 years, the demand for logistics services has also grown. There is a huge opportunity for the outsourcing of most common services such as warehousing and transportation, but also opportunity for other services such as supply chain services and financial logistics services. (Rey, 2008) outsourcing in Colombia is still incipient and it’s highly concentrated in physical logistics services such as warehousing, transportation and reverse logistics. Around the world 85% of total transportation is subcontracted; in Latin America this percentage is only 70%, while in Europe the percentage comes to 92%. With globalization and more complex supply chains, the opportunities for a 4PL become relevant. Organizations that want to focus on their core business are searching for efficiencies in their supply chain operations. An expert capable of managing the complexity of the network might be an excellent option.. 13.
(16) 2.6 LITERATURE REVIEW CONCLUSIONS The literature described above highlights the importance of having a structured methodology such as scenario planning for strategic thinking. (Wack, 1985) The future is no longer stable; it has become a moving target. No single "right" projection can be deduced from past behavior. The better approach is to accept uncertainty by trying to understand it, and making it part of our reasoning. As scenario planning has evolved through history, this methodology has demonstrated to have multiple benefits that will be considered in order to achieve the objectives of this project.. 3 Research Approach This chapter presents the methodology that will be used to develop the established research question for this project. As mentioned in chapter 1, the objective of this project is to use scenario planning in order to visualize and evaluate the feasibility of Energeticos becoming a 4PL service provider in Colombia by capturing a whole range of possibilities in detail and managing uncertainties derived from the long-term strategic decision process. Although scenario planning does not have a single philosophy, and in many cases literature does not provide a well-defined scenario creation process with specific instructions for performing different steps, the scenario creation process that will be applied to the research question is the one proposed in Phadnis (2012). This methodology applied to the project´s research question provides a suitable framework according to expected results. This chapter will explain the framework, process and steps involved in the scenario creation plan.. 14.
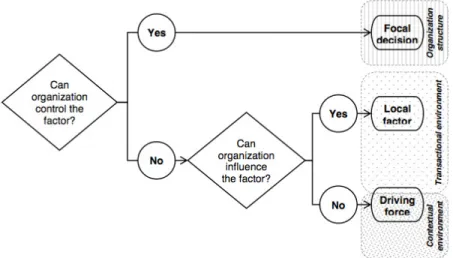
(17) 3.1 SCENARIO CREATION FRAMEWORK According to Phadnis (2012), the methodology considers the following framework, terms and definitions: In order to measure the impact of the scenario creation process over the Organization, it is necessary to understand the Organization’s relation to its environment. Therefore, Phadnis (2012) distinguishes between transactional environment and contextual environment as follows: •. Transactional environment: “The part of the environment in which the organization is a significant player, influencing outcomes as much as being influenced by them. This is the playing field for which the organization develops its strategy in order to turn the game to its advantage.”. •. Contextual environment: “The part of the environment which has important repercussions for the organization but in which it has little or no influence.”. Based on other literature and using the ability of an Organization to control and influence the business environment, Phadnis (2012) defines three terms used in the scenario creation process: •. Focal decision: “A decision, which involves specifying the value(s) of a set of internal factors that the organization can control, and which is to be made using the scenarios.”. •. Local factor: “A factor of the organization’s external environment (thus, not amenable to the organization’s control), which the organization can influence.”. 15.
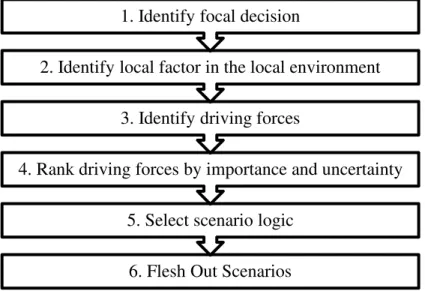
(18) •. Driving force: “A factor of the organization’s external environment (thus, not amenable to the organization’s control), which the organization cannot influence.”. Phadnis (2012) shows the relation between these definitions in the following flowchart. Figure 2. Terms used in scenario creation method. (Phadnis, 2012) 2.1 SCENARIO CREATION PROCESS The scenario creation process presented by Phadnis (2012) parallels the first six steps developed by Schwartz (1991), but it adds value to the scenario-planning framework because: •. It provides a detailed and transparent process for creating scenarios. •. It defines terms and grounds them in organizational literature. •. The process forces participants to think about the relationships between driving forces and local factors. •. The process leverages internal and external expertise. •. It provides a “recipe” for creating customized scenarios. 16.
(19) Thus, the scenario creation process that will be used for this project is represented in the following figure:. 1. Identify focal decision 2. Identify local factor in the local environment 3. Identify driving forces 4. Rank driving forces by importance and uncertainty 5. Select scenario logic 6. Flesh Out Scenarios. Figure 3. Scenario Creation Process (Phadnis, 2012) 3.3 SCENARIO CREATION PROCESS FOR ENERGETICOS S.A. The following steps will be followed in order to address the research problem: 3.3.1. Introductory Meeting: This meeting is held with the project sponsor, in this case with the Supply Chain Management Director of Energeticos. The purpose of this meeting is to present scenario planning as an alternative to deal with Energeticos’ long-term decision of becoming a 4PL Service provider in Colombia. As a result of this meeting the following definitions will be declared:. a. Project Scope: Since the goal of the scenario project is to understand the strategies that Energeticos may incorporate to expand its services to become a 4PL service provider in Colombia, the project scope must define the business unit, market and geographic region impacted by this long-term decision.. 17.
(20) b. Planning Horizon: This is defined as the length of time that the Organization is looking into the future to develop the strategic plan of becoming a 4PL service provider in Colombia. c. Project Sponsor: Owner of the project. Person in the organization that leads the project and provides the tools to develop the project successfully. d. Team selection: Key participants and their roles. Team members could participate in all project stages or some of them. e. Focal Question: The main issue regarding the long term expansion strategies of the Organization is established here. Other main questions may be addressed and explained in this stage. f. Project Timeline: The timeline is established, with realistic and attainable deadlines, in order to make sure the appropriate amounts of time are spent on each step of the process. g. Sessions and Interviews: Number of sessions, interviews, methodology and participants involved.. 3.3.2. Kick-Off Meeting: This consists of the presentation of the methodology to all participants in order to achieve commitment with all of them and the understanding of the project development. This session is estimated to last 2 hours.. 3.3.3. Local Factors Identification: A brainstorming session is established to identify the Local Factors. Since participants come from different areas and disciplines it is important to have them all involved in this stage. All of them have a better understanding of the situation from their own area of expertise. Every participant 18.
(21) writes individually the local factors they have identified. Afterwards one hour is established to discuss the ideas, consolidate them and validate them as real local factors. 3.3.4. Data Consolidation: The factors are consolidated and filtered in case of repetitions. One session to present the results is scheduled with project sponsor to perform a final review of the factors and select the most relevant ones.. 3.3.5. Driving Forces Identification: Prior to this session, the project sponsor and two other experts establish the main driving forces. Afterwards, the results are discussed with all participants in order to obtain feedback and consensus. The presentation includes elaborate descriptions of each driving force, as well as their impact on the focal question, and whether the driving force is considered to be a trend (predictable) or an uncertainty over the planning horizon.. 3.3.6. Rank driving forces by impact and uncertainty: Evaluating Impact of Local Factors: The first step is to identify key local factors by measuring their impact on the focal decision. During the session, participants evaluate impact of local factors by individually completing questionnaires. The questionnaire asks the participant to rank the impact of each factor using the 5-point Likert scale, ranging from 0 (denoted as “No effect”) to 4 (denoted as “Very strong effect”). Calculation of Impact of Local Factors: The average impact of local factors will be presented as the result of multiplying each of the survey values by the number of. 19.
(22) responses divided by the total number of responses. Selecting Key Local Factors: After the results consolidation, the most impactful local factors will be chosen according to their average impact. The researcher will conduct this analysis and then the results will be discussed with all participants. Key L ocal Factor – Driving Force Matching: This step will be conducted throughout a two hours session were the instructions for the matching exercise will be given to the participants. The matching exercise consists of identifying the strength of the relationship between each of the driving forces and the key local factors. To specify the relationship, the participants will be asked to answer the question: Does driving force X affect key local factor Y? X and Y are the variable representing the driving force and key local factor to be matched. The answers will be qualified on a 3-point scale: Has a strong effect (2), Has a weak effect (1), or Has no effect (0). The recommendation is to work by subgroups so each. subgroup answers the. question mentioned above for a certain number of relationships. Then each subgroup will present the driving force-key factor strength they had identified and a brief rationale for it to the entire group in order to reach a consensus. As Phadnis (2012) states, the advantage of this mapping approach is that it forces the group members to explicitly state their assumptions about how a driving force may affect a local factor, and the mutually inconsistent assumptions compete so that the most robust assumption is used in defining the relationship.. 20.
(23) Calculate Impact and Uncertainty of Driving Forces: The impact of each driving force is calculated using the average strength of relationship between it and each of the key local factors, multiplied by the impact of the corresponding key local factors, as described in the following equation. Let, {1, …, l}. : Set of local factors (indexed by l). {1, …, d}. : Set of driving forces (indexed by d). [0,1,2] : Strength of association between driving force d and local factor l =0. : No relationship, i.e. driving force d has no influence on local factor l. =2. : Strongest possible relationship; d has a very strong influence on l : Impact of local factor l : Impact on driving force d is calculated as follows. =. (1) 3.3.7. Select Scenario Logic: After the driving forces impact estimation results are presented to participants, the session initiates with the analysis of the most significant driving forces to be chosen as scenario axes. The consensus must be reached through debating the uncertainty of each driving force. Since this is an important decision for the scenario creation process, all participants must be involved. The length of this exercise is estimated to be 2 hours.. 3.3.8. Flesh Out Scenarios: Fleshing out scenarios involves specifying high and low values of driving forces and defining scenario structure. The steps in detail are presented below:. 21.
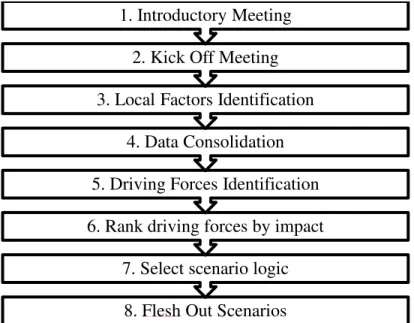
(24) Define high and low values of driving forces: After defining the scenario logic and before creating scenario structure, the high and low values of each driving force need to be defined. These values need to be based on the input of both, the external researchers and the project team members. This step will be developed during the same session which defines the scenario logic.. Define scenario structure, name the scenarios: The objective of this last part of the session is to establish the structure of each selected scenario according to the remaining driving forces. Then, through a brainstorming exercise the participants will reach a consensus on the name for each one of the scenarios.. Write Scenario Story: In order to document the scenarios it is recommended to write them as a story, addressing the context, the driving forces and local factors identified during the process as well as their impact and possible values in each scenario.. According to the methodology and steps described above, the following scheme summarizes the process flow that will be applied to the Energeticos scenario creation project:. 22.
(25) 1. Introductory Meeting 2. Kick Off Meeting 3. Local Factors Identification 4. Data Consolidation 5. Driving Forces Identification 6. Rank driving forces by impact 7. Select scenario logic 8. Flesh Out Scenarios Figure 4. Energeticos Scenario Creation Process. 4. Results. Based upon the methodology described in the previous chapter, the results and conclusions will be shown below. The activities and steps were conducted in a real organizational environment and for this reason some information details will not be presented in order to maintain the organization’s confidentiality. The first section will explain the activities developed and the results obtained in every stage. This section includes the data collection as well as the data analysis and results. The second section of this chapter connects the research question with the conclusions and recommendations for the project. 4.1 RESEARCH DATA COLLECTION AND RESULTS 4.1.1. Introductory Meeting: This meeting was held with Energeticos` Supply Chain Management Director. During this meeting a presentation about scenario planning methodology was made which presented an alternative to analyze and evaluate. 23.
(26) Energeticos’ long-term decision to become a 4PL service provider in Colombia. As a result of this meeting the following definitions were declared: Meeting Results and Project Definitions a) Project Scope: Since the goal of this project is to understand the strategies that Energeticos may select to expand its services and become 4PL service provider in Colombia, the following questions were chosen as the focal issues for Energeticos: •. What type of clients and industries should Energeticos approach to offer 4PL services ?. •. What kind of alliances or partnerships should Energeticos establish in order to become a 4PL?. •. What kind of strategies should Energeticos adopt in order to support the growth of offered services?. b) Planning Horizon: Because the project has a high complexity and a large impact on the organization, the project planning horizon defined was 10 years (2022) c) Project Sponsor: The person who will lead the project and be responsible to keep the project aligned with organization`s strategy and portfolio direction was defined to be the Supply Chain Management Director. d) Team selection: Besides the project sponsor, 10 participants were defined. •. SCM Project Coordinator. •. Expediting Leader. •. Purchasing Leader. •. Contracting Leader. 24.
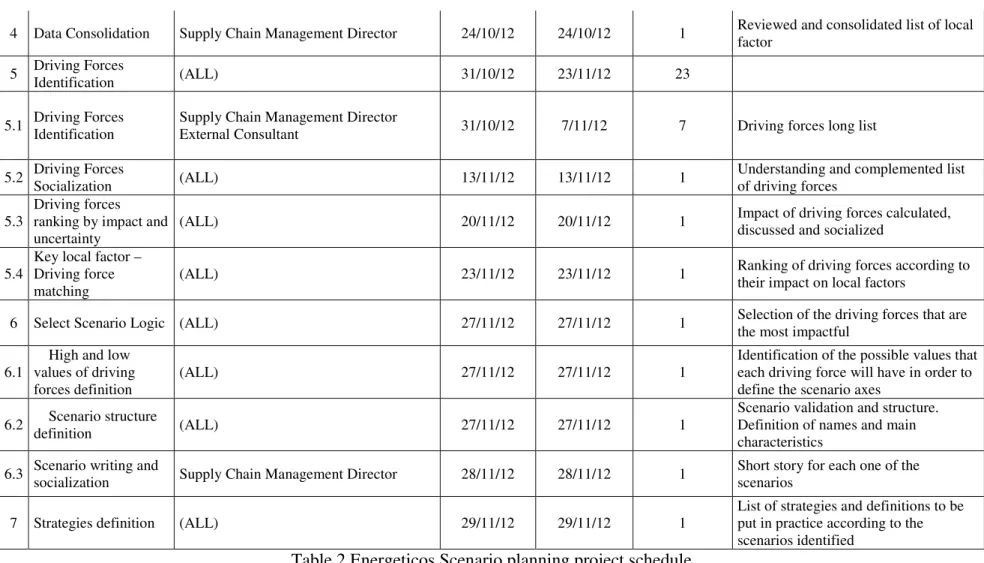
(27) •. Planning Leader. •. Planning Professional. •. Operations Manager. •. Commercial Manager. •. Financial Manager. •. Talent Manager. Operations, Commercial, Financial and Talent Managers will participate in highlevel workshops and through personal interviews. The rest of the team will participate in all project stages. e) Project Timeline: The timeline was established by taking into account realistic and attainable deadlines. Assuring the appropriate amounts of time spent on each step of the process as well as the resources availability. The project timeline was defined to be 2 months. f) Sessions and Interviews: A schedule was established for the project. This is shown in the following table.. 25.
(28) No. Activity. Participants. Initial Date. Final Date. Length (days). Expected Results. Introductory Meeting. Supply Chain Management Director. 2/10/12. 2/10/12. 1. Main definitions: Project Scope Planning Horizon Project Sponsor Team Selection Project Timeline Sessions and Interviews. 2. Kick off Meeting. • Supply Chain Management Director • SCM Project Coordinator • Expediting Leader • Purchasing Leader • Contracting Leader • Planning Leader • Planning Professional • Operations Manager • Commercial Manager • Financial Manager • Talent Manager (ALL). 16/10/12. 16/10/12. 1. Methodology presentation to all participants and commitment received from all of them. 3. Local Factor IdentificationBrainstorm session. (ALL). 19/10/12. 19/10/12. 1. Local Factors Identification. Data Collection: Workshop. (ALL). 19/10/12. 19/10/12. 1. Long list of local factors identified by all participants. 1. 3.1. 26.
(29) Reviewed and consolidated list of local factor. 4. Data Consolidation. Supply Chain Management Director. 24/10/12. 24/10/12. 1. 5. Driving Forces Identification. (ALL). 31/10/12. 23/11/12. 23. 5.1. Driving Forces Identification. Supply Chain Management Director External Consultant. 31/10/12. 7/11/12. 7. Driving forces long list. 13/11/12. 13/11/12. 1. Understanding and complemented list of driving forces. 20/11/12. 20/11/12. 1. Impact of driving forces calculated, discussed and socialized. 23/11/12. 23/11/12. 1. Ranking of driving forces according to their impact on local factors. 27/11/12. 27/11/12. 1. Selection of the driving forces that are the most impactful. (ALL). 27/11/12. 27/11/12. 1. Driving Forces (ALL) Socialization Driving forces 5.3 ranking by impact and (ALL) uncertainty Key local factor – 5.4 Driving force (ALL) matching 5.2. 6. Select Scenario Logic (ALL). High and low 6.1 values of driving forces definition. Identification of the possible values that each driving force will have in order to define the scenario axes Scenario validation and structure. Definition of names and main characteristics. 6.2. Scenario structure definition. (ALL). 27/11/12. 27/11/12. 1. 6.3. Scenario writing and socialization. Supply Chain Management Director. 28/11/12. 28/11/12. 1. Short story for each one of the scenarios. 7. Strategies definition. (ALL). 29/11/12. 29/11/12. 1. List of strategies and definitions to be put in practice according to the scenarios identified. Table 2 Energeticos Scenario planning project schedule. 27.
(30) 4.1.2. Kick-Off Meeting: The meeting was held with all 11 participants with a time length of 2 hours. During the meeting the project scope and the methodology that will be used to execute the project was presented to all participants. The majority had prior information about the project but there were some that did not know about it. Therefore the meeting was very important and successful because it made sure all participants had the same information and were committed with the project. Then the methodology for scenario planning execution was explained as well as the project schedule.. 4.1.3. Local Factors Identification: Since participants belong to different areas and disciplines, it was important to have them all involved in this stage. All of them had unique understanding of the situation due to their distinct areas of expertise.. Data Collection: Workshop The workshop consisted in two parts: The first 15 minutes were used to explain and remind to all participants the meaning and importance of a Local Factor. The second part consisted in a brainstorming session were every participant wrote down individually the local factors each had identified. Afterwards, one hour was spent to socialize the ideas, consolidate and validate them as local factors.. Results: Local factors for Energeticos Although the session was planned to be individual focused where every participant would write down the local factors identified, some of them ended up working in groups, sharing their ideas, and also consolidating similar local factors in order to 28.
(31) avoid too many repetitions. Thus, by the end of the session the team had identified a list of 42 local factors.. 4.1.4. Data consolidation: After the local factors identification workshop, Energeticos Supply Chain Director reviewed the list of factors. There was some consolidation, organization and redefinitions of the local factors until a list of 37 local factors was finalized. It was then organized by categories that might help to understand the main concerns and uncertainties related to organizational environment. Local factors consolidated list:. 1. Technological solutions available to integrate operations along the supply chain (clients, partners, suppliers, etc.) 2. Customer willingness to outsource logistics services 3. Logistics services offered in Colombia 4. Customer preference for the services provided by Energeticos 5. Specialized talent available in industry 6. Partner adaptability to an integrated network of logistics service providers 7. Regulations for the services Energeticos will provide 8. Disposition and willingness of organizations to establish alliances and partnerships with Energeticos 9. Customer-specific requirements for services 10. Supplier network availability 11. Import and export regulations 12. Current and potential competitors 13. Logistics facilities availability such as warehousing, cross-docking platforms, etc. 14. Multimodal infrastructure availability 15. Practice standardization for a the 4PL Network 16. Availability of technology for communications and traceability. 29.
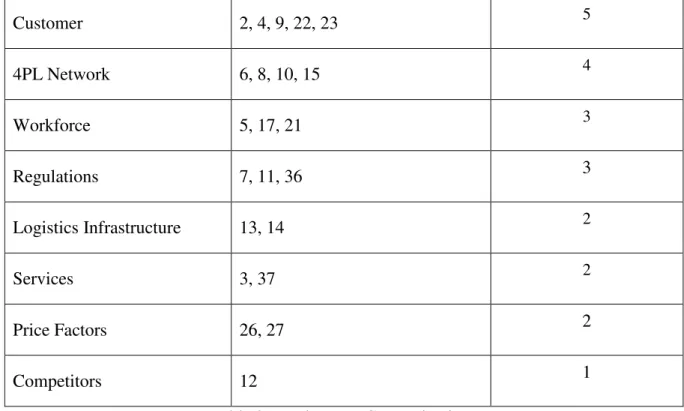
(32) 17. Level of people’s technological skills in industry 18. Transactional system availability in Colombia 19. Corporate systems and logistics systems integration 20. Decision support systems availability 21. Supply chain managerial talent availability in Colombia 22. Type of customer supply chains (complexity) 23. Type of customers 24. Technology available to integrate services with clients operations 25. Partner resource availability for collaborations (information sharing) 26. Service prices and variations 27. Price of fuel and variations 28. Partners and suppliers potential to grow technology and assets 29. Environmental policies implemented by partners and suppliers 30. Partners willingness to implement best practices and innovate 31. Partner sustainability in the long term 32. Partner capacity and willingness to translate benefits to clients, such as financial, operational and technological benefits 33. Ethics incorporated into partner culture, in terms of transparency and other values offered to clients. 34. Partner willingness to incorporate Energeticos’ policies and core values 35. HSE policies included through the whole supply chain 36. HSE and Quality regulations for logistics services. 37. Easy to develop new logistics services in the country Local factors categorization:. Category. Nbr of local factors. Partner Competences. 25, 28, 29, 30, 31, 32, 33, 34, 35. Technology. 1, 16, 18, 19, 20, 24. Total 9 6. 30.
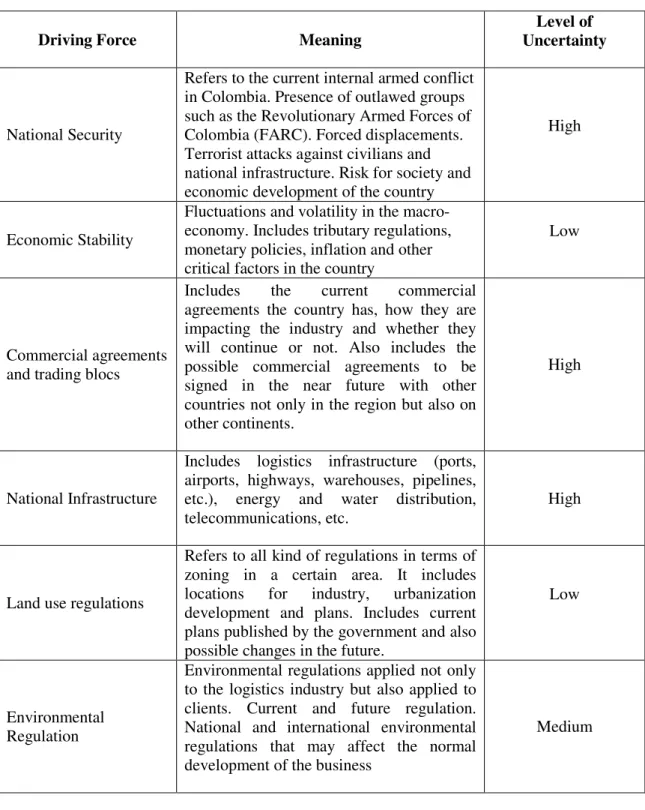
(33) 5. Customer. 2, 4, 9, 22, 23. 4PL Network. 6, 8, 10, 15. Workforce. 5, 17, 21. Regulations. 7, 11, 36. Logistics Infrastructure. 13, 14. Services. 3, 37. Price Factors. 26, 27. 2. Competitors. 12. 1. 4 3. 3 2 2. Table 3 Local Factor Categorizations From the list above, we can infer that the partner network and their competences is a major concern when becoming a 4PL. Success of a 4PL is having a supply chain that is willing and able to incorporate core competences in order to add value to its clients. When involving many actors in the network, the efficiencies that every actor achieves is certainly something the 4PL may not be able to control but it can influence by strongly pushing its partners to adopt core competencies and values as part of their corporate culture. Furthermore, the integration along the supply chain has to be related with technology availability and customer needs, which appears to be very important too. 4.1.5. Driving Forces Identification: After consolidating local factors, a Supply Chain Management senior consultant was approached in order to ask for his opinion on the identification of Driving Forces. He has over 15 years of experience in the logistics sector and has worked externally with the company before. After a consensus. 31.
(34) between the Supply Chain Director and the consultant, the following driving forces were agreed on: Driving Force. National Security. Economic Stability. Commercial agreements and trading blocs. National Infrastructure. Land use regulations. Environmental Regulation. Meaning Refers to the current internal armed conflict in Colombia. Presence of outlawed groups such as the Revolutionary Armed Forces of Colombia (FARC). Forced displacements. Terrorist attacks against civilians and national infrastructure. Risk for society and economic development of the country Fluctuations and volatility in the macroeconomy. Includes tributary regulations, monetary policies, inflation and other critical factors in the country Includes the current commercial agreements the country has, how they are impacting the industry and whether they will continue or not. Also includes the possible commercial agreements to be signed in the near future with other countries not only in the region but also on other continents. Includes logistics infrastructure (ports, airports, highways, warehouses, pipelines, etc.), energy and water distribution, telecommunications, etc. Refers to all kind of regulations in terms of zoning in a certain area. It includes locations for industry, urbanization development and plans. Includes current plans published by the government and also possible changes in the future. Environmental regulations applied not only to the logistics industry but also applied to clients. Current and future regulation. National and international environmental regulations that may affect the normal development of the business. Level of Uncertainty. High. Low. High. High. Low. Medium. Table 4 Energeticos Driving Forces 4.1.6. Rank driving forces by impact and uncertainty 32.
(35) Evaluating impact of local factors: 37 local factors and 5 driving forces were selected for evaluating their impact on the focal decision and uncertainty about the value over the 10 years planning horizon. A questionnaire was delivered to each of the Energeticos project team participants in order to evaluate the impact of local factors on the focal decision. Team members completed the questionnaire individually. Team members were asked to assume that the environmental factor had taken the value as described in the questionnaire, and then rate the impact of it on the focal decision, using a 5-point Likert scale, from 0: No effect to 4: Very strong effect.. Calculation of impact of local factors: All 11 participants completed the questionnaires. The complete results are presented in the following table. The average impact varies from a low of 1,09 to a high of 3,91. 33.
(36) Number of votes by value of. Votes by individual participants Local Factors. Avg. Imp.. P01. P02. P03. P04. P05. P06. P07. P08. P09. P10. Technological solutions available to integrate operations in the supply chain (clients, partners, suppliers, etc.). 4. 3. 4. 3. 2. 3. 4. 4. 4. 3. 4. 0 0 1 4 6. 3,45. Customer willingness to outsource logistics services. 4. 4. 4. 4. 3. 4. 4. 4. 4. 4. 4. 0 0 0 1. 10. 3,91. Logistics services offered in Colombia. 3. 2. 3. 2. 3. 4. 3. 4. 4. 3. 3. 0 0 2 6 3. 3,09. Customer preference for the services provided by Energeticos. 4. 4. 3. 4. 3. 4. 4. 3. 4. 4. 4. 0 0 0 3 8. 3,73. Specialized talent available in industry Partner adaptability to an integrated network of logistics service providers Regulations of the services Energeticos will provide. 2. 1. 3. 2. 3. 2. 1. 3. 2. 3. 2. 0 2 5 4 0. 2,18. 4. 4. 3. 4. 3. 4. 4. 4. 3. 4. 4. 0 0 0 3 8. 3,73. 3. 2. 3. 3. 3. 3. 3. 2. 1. 2. 3. 0 1 3 7 0. 2,55. Organization disposition and willingness to establish alliances and partnerships with Energeticos. 4. 3. 4. 4. 3. 3. 3. 2. 2. 3. 4. 0 0 2 5 4. 3,18. Customer specific requirements for services. 3. 3. 2. 3. 3. 3. 3. 3. 2. 3. 1. 0 1 2 8 0. 2,64. Supplier network availability. 0. 2. 3. 0. 0. 2. 3. 3. 2. 1. 1. 3 2 3 3 0. 1,55. Import and export regulations. 1. 1. 3. 2. 2. 1. 2. 1. 3. 1. 1. 0 6 3 2 0. 1,64. Current and potential competitors Logistics facility availability such as warehousing, crossdocking platforms, etc. Multimodal infrastructure availability. 1. 0. 1. 2. 1. 3. 2. 1. 0. 1. 1. 2 6 2 1 0. 1,18. 2. 3. 2. 2. 1. 2. 1. 1. 2. 1. 2. 0 4 6 1 0. 1,73. 4. 4. 4. 3. 3. 4. 3. 3. 2. 3. 3. 0 0 1 6 4. 3,27. Practices standardization in the 4PL Network Availability of technology for communications traceability Level of people’s technological skills in industry. 2. 1. 2. 2. 2. 3. 3. 2. 1. 2. 3. 0 2 6 3 0. 2,09. 2. 3. 3. 2. 3. 4. 3. 4. 3. 3. 2. 0 0 3 6 2. 2,91. 1. 2. 1. 1. 1. 2. 1. 1. 0. 1. 1. 1 8 2 0 0. 1,09. Transactional system availability in Colombia. 1. 2. 2. 2. 3. 1. 3. 1. 1. 0. 0. 2 4 3 2 0. 1,45. Corporate systems and logistics systems integration. 2. 2. 1. 2. 2. 2. 3. 2. 3. 3. 1. 0 2 6 3 0. 2,09. Decision support system availability. 3. 4. 4. 3. 2. 3. 4. 4. 4. 3. 4. 0 0 1 4 6. 3,45. Supply chain managerial talent availability in Colombia. 2. 3. 2. 1. 3. 3. 2. 2. 3. 3. 2. 0 1 5 5 0. 2,36. and. P11 0 1 2 3 4. 34.
(37) Type of customer supply chain (complexity). 3. 3. 4. 3. 2. 4. 4. 3. 4. 4. 4. 0 0 1 4 6. 3,45. Type of customers Technology available to integrate services with client operations Partner resource availability for collaboration (information sharing) Service prices and variations. 3. 2. 3. 3. 3. 2. 1. 3. 2. 1. 1. 0 3 3 5 0. 2,18. 3. 3. 2. 3. 2. 2. 3. 3. 2. 4. 4. 0 0 4 5 2. 2,82. 3. 4. 3. 3. 2. 3. 2. 3. 4. 3. 3. 0 0 2 7 2. 3,00. 3. 3. 2. 2. 2. 1. 4. 2. 3. 3. 2. 0 1 5 4 1. 2,45. Price of fuel and variations Partners and suppliers potential to grow in technology and assets Environmental policy implementation by partners and suppliers Partner willingness to implement best practices and innovate. 2. 2. 2. 1. 1. 3. 2. 2. 2. 2. 1. 0 3 7 1 0. 1,82. 3. 2. 2. 1. 2. 3. 4. 3. 3. 3. 3. 0 1 3 6 1. 2,64. 3. 3. 3. 2. 2. 3. 4. 3. 2. 2. 1. 0 1 4 5 1. 2,55. 3. 4. 3. 4. 4. 3. 3. 2. 3. 2. 2. 0 0 3 5 3. 3,00. 4. 3. 3. 3. 4. 4. 3. 4. 3. 3. 2. 0 0 1 6 4. 3,27. 2. 3. 2. 2. 1. 3. 2. 1. 3. 2. 1. 0 3 5 3 0. 2,00. 2. 3. 2. 1. 3. 4. 3. 3. 3. 4. 2. 0 1 3 5 2. 2,73. 3. 4. 4. 4. 3. 3. 4. 4. 3. 4. 4. 0 0 0 4 7. 3,64. 3. 2. 3. 3. 2. 2. 3. 2. 1. 1. 3. 0 2 4 5 0. 2,27. HSE and Quality regulations for logistics services.. 2. 2. 3. 2. 1. 2. 2. 2. 2. 3. 3. 0 1 7 3 0. 2,18. Easy to develop new logistics services in the country. 2. 3. 4. 3. 3. 3. 2. 3. 2. 3. 3. 0 0 3 7 1. 2,82. Partner sustainability in the long term Partner capacity and willingness to translate benefits to clients, such as financial, operational and technological benefits Ethics included in partner culture, in terms of transparency and other values offered to clients. Partner willingness to incorporate Energeticos’ policies and core values HSE policy implemented through the whole supply chain. Table 5 Energeticos Results of survey of impact of local factors. 35.
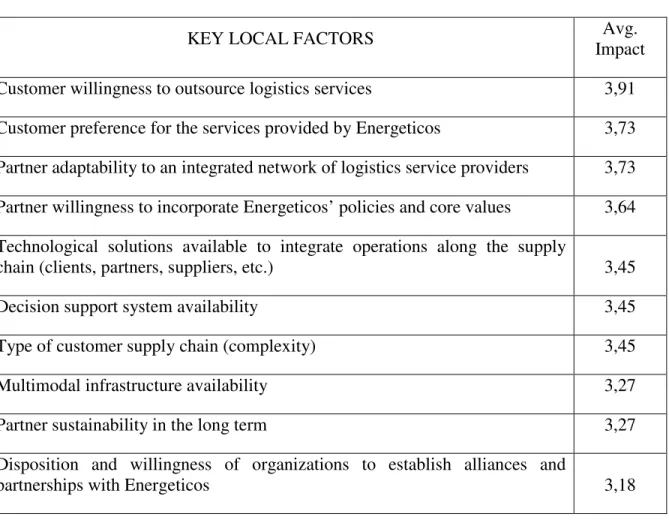
(38) Selecting key local factors: In order to calculate the impact of driving forces, the ten most impactful local factors were chosen to continue the exercise. The key local factors are highlighted in blue font in Table 5, and they have been organized from the highest to the lowest as shown below:. KEY LOCAL FACTORS. Avg. Impact. Customer willingness to outsource logistics services. 3,91. Customer preference for the services provided by Energeticos. 3,73. Partner adaptability to an integrated network of logistics service providers. 3,73. Partner willingness to incorporate Energeticos’ policies and core values. 3,64. Technological solutions available to integrate operations along the supply chain (clients, partners, suppliers, etc.). 3,45. Decision support system availability. 3,45. Type of customer supply chain (complexity). 3,45. Multimodal infrastructure availability. 3,27. Partner sustainability in the long term. 3,27. Disposition and willingness of organizations to establish alliances and partnerships with Energeticos. 3,18. Table 6 Energeticos Key Local Factors Key local factor – Driving force matching: For this activity, a two hour session was conducted. Before starting the exercise, the key local factors and their average impact were socialized with all participants.. 36.
(39) The matching exercise consisted of identifying the strength of relationship between each of the driving forces and the key local factors. To specify the relationship, the participants were asked to answer the question: Does driving force X affect key local factor Y? X and Y are the variable representing the driving force and key local factor to match. The answers will be collected on a 3-point scale: Has a strong effect (2), Has a weak effect (1), or has no effect (0). The recommendation is to work by subgroups so each of them answers the question mentioned above for all the relationships. Then each subgroup will present the driving force-key factor strength they had identified and a brief rationale for it to the entire group in order to reach a consensus. For this session two participants were not able to assist, so the group was divided in three subgroups of 3 participants each. During the exercise, the researcher gave support to all groups, helping them when team members could not agree. The following table summarizes the results. The key local factors are presented in the rows, and the impact of each factor is listed in the second column. The driving forces are listed in columns. Each driving force has two columns underneath it: the first column indicates the strength of relationship between the driving force and the key local factors indicated by each subgroup; the second column shows the average of the strength defined by the three subgroups.. 37.
(40) Customer willingness to outsource logistics services. Customer preference for the services provided by Energeticos. 3,73. Partner adaptability to an integrated network of logistics service providers. 3,73. Partner willingness to incorporate Energeticos’ policies and core values. 3,64. Technological solutions available to integrate operations in the supply chain (clients, partners, suppliers, etc.). 3,45. Decision support system availability. 3,45. Type of customer supply chain (complexity). 3,45. Multimodal infrastructure availability. 3,27. subG-2 subG-3. 2 2. subG-1. 1. subG-2 subG-3. 2 1. subG-1. 2. subG-2. 2. subG-3. 2. subG-1. 1. subG-2 subG-3. 1 1. subG-1. 2. subG-2 subG-3. 1 2. subG-1. 2. subG-2 subG-3. 1 2. subG-1. 2. subG-2 subG-3. 1 1. subG-1. 2. subG-2. 2. 1 1 1. 1,33. 0 1. 0 0,67. 2 2. 1. 1,33. 1 2 1 2. 2. 1 1 2 2. 1 2 1 2. 2. 2 1 2 2. 1 1 2. 1 1 2 1 2 1. 2. 2. 2 2 2 2. 1. 1. 0 1 1 1 1 1. 2. 2 1 2 2. 1,67. 1 0. 0,33. 0 1. 0,33. 0 1. 2 2. 2. 0 1. 1 1,67. 0,67. 0 0,33. 1 1,67. 0 1. 1. 0 1. 1,33. 2. 1. 2 1,67. 0 0. 2 1 1. 0,33. 1. 2 1,67. 1 1. 1,33. 1 1. 2 1,67. 2 1,33. 1 2. 1 0,33. 2 1,67. 2 1,33. 0 0. 1. 2. 2 1,67. 2 1,67. 1,67. 1 0,67. 2 1,67. 1. 2 1,67. 2. 2. 1 1 0. 1 1. 2. 1 0,67. 2. 1 1. 1 1. 1. Environmental Regulation. 1 1. Land use regulations. 1 2. Commercial agreement and trading blocs. Economic Stability. 2. National infrastructure. subG-1 3,91. National Security. Vote of subgroup. Impact of local factor. Key Local Factor. 0 1. 0,33. 2 1,67. 2. 2 2 2. 2. 2. 2. 38.
(41) Partner sustainability in the long term. 3,27. Organization disposition and willingness to establish alliances and partnerships with Energeticos. 2,18. subG-3. 2. subG-1. 2. subG-2 subG-3. 1 2. subG-1. 1. subG-2 subG-3. 0 1. 2. 2. 2 1,67. 2 2. 1 2. 2 0,67. 1 1. 2. 0 1. 1 0,67. 0 1,33. 1 0. 2. 2 1. 1 1,33. 1 0,33. 1 0. 2. 2 2. 2 1,67. 1 0,67. 1 0. 1 2. 1,67. 1 0,67. 2 1. 1,33. Table 7 Survey of Strength of relationship between driving forces and key local factors. 39.
(42) Calculate Impact and Uncertainty of driving Forces: After the session has concluded, the results from every subgroup were consolidated and tabulated. Once the data was consolidated, the impact of every driving force on the local factors was calculated by averaging the values of the three subgroups. Then the equation (1) was used in order to calculate the average impact of each driving force over the key local factors. The last row in table 7 shows the impact of each driving force thus calculated.. 4.1.7. Select scenario logic:. The scenario logic selection was developed during a two hour session involving all participants. The first part was used to present results of impact estimation of driving forces to the team. Results are shown in the following figure.. 60,00. 53,44. Average Impact. 14. 45,88. 50,00. 40,52. 39,23. 37,49. 40,00 30,00. 16. 52,10. 12 10. 10. 10. 9. 10. 20,00. 8. 8. 7. 6 4. 10,00. 2. 0,00. 0 National Security. Economy Stability. National Commercial agreement and infrastructure trading blocs. Land use regulations. Environmental Regulation. Number of key local factors impacted. Impact of Driving Forces. Average Impact. Number of key local factor impacted. Driving Force. Figure 5: Impact of Driving Forces. 40.
(43) Three out of the six driving forces evaluated show high scores and impact all key local factors: National Security, Economic Stability and National infrastructure. Even though the scores are close to each other (between 45.88 and 53.44), participants concentrated their attention on the driving forces with average impacts above 50. These driving forces represent main issues for the focal decision. They are uncertain in the planning horizon and they have an impact on all of the key local factors. Thus, National security and National Infrastructure are good candidates to be chosen as scenario axes. Driving forces such as the Land Use Regulations and the Economic Stability have less uncertainty because the Government has already published and established some territorial plans for the next 5 to 10 years, and the economy is in a stage of growth. However Colombia is an emerging country and it has been concluded that the economy will experience volatility. Environmental Regulation does not have an impact on as many key local factors as the other driving forces. Also, the current environmental situation around the world it is estimated that there will be pressure to implement environmental policies and regulations in the country. All participants agreed on National Security as one of the axes for the scenarios. However, there was a discussion between Commercial Agreements and National Infrastructure as the second axis for scenarios. The ones voting for Commercial Agreements explained that the logistics network would have significant changes depending on the country’s level of internationalization. Thus the business model might be highly impacted as a result of more complex supply chains, international regulations, entry of new companies and more competitors. On the other side, the ones in favor of National Infrastructure argued that even though commercial agreements might affect supply chain network, the fact that the country has some agreements or not, does not change the model per se. Commercial agreements 41.
(44) only opens the possibilities to look for more alliances and partnerships, but the concept is not transformed. Meanwhile, National Infrastructure is something that impacts business sustainability, in terms of costs and profitability first and second in terms of customer needs, capacity and resources availability. The infrastructure is a key driver for competitiveness. Finally, after consensus had been reached, the following two driving forces were chosen as the scenario axes: •. National Security. •. National Infrastructure. These two forces produced four scenarios according to the values which each of them could take. Later, the values will be described in detail. The scenario logic for Energeticos project is shown below:. Figure 6: Energeticos Scenario Logic. 4.1.8. Flesh Out Scenarios: After defining the two most impactful driving forces and therefore the two scenario axes, the values and definition for each scenario were identified in the same workshop. The steps in detail are presented below:. 42.
(45) Define high and low values of driving forces: After defining the scenario logic but before creating scenario structure, the high and low values of each driving force need to be defined. These values need to be based on the input of both the external researchers and the project team members. This step will be developed during the same session as defining the scenario logic.. Driving Force. National Security. High Value. Low Value. High level of security. The armed conflict has settled down so much that there is no significant impact on business development. There are low levels of crime, corruption and internal violence.. Low levels of security. There is a risky and unstable situation for the nation due to critical levels of crime, corruption and/or internal violence. The armed conflict affects industrial development, logistics nodes and triggers force population displacements. Adequate to meet demand. High quality infrastructure. Major National Infrastructure infrastructure investments and development.. Inadequate to meet demand. Minor infrastructure investment. There is a lack of modern infrastructure.. Table 8 High and low values of uncertainties in Energeticos environment over planning horizon (2022). Define scenario structure, name the scenarios: After defining the values for each driving force, the participants defined the following names and scenario structure:. 43.
(46) Figure 6: Energeticos Scenario Names. Write Scenario Story: The following descriptions were constructed out of the team discussion about possible scenarios.. •. Critical: Low security level, inadequate infrastructure: All attempts and processes to reach peace in Colombia have failed. Instead, Colombia's internal armed conflict continued, resulting in serious abuses by irregular armed groups, including guerrillas and successor groups to paramilitaries. Violence continues to displace millions of Colombians internally. Multinational companies are leaving the country and international investment has decreased dramatically. As if that were not enough, infrastructure such as ports, highways, energy distribution, water and sewerage facilities, telecommunication networks, etc., has not had significant progress or improvements. The infrastructure is inadequate to attend growing demand needs and economic activity, and is a major limitation for the country’s growth. Colombia. 44.
(47) is facing the prospect of being a laggard state due to the lack of innovation and investment in infrastructure.. •. Lag: High security level, inadequate infrastructure: The internal armed conflict in Colombia has ended. The war of violent groups outside the law, such as the FARC, is over. If there is any crime and corruption, it does not represent a high risk for national stability and order. Forced displacement has stopped and therefore the development in rural zones has increased. Although the end of the conflict has attracted more international investment, the infrastructure such as ports, highways, electricity, telecommunications, etc., has not had significant progress or improvements. The infrastructure is inadequate to attend demand needs, and is a major limitation for the country growth. Colombia is facing the prospect of being a laggard state due to the lack of innovation and investment in infrastructure.. •. Restricted: Low security level, adequate infrastructure. The investment in infrastructure has grown significantly. Innovation and high quality facilities are now available to satisfy economic needs. The infrastructure has dramatically changed and Colombia is now positioned as number one in Latin America region for the most advanced technology and efficient facilities. However the internal armed conflict in Colombia has not ended and continues to put at risk the country’s stability. All attempts and processes to reach peace in Colombia have failed. Instead, Colombia's internal armed conflict continued, resulting in serious abuses by. 45.
(48) irregular armed groups, including guerrillas and successor groups to paramilitaries. Violence continues to displace millions of Colombians internally.. •. Competitiveness: High security level, adequate infrastructure. The internal armed conflict in Colombia has ended The war of violent groups outside the law, such as the FARC, is over. If there is any crime and corruption, it does not represent a high risk for national stability and order. Forced displacement has stopped and therefore the development in rural zones has increased. Peace has brought international investment and the country is now an interesting target for multinational companies. The capital investment as much as the economic stability has made the infrastructure grow significantly. High quality infrastructure, innovation and efficiency are now the pillars of the economy.. 4.2 STRATEGIES DEFINITION AFTER CREATING SCENARIOS After the scenarios were created and discussed among participants, a brainstorming workshop was conducted in order to establish some strategies and business models for each of the scenarios. The following question was presented to all participants: Given Scenario X, what are the possible strategies and business models to properly confront the situation? After the brainstorming session, the strategies were summarized as follows: Scenario •. Lag. • • •. Strategies Reach efficiencies through technology adoption, low cost workforce and collaboration along the supply chain Strategic placement of supply chain network Gain efficiencies combining services for various clients. For example, sharing facilities, transport, and other services Strengthen clusters and associations in order to put pressure on government and other entities to increase development and investment in infrastructure. 46.
(49) • • • •. • • • • • • • Critical. • • • •. • • • • • Restricted. • • • •. Collaborative strategies with partners, suppliers and clients Incorporate security policies along the entire network Integrate risk management policies with all supply chain partners and clients Supply Chain best practices implementation, such as: Collaborative Planning, Forecasting and Replenishment (CPFR) Co-Located Procurement Representatives Cross Docking Lean Methodology Sales and Operations Planning Consolidation Market diversification Market diversification Establish alliances and partnerships outside Colombia Provide only the services that offers the highest profitability Reach efficiencies through technology incorporation, low cost workforce and collaboration along the supply chain Strategic placement of supply chain network Gain efficiencies combining services for various clients. For example, sharing facilities, transport, and other services transversally Incorporate security policies along the entire network Integrate risk management policies with all supply chain partners and clients Collaborative strategies with partners, suppliers and clients Supply Chain best practices implementation, such as: Collaborative Planning, Forecasting and Replenishment (CPFR) Co-Located Procurement Representatives Cross Docking Lean Methodology Sales and Operations Planning Consolidation Incorporate security policies along the entire network Training to all employees in risk management Integrate risk management policies with all supply chain partners and clients Collaborative strategies with government and military forces to guarantee safe operations Technological solutions implemented in order to integrate operations along the supply chain Strategic placement of supply chain network Risk sharing policies integrated with clients as well as with partners Collaborative strategies with partners, suppliers and clients Supply Chain best practices implementation, such as: Collaborative Planning, Forecasting and Replenishment (CPFR) Co-Located Procurement Representatives Cross Docking Lean Methodology Sales and Operations Planning Consolidation. 47.
(50) •. Competitiveness. • • • • • • •. Supply Chain best practices implementation, such as: Collaborative Planning, Forecasting and Replenishment (CPFR) Co-Located Procurement Representatives Cross Docking Lean Methodology Sales and Operations Planning Consolidation Develop services in diverse industries Market diversification Technology deployment. Systems integration and information sharing through the entire supply chain Decision support systems implemented Strategic placement of supply chain network Integrate risk management policies with all supply chain partners and clients. Table 9 Energeticos strategies by scenarios. 4.2.1. STRATEGIES PRIORITIZATION. Strategy Reach efficiencies through technology incorporation, low cost workforce and collaboration along the supply chain Strategic placement of supply chain network Gain efficiencies combining services for various clients. For example, sharing facilities, transport, and other services Strengthen clusters and associations in order to put pressure on government and other entities to increase development and investment in infrastructure Collaborative strategies with partners, suppliers and clients Incorporate security policies along entire network Integrate risk management policies with all supply chain partners and clients Supply Chain best practices implementation, such as:. Lag. Critical. Restricted. Competitiveness. X. X. X. X. X. X. X. X. X. X. X. X. X. X. X. X. X. X. X. X. X. X. X. X. X. 48.
(51) Collaborative Planning, Forecasting and Replenishment (CPFR) Co-Located Procurement Representatives Cross Docking Lean Methodology Sales and Operations Planning Consolidation Develop services in diverse industries Market diversification. X X. X. X X. Decision support systems implemented. Table 10 Energeticos strategies prioritization From the table above, the first strategies that the organization should start implementing are the ones that apply to every scenario. Therefore the company could be prepared to manage their decision in any of the scenarios by implementing the following strategies: Strategic placement of supply chain network, Collaborative strategies with partners, suppliers and clients, Integrate risk management policies with all supply chain partners and clients, Supply Chain best practices implementation. These strategies are also highlighted in blue in table 10.. 4.3 CONCLUSIONS AND RECOMMENDATIONS •. Scenario planning has provided to Energeticos an organized methodology to capture a whole range of possibilities and uncertainties that has allowed them to establish strategies and inputs for the development of further strategic plans.. •. The process involved participants from diverse areas, enriching the work throughout the inclusion of different points of view and perspectives.. 49.
(52) •. Scenario creation process allowed participants to think about the environment effect over the long term decision and the uncertainty in terms of what the company could influence (local factor) and what it cannot influence (driving forces). •. This scenario planning methodology allowed participants to establish a relationship between the local factors and driving forces by measuring the impact of externalities on the internal factors of the organization.. •. The project has created a strategic thinking approach throughout the acceptance, understanding and rationalizing of uncertainty.. •. Energeticos has understood the importance of comprehending the environment in order to become a 4PL service provider in Colombia.. •. Energeticos has identified its capability to take appropriate action when confronting different scenarios.. •. The organization has been able to envision the factors that may possibly affect it and therefore has initiated a strategic response process to support the firm’s actions by determining the magnitude and timing of control levers.. •. Scenario planning has provided a more tangible and measurable perception of change. It has allowed the company to better react to important changes in the environment.. •. It is recommended to develop plans in order to implement the strategies identified for the different scenarios.. •. Establish metrics to constantly measure and follow up the strategies and scenarios created because conditions may change within the planning horizon.. 50.
(53) REFERENCES. Bradfield, R., Wright, G., Burt, G., Cairns, G., & van der Heijden, K. (2005). The origins and evolution of scenario techniques in long range business planning. Futures, 37(8), 795812 Georgantzas, N., and William Acar. Scenario – Driven Planning. Learning to Manage Strategic Uncertainty. Westport: Quorum Books, 1995. Harries, C. (2003). Correspondence to what? Coherence to what? What is good scenariobased decision making? Technological Forecasting and Social Change, 70, 797-817. Kuhn, K. M., & Sniezek, J. A. (1996). Confidence and uncertainty in judgmental forecasting: Differential effects of scenario presentation. Journal of Behavioral Decision Making, 9(4), 231-247. Phadnis, Shardul S. “Influencing Managerial Cognition and Decisions Using Scenarios for Long-range Planning” Ph.D. diss., Massachusetts Institute of Technology, 2012. Rey, Maria F. “Encuesta Nacional Logística. Resultados del Benchmarking Logístico – Colombia 2008”. Latin America Logistics Center, 2008. Ringland, Gill. Scenario Planning. Managing for the Future. Chichester, England: John Wiley & Sons Ltda, 1998. Schoemaker, P. J. (1993). Multiple scenario development: Its conceptual and behavioral foundation. Strategic Management Journal, 14, 193-213.. 51.
Figure
+7

Documento similar
For instance, the latter include an API (Google Drive) for file management and sharing, in the cloud, or for analyzing user interaction with a web system (Google Analytics).
Service availability: The services will be available 99.99% and depending on the service provider and their policies, the service provider will remain liable to pay service
However, the policies some governments adopt can cause harmful tax competition with substantial unwanted consequences for other countries.In order to fully comprehend
Following the literature of collective households (see Chiappori and Donni 2010 for a recent survey), the utility of each individual in the household carries a weight,
The Council for Transparency and Good Governance of Spain, with the State Agency for Evaluation of Public Policies and Quality of Services (AEVAL), has developed a
GODISA’s main funder was the Integral Health System and the Municipality of El Agustino; therefore, health promo- tion and prevention actions were designed in the institutional-
• Network Slicing: A management mechanism that Network Slice Provider can use to allocate dedicated infrastructure resources and service functions to the user of the Network
The key idea underlying the energy efficiency of network sharing is that network capacity supply can be modulated by switching off some networks for the time periods in which traffic
