Comparative Life Cycle Assessment of the Conventional Façade SOS
Natura and the Natural Water Tank Façade
Rocío Carabaño
⇑
, Regina Pastor, César Bedoya, Diego Ruiz
Department of Construction and Technology in Architecture, Superior Technical School of Architecture, Technical University of Madrid, Avda. Juan de Herrera 4, 28040 Madrid, Spain
h i g h l i g h t s
Two façades designed for the energy rehabilitation of Spanish commercial buildings. LCA methodology used to perform the environmental evaluation of the façades. Comparative analysis of the impacts generated to compare environmental behaviour.
a r t i c l e
i n f o
Article history: Received 8 January 2015
Received in revised form 30 November 2015 Accepted 22 December 2015
Available online 4 January 2016
Keywords: Building materials Life Cycle Assessment CML 2001
Eco-indicator 99 Conventional Façade Natural Water Tank Façade Ecodesign
a b s t r a c t
The construction industry produces great environmental impacts to the planet. In order to tackle this problem, the European Union has put into effect Regulation No 305/2011, which compels the construc-tion products manufacturers to carry out environmental performance studies of these products and thus make public the impact they cause on the environment. The aim of this research is to make known the environmental impacts of the SOS Natura Conventional Façade (CF) solution, obtained within the research project ‘‘SOS Natura, Vegetal Architectural Solutions” developed by the Department of Construction and Technology in Architecture of the School of Architecture of the Technical University of Madrid (Spain). In addition, we report an environmental comparative with the Natural Water Tank Façade (NWTF), studied previously by the same work group and included in the same research project. We present as well an uncertainty analysis for both façades. Following the study conducted we conclude that the NWTF profile has a slightly better environmental behaviour when compared to the CF profile for the entire life cycle in most of the impact categories analysed in this study. However it should also be noted that, in detail and at stage level, the NWTF presents a higher environmental impact than the CF.
Ó2015 Elsevier Ltd. All rights reserved.
1. Introduction
The construction industry is not environmentally friendly, as
shown in the many studies performed about the environmental
impact of building materials, construction systems and the
differ-ent construction stages of buildings
[1–11]
.
According to the Worldwatch Institute, construction uses 25% of
the lithosphere’s resource extraction; it needs over 2 t of raw
mate-rials per m
2of building; the amount of energy associated with the
manufacture of the materials used in a building is 1/3 of a family’s
energy consumption during a period of 50 years and the
produc-tion of construcproduc-tion and demoliproduc-tion waste exceeds one annual
tonne per capita
[12]
.
Given these results, the European Union (EU) has put into effect
Regulation No 305/2011
[13]
, which compels manufacturers of
construction products to carry out environmental behaviour
stud-ies of these products and thus find out the impact they cause on
the environment. This information is collected in product labelling
or in the Environmental Product Declarations (EPD)
[14]
, both
pub-licly available documents very useful for the sector’s professionals,
since with this information they can prescribe the product or
building system most suitable for the project, taking into account
both its technical and environmental characteristics.
The study analysed in this article is included within the
research project ‘‘SOS Natura, Vegetal Architectural Solutions”,
whose main aim has been the development of the façade systems
SOS Natura Conventional Façade (CF) and Natural Water Tank
Façade (NWTF)
[15]
, which improve the thermal envelope and
energy efficiency of the building throughout its life cycle.
http://dx.doi.org/10.1016/j.conbuildmat.2015.12.155 0950-0618/Ó2015 Elsevier Ltd. All rights reserved.
⇑
Corresponding author.E-mail address:[email protected](R. Carabaño).
Contents lists available at
ScienceDirect
Construction and Building Materials
In this report we analyse the environmental impacts generated
by the CF system and compare them to the impacts obtained in the
Life Cycle Assessment study of the NWTF, so that we can observe
which of the two systems has a better environmental behaviour.
Following this comparative, we present an uncertainty analysis
for both the CF and the NWTF.
2. Materials and methodology
We have used the Life Cycle Assessment (LCA) methodology to obtain the envi-ronmental impacts associated with the CF system. With this study we have been able to compare the environmental impacts associated with each impact category analysed in both solutions. The information obtained will help the firm that mar-kets them, Intemper S.L., to inspire environment improvement actions of both products.
The methodology used follows the recommendations and complies with the requirements of the international standards ISO 14040:2006 [16] and ISO 14044:2006[17]. Similarly, we have followed the recommendations of standard EN 15804:2012[18]so that the results of the study may be used in the develop-ment of an Environdevelop-mental Product Declaration (EPD).
2.1. Objectives and scope of the study
The aim of the study is the analysis and assessment of the environmental impacts associated with the production of the CF for its later comparison with the environmental impacts associated with the production of the NWTF, previously studied[15].
2.1.1. Scope of the study
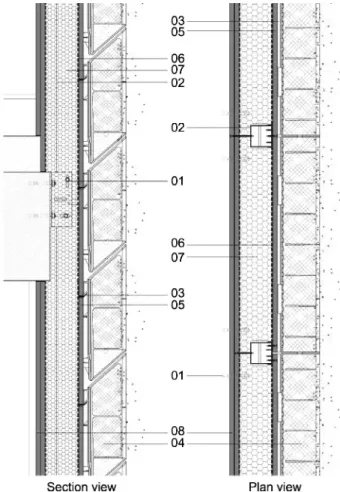
InFig. 1we can note the enclosure system CF composed of a sandwich panel with insulation, a half brick thick leaf and a layer of setting coat. This enclosure will also have a steel structure, made of a vertical sub-structure and brackets. InFig. 2 we can note the enclosure system NWTF, made of: panels composed of independent modules with vegetation (NATURPANELÒWater Tank, referred to as container throughout this article); layer or substrate feeding the vegetation; waterproofing
and insulation core; structural support and interior finishing that waterproofs everything as a whole. The modules measure 60 cm60 cm8 cm, with the nec-essary substrate inside for the development of the plant species, and adding a reser-voir for the storage of water and nutrients, to each panel. Both enclosures comply with the hygrothermal and acoustic requirements of the Spanish Technical Building Code[19], regarding their function as a façade.Table 1shows all the components associated with the solutions proposed for the CF and NWTF envelopes.
The functional unit proposed for both enclosure systems is ‘‘1 m2
opaque verti-cal enclosure, intended for buildings used for the service sector and with a duration of 40 years”.
2.1.2. System restrictions
The system restrictions include the following stages of the analysed façades’ life cycle:
Fig. 1.Plan and section views corresponding to the enclosure system of the
Conventional Façade (CF).
Fig. 2.Plan and section views corresponding to the enclosure system of the Natural
Water Tank Façade (NWTF).
Table 1
Components associated with the proposed solutions: CF and NWTF.
Façade Layers Code Description
CF Metal structure O1 Brackets
O2 Vertical substructure Exterior enclosure O3 Sandwich panel Intermediate enclosure O4 Insulation Interior enclosure O5 Half brick thick leaf
O6 Setting coat
NWTF Vegetation O1 Modules with vegetation Metal structure O2 Brackets
O3 Vertical substructure O4 Horizontal substructure Exterior enclosure O5 Cement board Intermediate enclosure O6 Waterproof sheet
O7 Insulation
Inventory (data) components of CF and NWTF.
Façade System Element Material Manufacture of the product Transport End-of-life process
Material per container (kg)
Material/functional unit (kg)
Amount/ FU
Contribution (%)
Transport (distance km)
Transport (distance km)
End-of-life process
Waste processing
CF Metal structure
Brackets Laminated steel – 0.62 2.78 ud 0.43 – Lorry 20–26T
(100)
Recycling –
Fixing bolts Stainless steel AISI 304 – 0.04 2.78 ud 0.03 – Lorry 20–26T
(100)
Recycling –
Mullion and muntin Laminated steel – 4.83 1.67 m 3.32 – Lorry 20–26T
(100)
Recycling –
Fixing screws Stainless steel AISI 304 – 0.01 5.56 ud 0.01 – Lorry 20–26T
(100)
Recycling –
Layers Sandwich panel Aluminium and LDPE – 5.5 1 m2
3.78 – Lorry 34–40T
(500)
Rubbish tip Aluminium. LDPE
Metal rivet Stainless steel AISI 304 – 9.54E 03 6.68 ud 0.01 – Lorry 7T (50) Rubbish tip Steel
Insulation Stone wool insulation – 4.8 1m2
3.3 – Lorry 34–40T
(100)
Rubbish tip Mineral wood
Brick wall Perforated brick – 76.83 57 ud 52.75 – Lorry 20–26T
(50)
Rubbish tip Inert material (not specified)
Cement mortar – 42 – 28.84 – Lorry 20–26T
(50)
Rubbish tip Inert material (not specified)
Setting coat Plaster – 1.10E+01 1 m2
7.55 – Lorry 20–26T
(50)
Rubbish tip Inert material (not specified)
NWTF Vegetated layers
Vegetation Depending upon location project
1.50E+00 15.37 – 14.26 – Lorry 20–26T
(200)
– –
Vegetable substrate Substrate with coconut fibre (70%)
1.76E+00 18.01 – 16.71 Ship/Lorry 34–40T
(12000/1000)
Lorry 34–40T (500)
Rubbish tip Organic waste
EPS (30%) 7.46E 01 7.64 – 7.09 Lorry 34–40T (50) Lorry 34–40T
(500)
Rubbish tip Plastic mixtures
NPK fertilizers (1%) 2.53E 02 0.26 – 0.24 Lorry 34–40T (1200) Lorry 34–40T (500)
– –
Synthetic filter FeltemperÒ150
Polyester textured filament
1.11E 01 1.14 – 1.06 Lorry 20–26T (50) Lorry 34–40T
(500)
Rubbish tip Plastic mixtures
NATURPANEL Water Tank (container)
Polypropylene (10% talcum)
1.31E+00 13.37 – 12.41 Lorry 34–40T (300) Lorry 34–40T (500)
Recycling Plastic mixtures
Colorants additives RAL 6006 (1.5%)
1.96E 02 0.2 – 0.19 Lorry 7T (300) Lorry 34–40T
(500)
– –
Synthetic filter FeltemperÒ150
Polyester textured filament
3.10E 02 0.32 – 0.29 Lorry 20–26T (50) Lorry 34–40T
(500)
Rubbish tip Plastic mixtures
Separating film Polycarbonate 1.80E 02 0.18 – 0.17 Lorry 7T (50) Lorry 34–40T
(500)
Rubbish tip Plastic mixtures
Water supply Rubber 3.00E 03 0.03 – 0.03 Lorry 7T (50) Lorry 34–40T
(500)
Rubbish tip Plastic mixtures
Metal structure
Branckets Laminated steel – 0.7 1.233 ud 0.65 – Lorry 20–26T
(100)
Recycling –
Fixing bolts Stainless steel AISI 304 – 0.009 2.47 ud 0.08 – Lorry 20–26T
(100)
Recycling –
Mullion Laminated steel – 6.29 1.67 m 5.84 – Lorry 20–26T
(100)
Recycling –
Fixing screws brackets Stainless steel AISI 304 – 0.02 1.233 ud 0.02 – Lorry 20–26T (100)
Recycling –
Muntin Cold formed steel – 2.24 3.33 m 2.07 – Lorry 20–26T
(100)
Recycling –
Fixing screws mullion Stainless steel AISI 304 – 0.01 11.12 ud 0.01 – Lorry 20–26T Recycling –
(continued on next page)
R.
Carabaño
et
al.
/Construction
and
Building
Materials
105
(2016)
563–571
A. Distribution of raw and auxiliary materials B. Transport to factory
C. Manufacture D. Transport to work site
E. End-of-life (transport and end-of-life process).
As for the processes, the production of machinery and industrial equipment are left out of the system analysed, due to the difficulty implied by taking an inventory of all the goods involved. Moreover, the LCA community considers their environ-mental impact per product unit to be low, relative to the rest of processes included. We have therefore used several databases where said processes are not included. Those databases, taking into account these processes, have been adapted in order to comply with this criterion. We have not included in the study the packaging of the raw materials nor the packaging of the final product, due to the difficulty of their modelling as it was an addition of several components with different origins until their reception in the construction site.
2.1.3. Criteria for the inclusion of input and output
As for the input and output, we have included in the study all those of which we had information about the amount and type of material. We guarantee that those not included, due to a lack of information about the material, add up to 1% at most of the total amount of material and energy inventoried per functional unit. The sum of all the input and output not inventoried doesn’t exceed 4% of the total value, both in material and in energy. The criterion for the exclusion of the input and output complies with Section 6.3.5 of standard UNE-EN 15804.
2.1.4. Hypothesis
During the development of the inventory of the CF we have used data provided by Intemper S.L., regarding the composition and amount of part of the materials and products used, as well as the distances to the suppliers. For the information not pro-vided by the firm, we have considered the same hypotheses we used for the NWTF inventory, explained below:
(1) In order to take inventory of the environmental burdens associated with the materials and processes involved in both solutions of the envelope, we have used the following databases through the GaBi 4.4 software[20]: European Life Cycle Database (ELCD v.1.0.1)[21], Ecoinvent 2.0[22], and PE Interna-tional[23].
(2) When considering the environmental impacts generated by the production of the electricity consumed in the system studied, we have taken into account the Spanish electricity mix of 2011, calculated from data provided by the World Wildlife Fund (Observatorio de la Electricidad, Spain)[24]. (3) For road transport in Spanish territory, European territory and worldwide,
we have considered three vehicle types: a two axle rigid lorry with a capac-ity up to 7.5 t, and articulated lorries up to 26 t and 40 t; we have assumed that they all comply with the standard Euro III[25]. For sea transport we have chosen a transoceanic container freighter. For transport to the end-of-life stage we have assumed that there is a construction solid waste tip within an 80 km radius around the building.
(4) We suppose that the components of the CF solution have the same refer-ence operating life than the NWTF ones, which enables them to fulfil their function during the lifetime of the building, established at 40 years. (5) For the end-of-life processes, we have considered that the impacts derived
from the recycling operations have to be attributed to the product systems that use them as raw materials. However all the processes related to depositing in the tip the materials used for the façade, using for this end both the Ecoinvent and the PE International databases, are attributed to the system studied. The Ecoinvent processes regarding the end-of-life of materials include transport to tip, which doesn’t happen for those of PE International. In order to maintain the coherence in the use of the databases we have adapted the Ecoinvent processes so that they don’t include said phase. This stage of the life cycle has been included in the analysis as a sep-arate process.
2.2. Life Cycle Inventory (LCI) assessment
2.2.1. Raw materials supply, transport, production and transport to the work site The CF is composed of two systems: the steel structure and the enclosure layers. The NWTF is divided in three systems: the vegetated layer, the steel structure and the enclosure layers.
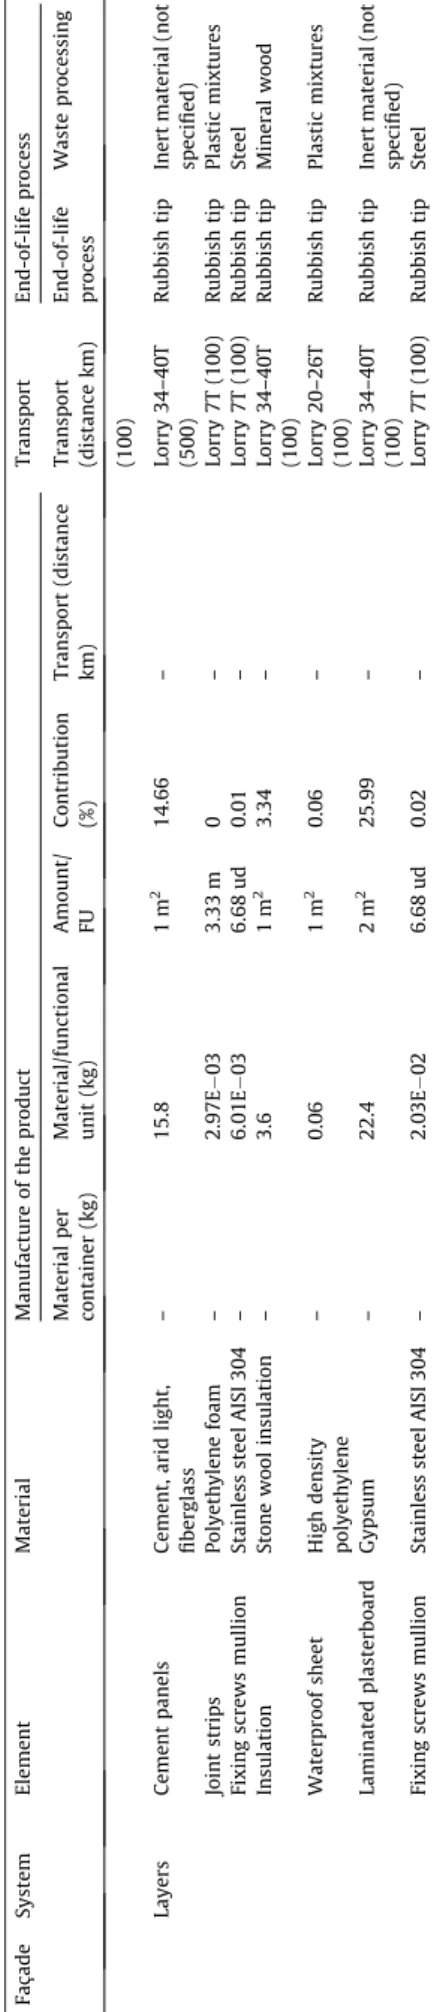
Table 2corresponds to specific data provided by Intemper S.L., except the trans-port to the work site, for which we have considered an average distance scenario of 500 km for Spain. Data regarding the amounts of material have been obtained by measuring the weight of the components in the Intemper S.L. facilities.
The amounts of materials (screws, corbels, metres of mullion or muntin, etc.) are expressed in units per functional unit.
Table 2 ( continued ) Façade System Element Material Manufacture of the product Transport End-of-life process Material per container (kg) Material/functional unit (kg) Amount/ FU Contribution (%) Transport (distance km) Transport (distance km) End-of-life process Waste processing (100) Layers Cement panels Cement, arid light, fiberglass – 15.8 1 m 2 14.66 – Lorry 34–40T (500) Rubbis h tip Inert material (not specified) Joint strips Polyethylene foam – 2.97E 03 3.33 m 0 – Lorry 7T (100) Rubbis h tip Plastic mixtures Fixing screws mullion Stainless steel AISI 304 – 6.01E 03 6.68 ud 0.01 – Lorry 7T (100) Rubbis h tip Steel Insulation Stone wool insul ation – 3.6 1 m 2 3.34 – Lorry 34–40T (100) Rubbis h tip Mineral wood Waterproof sheet High density polyethylene – 0.06 1 m 2 0.06 – Lorry 20–26T (100) Rubbis h tip Plastic mixtures Laminated plasterboard Gypsum – 22.4 2 m 2 25.99 – Lorry 34–40T (100) Rubbis h tip Inert material (not specified) Fixing screws mullion Stainless steel AISI 304 – 2.03E 02 6.68 ud 0.02 – Lorry 7T (100) Rubbis h tip Steel
With the values of the calculated volume and with data about the materials density, we have been able to determine the mass per functional unit of the com-ponents. We also show the percentage in weight of the component in relation to the total weight of the functional unit, both for the CF and the NWTF.
2.2.2. End-of-life: transport and end-of-life process
For the modelling of the end-of-life processes of the materials related to both façades, we have created two groups of materials. On one hand, those for which an important market related to their recycling exists, and on the other hand, those very likely to end up in the tip (Table 1).
The recycled components group includes all the elements from the steel struc-ture, for both the CF and the NWTF, since the materials have a high economic value in the recycling market. We have included in this group the container, large enough to facilitate its separation and guarantee the profitability of its recycling. Currently recycling plastic is a common practice; in fact the polypropylene with which the contained is made has this origin.
The group of materials destined to the tip includes those for which a waste pro-cessing does not exist presently. This group includes the fixing screws of the gyp-sum panels, as well as all the plastic materials that go with the container. We have modelled these elements with an end-of-life in tip even though they’re made
with recyclable materials, since their dimensions are small which affects the prof-itability of the recycling operations and the probability of their separation during the demolition of the building. We have modelled the transport of the materials to the tip by a 20–26 t class Euro III lorry, with an 80 km itinerary.
2.3. Impact categories
The impact categories assessed in this work correspond to the CML 2001[26] and Eco-indicator 99[27]methodologies, which represent the state of the art of endpoint and midpoint methodologies. For their calculation we have used the GaBi 4.4 software developed by PE International.
The impact categories analysed according to the CML 2001 methodology are:
– Abiotic depletion (AD) (kg Sb equivalents) – Acidification (A) (kg SO2equivalents)
– Eutrophication (Eu) (kg PO4equivalents)
– Global warming (GW) (kg CO2equivalents)
– Ozone layer depletion (O) (kg R11equivalents)
– Photochemical oxidation (PhO) (kg C2H4)
– Human toxicity (HT) (kg 1.4-DB equivalents)
Table 3
Impact categories assessment associated with the supply of raw materials, transportation and manufacture CF.
Methodology Category Indicator Total Metal structure Layers
kg % kg %
CML 2001 AD Sb-eq. 8.88E 01 1.08E 01 12.2 7.80E 01 87.8
A SO2-eq. 5.44E 01 6.16E 02 11.3 4.82E 01 88.7
Eu PO4-eq. 5.73E 02 7.83E 03 13.7 4.94E 02 86.3
GW CO2-eq. 1.33E+02 1.35E+01 10.2 1.19E+02 89.8
O R11-eq. 7.60E 06 2.39E 07 3.1 7.36E 06 96.9
PhO C2H4-eq. 6.18E 02 1.03E 02 16.7 5.14E 02 83.3
HT DC-eq. 5.95E+01 3.00E+01 50.5 2.94E+01 49.5
FWAE DC-eq. 7.89E 01 1.10E 01 13.9 6.79E 01 86.1
MWAE DC-eq. 2.00E+05 4.88E+03 2.4 1.95E+05 97.6
Eco-indictor 99 A/E PDFm2a 1.92E+00 2.61E 01 13.6 1.65E+00 86.4
E PDFm2a 3.60E+00 1.81E+00 50.2 1.79E+00 49.8
C DALY 1.90E 05 9.42E 07 4.9 1.81E 05 95.1
CC DALY 2.73E 05 2.81E 06 10.3 2.45E 05 89.7
OLD DALY 8.00E 09 2.52E 10 3.2 7.75E 09 96.8
IR DALY 2.09E 07 1.63E 08 7.8 1.92E 07 92.2
RI DALY 8.05E 05 1.58E 05 19.7 6.47E 05 80.3
RO DALY 7.45E 08 6.06E 09 8.1 6.84E 08 91.9
FF MJ 1.54E+02 9.00E+00 5.8 1.45E+02 94.2
M MJ 4.11E 01 3.60E 01 87.5 5.13E 02 12.5
Table 4
Impact categories assessment associated with the transportation to work site CF.
Methodology Category Indicator Total Metal structure Layers
kg % kg %
CML 2001 AD Sb-eq. 5.63E 03 1.21E 04 2.2 5.51E 03 97.8
A SO2-eq. 5.14E 03 1.11E 04 2.2 5.03E 03 97.8
Eu PO4-eq. 8.87E 04 1.91E 05 2.2 8.68E 04 97.8
GW CO2-eq. 8.33E 01 1.80E 02 2.2 8.15E 01 97.8
O R11-eq. 1.58E 09 3.42E 11 2.2 1.55E 09 97.8
PhO C2H4-eq. 4.17E 04 8.99E 06 2.2 4.08E 04 97.8
HT DC-eq. 2.71E 02 5.84E 04 2.2 2.65E 02 97.8
FWAE DC-eq. 9.52E 04 2.05E 05 2.2 9.32E 04 97.8
MWAE DC-eq. 1.48E+01 3.18E 01 2.2 1.44E+01 97.8
Eco-indictor 99 A/E PDFm2a 3.88E 02 8.38E 04 2.2 3.80E 02 97.8
E PDFm2a 6.43E 04 1.39E 05 2.2 6.29E 04 97.8
C DALY 1.12E 08 2.41E 10 2.2 1.09E 08 97.8
CC DALY 1.74E 07 3.76E 09 2.2 1.71E 07 97.8
OLD DALY 1.67E 12 3.59E 14 2.2 1.63E 12 97.8
IR DALY 4.15E 11 8.95E 13 2.2 4.06E 11 97.8
RI DALY 7.33E 07 1.58E 08 2.2 7.17E 07 97.8
RO DALY 4.05E 10 8.74E 12 2.2 3.97E 10 97.8
FF MJ 1.33E+00 2.86E 02 2.2 1.30E+00 97.8
– Fresh water aquatic ecotoxicity (FWAE) (kg 1.4-DB equivalents) – Marine water aquatic ecotoxicity (MWAE) (kg 1.4-DB equivalents).
The impact categories analysed according to the Eco-indicator 99 are:
– Human Health: carcinogens (C), respiratory organics (RO), respiratory inorgan-ics (RI), climate change (CC), ozone layer depletion (OLD) and ionising radiation (IR). All of them are expressed in Disability Life Years (DALY)[28].
– Ecosystem Quality: ecotoxicity (E) and acidification/eutrophication (A/E). Expressed as Potentially Disappeared Fraction (PDF).
– Resources: minerals (M) and fossil fuels (FF). Expressed as MJ.
3. Impact assessment and interpretation of the SOS Natura
Conventional Façade
3.1. Raw materials supply, transport and production
Table 3
shows the impacts due to the raw materials supply,
transport and manufacture stage, according to the CML 2001 and
Eco-indicator 99 methodologies, of the CF.
Table 5
Impact categories assessment associated with the end-of-life CF.
Methodology Category Indicator Total Steel Aluminium Mineral wood Inert material Plastic mixtures
kg % kg % kg % kg % kg %
CML 2001 AD Sb-eq. 1.06E 02 7.39E 07 0.01 2.03E 04 1.9 4.11E 04 3.9 9.60E 03 90.7 3.71E 04 3.5 A SO2-eq. 1.15E 02 8.26E 07 0.01 2.27E 04 2.0 2.53E 04 2.2 1.07E 02 93.5 2.65E 04 2.3
Eu PO4-eq. 4.08E 02 9.56E 08 0.00 2.63E 05 0.1 5.02E 05 0.1 1.42E 03 3.5 3.94E 02 96.3
GW CO2-eq. 2.91E+00 1.08E 04 0.00 2.97E 02 1.0 3.39E 02 1.2 2.60E+00 89.4 2.46E 01 8.5
O R11-eq. 4.05E 08 1.66E 12 0.00 4.55E 10 1.1 1.01E 08 24.9 2.16E 08 53.3 8.36E 09 20.6 PhO C2H4-eq. 1.85E 03 1.05E 07 0.01 2.87E 05 1.5 4.13E 05 2.2 1.70E 03 92.0 7.86E 05 4.2
HT DC-eq. 7.63E 02 4.76E 06 0.01 1.31E 03 1.7 3.09E 03 4.1 6.21E 02 81.4 9.76E 03 12.8 FWAE DC-eq. 1.16E 02 1.48E 07 0.00 4.05E 05 0.3 2.46E 04 2.1 6.60E 03 56.8 4.74E 03 40.8 MWAE DC-eq. 3.35E+02 2.40E 02 0.01 6.57E+00 2.0 2.60E+00 0.8 3.12E+02 93.2 1.37E+01 4.1
Eco-indictor 99 A/E PDFm2a 6.21E 02 4.43E 06 0.01 1.22E 03 2.0 1.74E 03 2.8 5.75E 02 92.6 1.67E 03 2.7 E PDFm2a 1.26E 02 9.57E 08 0.00 2.62E 05 0.2 4.62E 04 3.7 1.13E 02 90.0 7.72E 04 6.1 C DALY 5.43E 08 2.40E 12 0.00 6.61E 10 1.2 9.18E 10 1.7 3.77E 08 69.3 1.51E 08 27.8 CC DALY 5.67E 07 2.25E 11 0.00 6.19E 09 1.1 7.04E 09 1.2 5.07E 07 89.5 4.60E 08 8.1 OLD DALY 4.26E 11 1.74E 15 0.00 4.78E 13 1.1 1.06E 11 24.9 2.27E 11 53.4 8.78E 12 20.6 IR DALY 6.63E 10 4.40E 14 0.01 1.21E 11 1.8 2.30E 11 3.5 5.73E 10 86.3 5.54E 11 8.4 RI DALY 4.13E 06 3.05E 10 0.01 8.39E 08 2.0 4.35E 08 1.1 3.96E 06 95.9 4.30E 08 1.0 RO DALY 2.72E 09 1.42E 13 0.01 3.88E 11 1.4 7.03E 11 2.6 2.46E 09 90.5 1.49E 10 5.5 FF MJ 2.42E+00 1.69E 04 0.01 4.65E 02 1.9 9.49E 02 3.9 2.20E+00 90.7 8.45E 02 3.5 M MJ 1.39E 04 2.73E 09 0.00 7.52E 07 0.5 4.81E 05 34.7 3.54E 05 25.5 5.45E 05 39.3
Fig. 3.Relative contribution of the stages analysed in the life cycle associated with
the total impact categories (CML 2001 and Eco-indicator 99) of the SOS Natura Conventional Façade (CF).
Fig. 4.Comparative of the total impact categories (CML 2001 and Eco-indicator 99)
of the SOS Natura Conventional Façade (CF) and the Natural Water Tank Façade (NWTF).
3.2. Transport to work site
Table 4
shows the assessment of the impact categories
associ-ated with the transport of the CF elements to the construction site
of the building stage, according to the CML 2001 and Eco-indicator
99 methodologies respectively.
3.3. End-of-life: transport and final disposal
Table 5
shows the assessment of the impact categories
associ-ated with the end-of-life processes of the materials associassoci-ated with
the CF, according to the CML 2001 and Eco-indicator 99
method-ologies, respectively. These impacts are broken down into the
groups of materials with equal behaviour in the tip. We include
in each group the transport to the tip and disposal stage.
Addition-ally, we include in both methodologies the relative contribution to
the total impact of each one of the material groups according to
their behaviour in the tip. We verify that one of the greatest
contri-butions to the impacts during this life cycle stage comes from the
inert materials consisting of the bricks, cement and gypsum.
Another important contribution is due to the plastic materials,
whose origin is the polyethylene of the sandwich panels and the
mineral wool.
4. Results and discussion
4.1. Total results of the SOS Natura Conventional Façade
Fig. 3
shows, by way of summary, the impact categories
accord-ing to both methodologies used and for each one of the stages
anal-ysed. We can observe how the transport to the work site stage and
the end-of-life stage barely present any contribution in all the
impact categories analysed and in both methodologies. However,
we must note that the presence of plastic materials, serves to
increase the percentage of impacts associated with the
end-of-life stage up to 40% in eutrophication. This value is associated to
the elemental flows of COD, ammonium, nitrate and nitrite
gener-ated in a mixed plastics rubbish tip treatment, that affect said
impact category.
4.2. Comparative assessment of the associated impact categories
between the SOS Natura Conventional Façade and the Natural Water
Tank Façade
Once we have obtained the environmental impact assessment
of the SOS Natura Conventional Façade (CF), we perform the
com-parative assessment with the data previously gathered in the
envi-ronmental impact assessment of the Natural Water Tank Façade
(NWTF)
[11]
.
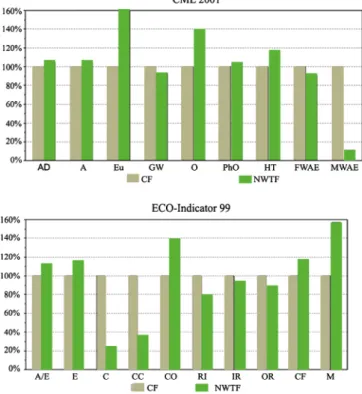
Fig. 4
shows the impact categories analysed in both
façades, according to both the methodologies used. We assign
the reference value to the CF, which is why its bars always have
a value of 100% for all the impact categories.
For the CML 2001 methodology, the NWTF presents a greater
contribution in the impact categories about eutrophication
(186%), stratospheric ozone (139%) and human toxicity (116%),
whereas the contribution decreases in marine water aquatic
eco-toxicity (11%).
For the Eco-indicator 99 methodology, the NWTF presents a
greater contribution in the impact categories related to minerals
(157%) and ozone layer depletion (139%), and a lesser contribution
for the carcinogens (25%) and climate change (36%) categories.
4.3. Uncertainty analysis
We have carried out the uncertainty analysis for both the CF
and the NWTF, for the stages analysed A1–A3, A4 and C2–C4 and
for the impact categories of the CML 2001 methodology. The
CML 2001 impact categories are the ones with the greater
consen-sus at a scientific and standard level and, with the exception of
those related to human toxicity and water aquatic ecotoxicity, they
appear in the standard EN 15804 about Environmental Product
Declarations and Product Category Rules (PCR)
[18]
.
For the uncertainty analyses we have used the Monte Carlo
method, which carries out n simulations on the model made for
the calculation of the LCA, introducing random values for each
and every one of the input parameters. The random values for
these input parameters have to be chosen within the uncertainty
limits considered for said parameters
[29]
.
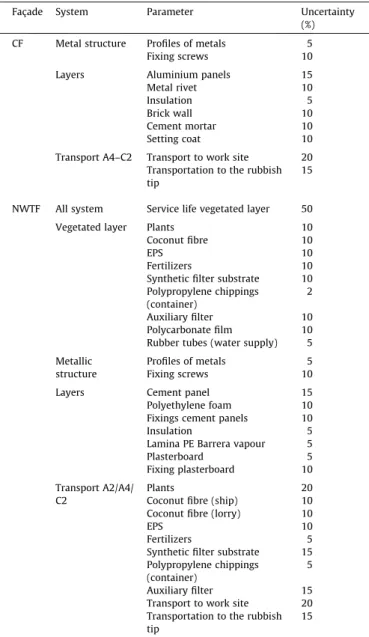
In this work we have carried out 100 simulations considering
equal probability distributions and considering the uncertainty
limits shown in
Table 6
. The limits in the uncertainty associated
with the final result, that is, associated with the value of the
impacts, are calculated for a 95% confidence interval.
Table 6
Uncertainty analysis of the input parameters expressed as percentage of the base value for the CF and the NWTF.
Façade System Parameter Uncertainty
(%)
CF Metal structure Profiles of metals 5
Fixing screws 10
Layers Aluminium panels 15
Metal rivet 10
Insulation 5
Brick wall 10
Cement mortar 10
Setting coat 10
Transport A4–C2 Transport to work site 20 Transportation to the rubbish tip
15
NWTF All system Service life vegetated layer 50
Vegetated layer Plants 10
Coconut fibre 10
EPS 10
Fertilizers 10
Synthetic filter substrate 10 Polypropylene chippings
(container)
2
Auxiliary filter 10 Polycarbonate film 10 Rubber tubes (water supply) 5
Metallic structure
Profiles of metals 5
Fixing screws 10
Layers Cement panel 15
Polyethylene foam 10 Fixings cement panels 10
Insulation 5
Lamina PE Barrera vapour 5
Plasterboard 5
Fixing plasterboard 10
Transport A2/A4/ C2
Plants 20
Coconut fibre (ship) 10 Coconut fibre (lorry) 10
EPS 10
Fertilizers 5
Synthetic filter substrate 15 Polypropylene chippings
(container)
5
Auxiliary filter 15 Transport to work site 20 Transportation to the rubbish tip
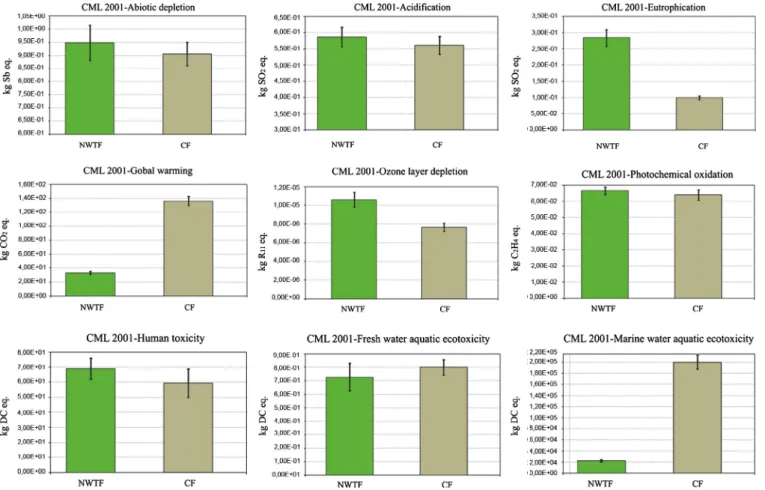
Fig. 5
show the impact values for the stages A1–A3, A4 and C2–
C4 of the NWTF and the CF. These values are shown with the
con-fidence interval calculated in the uncertainty analysis (95%).
5. Conclusions
Following the study carried out, we reach the conclusion that
the profile of the NWTF has a slightly better environmental
beha-viour when compared with the CF for all the life cycle and in most
of the impact categories analysed in this study.
Regarding total impacts and in the categories associated with
the CML 2001 methodology, the NWTF presents a better behaviour
than the CF (taking into account that the CF has a 100% in all the
impact categories) in ozone layer depletion, abiotic depletion,
acid-ification, photochemical oxidation and fresh water aquatic
ecotox-icity, all these being at least 97%. For global warming it would
decrease to 92%. However, the same is not true for human toxicity,
slightly higher than for the CF (104%). The only important
differ-ences occur for marine water aquatic ecotoxicity (71%) and
eutrophication (135%).
As for the impact categories associated with the Eco-indicator
99 methodology, the NWTF presents the same impacts as the CF,
for acidification-eutrophication and for ozone layer depletion; for
ionising radiation and respiratory organics and inorganics, it
doesn’t go below 97% (taking into account, again, that the CF has
a 100% value in all the impact categories). For climate change it
goes down to 92%.
The most notable and significant values occur in the impacts
related to carcinogens, which present a 55% reduction in the NWTF
(in comparison with the CF), and in the impacts related to
miner-als, whose increase in the NWTF is quite substantial (145%).
By analysing the impacts in a detailed manner and at a stage
level, we reach the following conclusions:
(1) The production stages (A1–A3) present higher impacts in the
NWTF, in comparison with the CF, with both the CML 2001
and the Eco-indicator 99 methodologies. This higher
contri-bution is due to the vegetated layer formed by the
NATUR-PANEL
ÒWater Tank container and the steel structure,
although it is noteworthy that the highest impact
contribu-tion is attributed to the NATURPANEL
ÒWater Tank
con-tainer, due to the injection process.
(2) The transport to the construction site stage (A4) is the one
presenting the lesser contribution to all the life cycle
anal-ysed, and can be considered negligible for all the impact
analysed, even facing the manufacture of the façade
compo-nents stages (A1–A3).
Regarding the benchmarking between façades, this stages
pre-sents higher impacts for the NWTF in comparison with the CF,
even though the total weight of the latter is greater. This is
due to the fact that many of the components of the NWTF have
to be transported from the Intemper S.L. facilities, increasing
the total distance of the shipping.
(3) The end-of-life stages (C2–C4) present, for most of the
impacts, a very small contribution to the impact of all the life
cycle. In the case of the NWTF, the only impacts of the
end-of-life stages that contribute significantly, in relation to the
stages A1–A3, are eutrophication, global warming and
pho-tochemical oxidation, for the CML 2001 methodology.
Fig. 5.Comparison between scenarios of the CF and the NWTF (A1–A3/A4/C2–C4).
Specifically, in the case of eutrophication, the impacts of the
end-of-life stages exceed the impacts of the manufacture
stages (A1–A3); for global warming and photochemical
oxi-dation, their contribution is of the same magnitude in the
manufacture stages. For the impacts associated with the
Eco-indicator 99 methodology, and also for the NWTF, the
end-of-life stages contribute significantly to carcinogens,
cli-mate change and respiratory organics.
In the case of the CF, the only significant impact associated with
the
end-of-life
stages
is
eutrophication
(CML
2001
methodology).
Acknowledgements
This research work has been possible thanks to the public funds
set aside for scientific research, development and technology
inno-vation, of the Spanish Science, Technology and Business system.
The authors wishes to thank the firm Intemper S.L. for the
confi-dence placed on us to carry out this study belonging to INNPACTO
programme of the Ministry for Science and Innovation
(IPT-380000-2010-13).
References
[1] J.F. Mendoza, J. Oliver-Solà, X. Gabarrell, J. Josa, J. Rieradevall, Life cycle assessment of granite application in sidewalks, Int. J. Life Cycle Assess. 17 (2012) 580–592,http://dx.doi.org/10.1007/s11367-012-0391-1.
[2] A. Castell, K. Menoufi, A. de García, L. Rincón, D. Boer, L.F. Cabeza, Life cycle assessment of alveolar brick construction system incorporating phase change materials (PCMs), Appl. Energy 101 (2013) 600–608, http://dx.doi.org/ 10.1016/j.apenergy.2012.06.066.
[3] I. Zabalza, A. Valero, A. Aranda, Life cycle assessment of building materials: comparative analysis of energy and environmental impacts and evaluation of the eco-efficiency improvement potential, Build. Environ. 46 (2011) 1133– 1140,http://dx.doi.org/10.1016/j.buildenv.2010.12.002.
[4] A.D. La Rosa, A. Recca, A. Gagliano, J. Summerscales, A. Latteri, G. Cozzo, G. Cicala, Environmental impacts and thermal insulation performance of innovative composite solutions for building applications, Constr. Build. Mater. 55 (2014) 406–414, http://dx.doi.org/10.1016/j.conbuildmat.2014. 01.054.
[5] J.D. Silvestre, J. de Brito, M.D. Pinheiro, Environmental impacts and benefits of the end-of-life of building materials e calculation rules, results and contribution to a ‘‘cradle to cradle” life cycle, J. Clean. Prod. 66 (2014) 37–45, http://dx.doi.org/10.1016/j.jclepro.2013.10.02.
[6] K. Condeixa, A. Haddad, D. Boer, Life cycle impact assessment of masonry system as inner walls: a case study in Brazil, Constr. Build. Mater. 70 (2014) 141–147,http://dx.doi.org/10.1016/j.conbuildmat.2014.07.113.
[7] F. Stazi, A. Mastrucci, P. Munafò, Life cycle assessment approach for the optimization of sustainable building envelopes: an application on solar wall systems, Build. Environ. 58 (2012) 278–288, http://dx.doi.org/10.1016/j. buildenv.2012.08.003.
[8] X. Li, Y. Zhu, Z. Zhang, An LCA-based environmental impact assessment model for construction processes, Build. Environ. 45 (2010) 766–775,http://dx.doi. org/10.1016/j.buildenv.2009.08.010.
[9] O. Ortiz, F. Castells, G. Sonnemann, Sustainability in the construction industry: a review of recent developments based on LCA, Constr. Build. Mater. 23 (2009) 28–39,http://dx.doi.org/10.1016/j.conbuildmat.2007.11.012.
[10] G. Pajchrowski, A. Noskowiak, A. Lewandowska, W. Strykowski, Wood as a building material in the light of environmental assessment of full life cycle of four buildings, Constr. Build. Mater. 52 (2014) 428–436,http://dx.doi.org/ 10.1016/j.conbuildmat.2013.11.066.
[11]R. Carabaño, S. Hernando, C. Bedoya, Repercusión del impacto ambiental en las distintas fases productivas de los procesos edificatorios según su grado de industrialización, Workshop Environ. Impact Build. Constr. 1 (2013) 96–104. [12] Worldwatch Institute, State of the World 2013: Is Sustainability Still Possible?
, Island Press, Washington DC., 2013.
[13] EU, Regulation No 305/2011 (Construction Products Regulation) of the European Parliament and of the European Council is regulation of 9 March 2011 lays down harmonised conditions for the marketing of construction products and replaces Construction Products Directive (89/106/EEC), 2011. Available online at: <http://eurlex.europa.eu/LexUriServ/LexUriServ.do?uri= OJ:L:2011:088:0005:0043:EN:PDF> (accessed online 07/15/2014).
[14] UNE-EN ISO 14020, Environmental Labels and Declarations. General Principles, 2000.
[15] R. Carabaño, C. Bedoya, D. Ruiz, Life Cycle Assessment of a new architectural solution that improves the thermal performance of the building envelope: Natural Green Tank Façade, Informes de la Construcción 66 (2014) 1–11, http://dx.doi.org/10.3989/ic.12.128.
[16] UNE-EN ISO 14040, Environmental Management. Life Cycle Assessment. Principles and Framework, 2006.
[17] UNE-EN ISO 14044, Environmental Management. Life Cycle Assessment. Requirements and Guidelines, 2006.
[18] UNE-EN ISO 15804, Sustainability of Construction Works. Environmental Product Declarations. Core Rules for the Product Category of Construction Products, 2012.
[19] Ministry of Development, Spanish Technical Building Code CTE, 2014. Available online at: <http://www.codigotecnico.org/web/recursos/documentos/> (accessed online 09/21/2014).
[20] PE International, Software GaBi (v 4.4), 2012.
[21] European Commission, European Life Cycle Database (ELCD v. 1.0.1), 2007. [22] Swiss Center for Life Cycle Inventories, Ecoinvent (v 2.0), 2013.
[23] PE International, Gabi Databases, 2013.
[24] World Wildlife Fund, Observatorio de la Electricidad, 2011.
[25] European Commission, Directive 2006/38/EC of the European Parliament and of the Council of 17 May 2006 amending Directive 1999/62/EC on the charging of heavy goods vehicles for the use of certain infrastructures. Available online at: <http://eur-lex.europa.eu/LexUriServ/LexUriServ.do?uri=OJ:L:2006:157: 0008:0023:EN:PDF> (accessed online 09/10/2014).
[26]J. Guinée, Handbook on Life Cycle Assessment. Operational Guide to the ISO Standards, Kluwer Academic Publishers, Dordrecht, The Nederthlands, 2002. [27]M. Goedkoop, R. Spriensma, The Eco-indicator 99. A Damage Oriented Method
for Life Cycle Impact Assessment, Pré Consultants B.V., Amersfoort, The Nederthlands, 2000.
[28] WHO, World Health Organization, Disability Life Years (DALY), 2013. [29] K. Peter, J. Filip, K. Karel, H. Jan, Technique of uncertainty and sensitivity