Deployment of an open sensorized platform in a smart city context
52
0
0
Texto completo
(2) university campus. For this integration, GIScience comes into play, where it offers different open standards that allow full control over “smart things” as an agile and interoperable way to achieve this. To test our system, we have deployed a network of different sensorized platforms inside the university campus, in order to monitor environmental phenomena. Keywords: Internet of Things, Smart Cities, Open-hardware, GIScience, Environmental monitoring, GEOEvent. 1. 1. Introduction. 2. The current century is perceived to be the century of cities. Some studies. 3. indicate that in 2007 the urban population exceeded the rural population in. 4. the world, and forecasts indicate that in 2050 it will be nearly 70% [1] of. 5. the total population. Cities have a huge impact on the economic and social. 6. development of nations. They are environments where people live and work,. 7. where companies carry out their activities, and are also major centres of. 8. resource consumption. It is estimated that nowadays cities are responsible. 9. for consuming 75% of the world’s energy and generating 80% of the gases. 10. responsible for the greenhouse effect [2].. 11. In an urban environment with a growing demand for efficiency, sustain-. 12. able development, Quality of Life (QoF) and an effective management of. 13. resources, public authorities must consider an evolution in the way that the. 14. cities are managed; so, new ways of managing are necessary to optimize re-. 15. sources. These are the objectives of a smart city. The use of Information and. 16. Communications Technology (ICT) is essential to lead the smart city move-. 17. ment [3]. Moreover, the latter requires advancements to connect everything. 2.
(3) 18. (sensors, actuators, etc.) as well as to monitor and act [4]; this process has. 19. come to be called the Internet of Things (IoT).. 20. Smart city is defined as the city that uses ICT to make its infrastructure,. 21. components and utilities offered more interactively and efficiently so that. 22. citizens can become aware of them. ICT has to play a crucial role in designing. 23. smart city projects and will be the key for supporting the transition to more. 24. sustainable cities [5]. Smart cities are defined by six different factors, such as:. 25. economy, people, governance, mobility, environment and living [6]. All these. 26. factors must be taken into account when we are considering deploying a smart. 27. city. IoT describes how in the real world, physical things are integrated into. 28. the digital world of bits and bytes [7]. In general, it involves the integration of. 29. each object, such as a sensor or device, that is connected via wired or wireless. 30. networks using the Internet. To achieve connectivity between things, the. 31. Internet Protocol (IP) is used in which each device has its own IP address.. 32. In a technological context, the smart city and the IoT concepts are two. 33. terms that are very closely linked. Both concepts need a mechanism to. 34. communicate; it is called Machine to Machine (M2M) and it will work with. 35. new developments and contribute to the future of Internet [8]. Actually,. 36. the future of the Internet will consist not only in connecting people, but. 37. also on the approach of a digital world, in which, ideally, everything will. 38. be connected. In the context of a city, these things can be buildings, cars,. 39. appliances, meters, etc. Undoubtedly, this new “real network” will lead to. 40. a new way of managing a household, company, community, city or even. 41. country.. 42. Smart cities need IoT to listen and to understand what is going on in town,. 3.
(4) 43. thus, allowing for better decisions and providing information and services. 44. appropriate to their inhabitants. In addition, the use of advanced real-time. 45. analytic techniques is what creates a sort of awareness and understanding. 46. of the city, which undoubtedly improves services. Current smart cities are. 47. urban spaces with infrastructure, intelligent networks and platforms, with. 48. millions of sensors and actuators, in which the people themselves and their. 49. mobile phones must also be included.. 50. For all of these reasons, there is an increasing demand for the deployment. 51. of Wireless Sensor Networks (WSNs) that provide updated information about. 52. the state of the environment not only in a city, but also in many other. 53. scenarios, like agriculture, meteorology and/or health.. 54. Nowadays, there are initiatives to monitor cities (or other scenarios),. 55. which are based on commercial solutions [9] and are usually expensive and. 56. proprietary; this can involve some barriers and preclude their continued de-. 57. velopment. Faced with these impediments, there have been many initiatives. 58. of open embedded platforms which have become important [10]. In recent. 59. years, there have been several projects that can connect with Internet such as. 60. “smart thing” and they have released the schematics of their devices, which. 61. has increased their use. One remarkable example is the Arduino project [11],. 62. a low-cost and easy to use micro-controller platform, with a huge community. 63. of developers that share information, experiences and knowledge.. 64. Within this context, we present our proposed method, which consists of. 65. the deployment of an open (both hardware and software) sensorized platform. 66. called SEnviro [12] in a smart city context. To achieve this, we have used. 67. SmartUJI [13] as a test-bed to check the possibility of adding an open plat-. 4.
(5) 68. form in order to meet the requirements of obtaining a smart city. SmartUJI is. 69. an initiative to apply smart cities‘ approaches in a university campus (Jaume. 70. I University’s1 ). It is based on the integration of the university‘s-corporate. 71. information, digital maps and derivative applications.. 72. In this work, the union between IoT and smart cities will be addressed in. 73. the hands of Geospatial Information Systems (GIS) and GIScience. It will. 74. give us the methodologies and tools to make this union possible. GIScience. 75. is called on to support the development of the “smart devices” in order to. 76. enhance its compatibility and interoperability.. 77. A new solution is used to make the said union possible. As we will detail. 78. in the next sections, an extension of ArcGIS Server2 is used which is called. 79. GEOEvent3 . This tool can be used as a bridge between the two concepts.. 80. Also, it adds new improvements such as enabling data consumption in real-. 81. time and applying algorithms over these data in order to launch alerts or. 82. generate some outputs as a result.. 83. In summary, the main contributions of this work are: (1) integration of. 84. an open hardware sensorized platform in a smart city context; (2) GIScience. 85. standards and solutions have been applied to enhance interoperability be-. 86. tween IoT and smart city solutions; (3) applying for monitoring environmen-. 87. tal meteorological and air quality phenomena; and (4) offering a client in. 88. order to make decisions over data provided by sensors. The rest of the paper is organized as follows. Section 2 presents the. 89. 1. See http://www.uji.es/ (last accessed: November, 2015) See http://server.arcgis.com/ (last accessed: November, 2015) 3 See http://server.arcgis.com/en/geoevent-extension/ (last accessed: November, 2015) 2. 5.
(6) 90. background to position the current work. Section 3 details the smart city. 91. platform, called SmartUJI. Section 4 talks about the SEnviro platform, an. 92. open sensorized platform to make “smart things”. Section 5 shows how we. 93. have integrated the SEnviro platform in the SmartUJI. Section 2.5 enumer-. 94. ates similar related work. The paper ends in Section 6 with conclusions and. 95. future work.. 96. 2. Background. 97. This section details the concepts that will be employed throughout the. 98. article. It talks about smart cities and the different factors that are featured.. 99. Afterwards, the IoT movement using open-hardware is discussed. Subse-. 100. quently, the third section details how the cloud computing concept is applied. 101. to the IoT environment. Finally, the last section details how GIScience is. 102. able to standardize the IoT movement.. 103. 2.1. Building smart cities. 104. Although there is still no formal definition and widely accepted ”Smart. 105. City”, the ultimate goal is to make better use of public resources, increas-. 106. ing the quality of services offered to citizens, while reducing operating costs. 107. within the public administrations. This can be achieved by deploying a net-. 108. work of IoT devices.. 109. The IoT movement aims to make the Internet even more enveloping and. 110. pervasive in our daily lives. It allows easy access and interaction with a. 111. wide variety of devices such as, for example, appliances, cameras, sensors,. 112. actuators, displays, vehicles, among others.. 6.
(7) 113. Actually, this paradigm is applied in many different fields, such as home. 114. automation, industrial automation, medical aids, mobile healthcare, elderly. 115. care, intelligent energy management and smart grids, automotive, manage-. 116. ment fields traffic, and many others [14].. 117. Nonetheless, it is a very heterogeneous field, because there are solutions. 118. that meet the demands of all possible scenarios. This situation has led to. 119. the proliferation of different and sometimes incompatible proposals for the. 120. realization of a common goal; as a result the search for a common standard. 121. is one of the biggest challenges.. 122. The availability of different types of data collected by a network of IoT. 123. devices can also be exploited to increase transparency and promote the local. 124. governments interaction withits citizens, increase public awareness of the. 125. situation of the city, encouraging active participation of citizens in managing. 126. public administration, and to stimulate the creation of new services.. 127. In addition to increasing citizen participation, the main benefit of this. 128. move is to add value to existing services [15]. The challenge is to offer services. 129. within cities to increase quality and improve life, and this implies an economic. 130. advantage for administrations. Examples where the IoT devices are applied. 131. and provide benefits to both citizens and administrations are: structural. 132. health of buildings, waste management, air quality monitoring, noise, traffic. 133. congestion, energy consumption, smart parking or smart lighting.. 134. These examples are part of some of the six axes of a smart city 4 . These. 135. axes are: urban mobility (smart mobility), energy efficiency and overall sus4. http://www.smart-cities.eu/ (last accessed: October, 2016). 7.
(8) 136. tainable resource management (smart economy), participatory governance. 137. (smart governance), quality of life (smart people), attractive natural con-. 138. ditions, pollution or environmental protection (smart environment), public. 139. safety as well as the areas of health, education and culture (smart living).. 140. Subsequently, each of these factors are detailed.. 141. According to the study by [16], smart city initiatives related to the smart. 142. environment (33%) are those that have more representation, followed by. 143. those that are associated to smart mobility (21%). The other factors are. 144. distributed more evenly, registering a percentage of about 10% coverage in. 145. all cities. These numbers reveal that there is a great concern about environ-. 146. mental monitoring [17, 18, 19, 20]. In fact, there are multiple projects that. 147. have been developed to quantify or qualify the environment to address this. 148. concern and they use sensors to collect observations from the environment.. 149. 2.2. Open-hardware to make smart things. 150. On one hand, the main ICT providers have made efforts to develop cross-. 151. platform intelligent cities (PlanIT operating system5 , the IBM Intelligent. 152. Operations Center6 or Smart City platform solution Oracle7 ) designed to. 153. integrate information from the city and make it available to end users.. 154. On the other hand, utilities (water, electricity, gas, etc.) have their pro-. 155. prietary solutions (SCADA, Amis, etc.) specifically designed to operate and 5 6. See http://living-planit.com/ (last accessed: October, 2016) See http://www-03.ibm.com/software/products/en/intelligent-operations-center (last. accessed: November, 2015) 7 See http://www.oracle.com/us/industries/public-sector/national-localgovernment/city-platform/index.html (last accessed: October, 2016). 8.
(9) 156. monitor this infrastructure and provide management services and billing.. 157. This situation poses a problem of interoperability between the mainframe. 158. and other specific systems. The lack of a common standard and not knowing. 159. how both systems are built, preclude their integration.v. 160. As a result of this, nowadays the open movement has gained a lot of. 161. attention [10]. Traditionally, this idea was applied more freely to the code. 162. and provoked the open-source movement. More recently, the same idea has. 163. been applied to the hardware (open-hardware). This situation has permitted. 164. offering complete open systems, where both source and hardware are open.. 165. The users can contribute to improving the system and propose improvements.. 166. One of these improvements is the capacity to offer more interoperability. 167. between components, because this approach can be adapted for each usage.. 168. So, it reduces compatibility issues. This advantage permits the application. 169. of different standards that in the future can be established and will allow. 170. a standardized approach to the IoT. In this work, we apply different GIS. 171. standards to communicate with each IoT device; we will talk about these. 172. standards in the following paragraphs.. 173. Another improvement is the low cost of these devices compared with. 174. commercial solutions. As concluded by [21], open initiatives are cheaper, but. 175. have also demonstrated that open hardware is more powerful and has better. 176. performance than commercial solutions. Also, the same work demonstrates. 177. that the open hardware project can be considered reliable.. 178. Currently, there are several different alternatives regarding the micro-. 179. controller based platform, and the most remarkable platforms are: Arduino,. 180. Raspberry Pi, BeagleBone or MSP430 Launchpad. All these platforms can. 9.
(10) 181. be easily expanded, and offer other robust applications.. 182. Different applications have been developed thanks to the acceptance of. 183. IoT movement. Apart from smart city applications there are others that. 184. also contribute to attaining a smart city. These are healthcare [22, 23, 24]. 185. (ambient-assisted living and telemedicine), smart home and smart meter-. 186. ing [25, 26] (devices that enable the automation of common in-house ac-. 187. tivities), video surveillance [27] (intelligent video systems), automotive and. 188. smart mobility [28, 29] (intelligent transportation systems) and smart energy. 189. and smart grid (intelligent management of energy distribution and consump-. 190. tion) [30].. 191. All these applications have produced the popularity of “smart things”. 192. connected to Internet, and the networks created with them. In this way,. 193. the traditional WSNs have been updated to follow an IP connection in order. 194. to apply all the benefits that it entails. The new paradigm, namely cloud. 195. computing, has been added to improve and provide more advantages over. 196. the IoT [31].. 197. 2.3. IoT in the cloud. 198. Smart solutions need the two paradigms, IoT and Cloud Computing (CC).. 199. They had followed different paths, but in the last years, IoT has been sup-. 200. ported by CC. CC offers a good solution to implement IoT service manage-. 201. ment [30], and gives unlimited computational and storage capabilities that. 202. are limited in IoT. Also, CC can take improvements from IoT, extending. 203. its scope to “real things”. These two worlds are forced to understand each. 204. other.. 205. There are many challenges and opportunities for emerging future smart 10.
(11) 206. cities, which can be addressed by means of cloud computing [32, 33]. The. 207. IoT movement is distinguished by a wide variety of devices, with different. 208. technologies and protocols. These features mean different disadvantages,. 209. such as the lack of interoperability, security, scalability, efficiency or reliabil-. 210. ity. It is difficult to achieve all these characteristics, but the cloud approach. 211. may be helpful to solve these shortfalls by offering additional features like. 212. ease-of-access and use with lower cost [34, 35].. 213. CC offers great benefits for applications hosted on the web, which also. 214. have special computation and storage requirements. In addition, it offers easy. 215. access to them via networks and allows users to focus on the development of. 216. applications. Users only have to set up their sensors to send data through. 217. IoT platforms.. 218. The cloud can provide a virtual infrastructure that integrates device con-. 219. trol, storage, analysis tools, visualization, and delivery of customer platforms.. 220. This platform acts as a receiver of ubiquitous sensor data, to analyze and. 221. interpret the data, as well as to provide the user with a visualization that is. 222. easy to understand, which is a key feature required for the generation of IoT. 223. applications based on the web.. 224. Figure 1 details the work-flow for connecting sensor nodes to users using. 225. a cloud computing infrastructure. This figure divides the physical and cyber. 226. worlds and the IoT part with traditional Information Technology (IT). In. 227. order to pass the barrier between the IoT device cloud and the IT cloud,. 228. a gateway is used [36]. There are many options available for the gateway. 229. devices. It can be used to perform routine tasks. It has also been used to. 230. add security features, like encryption. We use this approach to deploy the. 11.
(12) 231. sensorized platform detailed in Section 4.. 232. 2.4. GIScience role in IoT. 233. The third and last pillar to understand the proposed work is GIScience.. 234. GIScience can be defined as “the discipline that uses Geographic Informa-. 235. tion Systems as tools to understand the world” [37]. It can contribute by. 236. offering an important key component for the IoT movement, which is in-. 237. teroperability by means of the use of standards. A non-profit international. 238. organization which develops open standards for the global geospatial commu-. 239. nity is the Open Geospatial Consortium (OGC)8 . OGC defines standards in a. 240. wide variety of domains including environment, defence, health, agriculture,. 241. meteorology, sustainable development, and smart cities.. 242. The OGC has standardized Sensor Web Enablement (SWE) as a set of. 243. specifications related to sensors, sensor data models and sensor web ser-. 244. vices that will enable sensors to be accessible and controllable via the web. 245. [38]. It is composed of a set of standards, the most popular are: Obser-. 246. vations and Measurements (O&M), SensorML, Sensor Observation Service. 247. (SOS), Transducer Model Language (TransducerML), Sensor Planning Ser-. 248. vice (SPS), Sensor Event Service (SES) or Web Notification Service (WNS).. 249. Other proposal is OGC SensorThings API 9 . It is a new candidate stan-. 250. dard that provides open access built on web protocols, based on the current. 251. SWE standards and following the architectural REST style. Its aim is to. 252. provide a standardized method to expose the world of the IoT to the real 8 9. See http://www.opengeospatial.org/ (last accessed: November, 2015) See http://ogc-iot.github.io/ogc-iot-api/ (last accessed: November, 2015). 12.
(13) 253. world, where things have limited resources.. 254. All these standards have been developed following the open software ini-. 255. tiative. Matter of fact, they are the different available implementations. The. 256. highest representative of them, is 52 North. 257. dards, and offers them as open software.. 10. . It supports a lot of the stan-. 258. If we consider proprietary solutions related with GIScience, the main. 259. player is ESRI Inc11 . This corporation offers a wide variety of products. All. 260. these products are fully compliant with OGC specifications (WMS, WCS,. 261. and WFS) in addition to other industry standards. The ArcGIS Server is the. 262. heart of all of these products and is used to publish and share geospatial data,. 263. maps or models, among others. Afterwards we detail how this technology is. 264. used to deploy SmartUJI and to connect a IoT solution with a smart city. 265. platform.. 266. GIScience can offer a good opportunity to standardize the ways of con-. 267. necting to the different “things”, offering an interoperable connection; and it. 268. should help to deploy the new smart cities.. 269. 2.5. Related work. 270. In the literature, there are some approaches that are similar to our pro-. 271. posal. The following items describe the works that have been analyzed. All. 272. of them talk about IoT in the smart city context.. 273. • [39] describes the SmartSantander. The objective is meant to measure. 274. different environmental parameters like temperature, CO, or light and 10 11. See http://52north.org/ (last accessed: June, 2016) See http://www.esri.com/ (last accessed: November, 2015). 13.
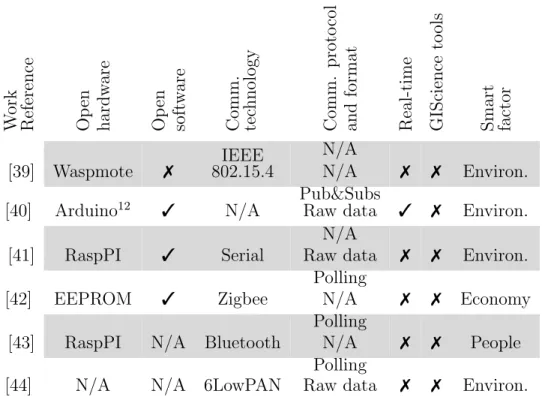
(14) 275. present this information within a web interface.. 276. • The authors in [40] simulate a real-world scenario to test a frame-. 277. work to connect IoT devices to the cloud. This framework is called. 278. Stack4Things and uses the MOM concept to serve the data provided. 279. by the simulated sensor (Ceilometer).. 280. 281. • In [41] the authors present an implemented data acquisition system based on an IoT framework.. 282. • The work presented in [42] presents the design considerations, a real. 283. implementation and validation of a system called smart signal. They. 284. use an EEPROM memory with Zigbee communication to implement a. 285. system to control the emergency signaling in a tunnel context.. 286. • A cloud based general architecture for smart cities is presented in [43].. 287. It tests the platform with a cloud based service for on-line health an-. 288. alytics for use within the community to support personalised on-line. 289. health analytics.. 290. • [44] describe a pilot implementation of urban IoT within a smart city. 291. framework in Podava. They propose an IoT peripheral system which. 292. supports an HTTP-based interface, making it possible to interact with. 293. it in an open, standard, and technology-independent way. Each IoT. 294. provides different phenomena, such as light, humidity and benzene level. 295. in the air.. 296. • Pokric et al. [45] present an environmental monitoring solution called. 297. ekoNET to monitor the air pollution and atmospheric parameters. The 14.
(15) 298. authors declare the solution as end-to-end and it offers all necessary. 299. components, namely devices, back-end infrastructure and client appli-. 300. cations both web and mobile.. 303. one have been proposed:. Open software. Comm. technology. 7. [40]. Arduino12. 3. N/A. [41]. RaspPI. 3. Serial. [42]. EEPROM. 3. Zigbee. [43]. RaspPI. N/A. Bluetooth. [44]. N/A. N/A. 6LowPAN. Open hardware. Work Reference. [39] Waspmote. IEEE 802.15.4. N/A 7 N/A Pub&Subs Raw data 3 N/A Raw data 7 Polling N/A 7 Polling N/A 7 Polling Raw data 7. Smart factor. ison between the detailed works. The following features to characterize each. GIScience tools. 302. Real-time. In order to compare the formerly reviewed works, Table 1 has a compar-. Comm. protocol and format. 301. 7. Environ.. 7. Environ.. 7. Environ.. 7. Economy. 7. People. 7. Environ.. Table 1: Comparison between different related works.. 304. • Open-hardware: the work uses or does not use an open-hardware components to create the “smart things”.. 305. 12. Simulate. 15.
(16) 306. 307. 308. 309. 310. 311. • Open-software: the system is offered or is not as open-software. Scale: Yes/No. • Communication technology: what kind of infrastructures is used to connect the “smart things”. • Communication protocol and format: what kind of protocol and format are used to give connectivity for each “smart thing”.. 312. • Real-time: indicates if the system works in real-time. Scale: Yes/No.. 313. • GIScience tools: shows if the system offers GIScience tools as OGC. 314. 315. 316. standards, GIS layers, etc. • Smart factor: smart environment, smart people, smart economy, smart mobility, etc.. 317. Table 1 shows that Arduino and Raspberry Pi are used in three works,. 318. this corresponds to half of the analysed works. These two platforms are easy. 319. to use because they have large communities that support the two platforms. 320. and offer a wide variety of examples and tutorials.. 321. The works proposed in [40, 41, 42] use open-software to deploy their. 322. systems. Our project uses partially open-source, because the GEOEvent. 323. extension is considered as proprietary software. All other parts included. 324. SEnviro APP, can be considered as open-source.. 325. The technology used to connect the “smart things” is different for each. 326. analysed work and it depends on the communication infrastructures available. 327. in the scenario to be deployed. In our case, we used Wi-Fi because, our use. 328. case offers Wi-Fi connectivity around the whole area. 16.
(17) 329. Our work follows different communication protocols between them, we. 330. offer a Publish & Subscribe with the StreamLayer, which offers a real-time. 331. connection. However, unlike the others, our project aims to be interopera-. 332. ble, and for this purpose, it is the only one that uses GIScience standards,. 333. such as SOS and SensorThings API and we provide different layers such as. 334. FeatureLayer.. 335. Finally, we can conclude that smart environment is the main smart factor. 336. where “smart devices” are used; this is based on the fact the objective of five. 337. out of seven analyzed papers has been to monitor environmental parameters.. 338. 3. SmartUJI platform. 339. The objective of this section is to describe the current SmartUJI platform. 340. [13, 46]. To test our system, we have used a university campus as smart. 341. city test bed. A University campus can be considered a small city as it. 342. provides similar services and has similar infrastructures, communications,. 343. and transport networks, all of which are necessary for managing and carrying. 344. out the daily activities of thousands of people (students, staff and visitors),. 345. much in the same way they do in any small city.. 346. Although SmartUJI may be wrongly considered as a simple collection. 347. of base maps and other kind of data (see Figure 2), it is a platform where. 348. all the public information related to the university has been standardized. 349. and made accessible using RESTful and web services. Geospatial location. 350. has been used to join the campus topology and these other kinds of data.. 351. Thereby, we demonstrate this on a map, which shows where each professor. 352. is teaching his/her class or by the buildings power consumption 17.
(18) 353. SmartUJI aims to help students, staff and visitors by increasing efficiency.. 354. It is intended to serve as a platform for decision-making within the University. 355. campus. Another functionality of the SmartUJI is to offer access to different. 356. datasets, where they present some natures (formats) and codifications. In. 357. this way, it offers one access point to multiple kinds of data. To serve and. 358. visualize all these data, SmartUJI implements different services and offers. 359. some applications for each functionality. The SmartUJI pretends to be a. 360. horizontal/transversal platform with interoperable data and services, in order. 361. to offer open access and facilitate the creation of applications.. 362. To build this platform, we have used a SmartUJI Core that will be used. 363. as a base to expand and create new applications. This Core is built with a. 364. Commercial Off-The-Shelf (COTS) GIS software, called ArcGIS Server. It. 365. is a powerful tool in geospatial and mapping applications which was devel-. 366. oped by Esri Inc. Some benefits that are achieved by offering this core, are:. 367. scalability, extensibility, reliability and/or security. Also, we obtain an open,. 368. interoperable and standards base system [47].. 369. Following a GIS point of view, we can consider a smart city platform as. 370. a Spatial Data Infrastructure (SDI) [48]. In the SDI context, the architec-. 371. ture is defined with three different layers, as they are content, services and. 372. applications (Figure 3).. 373. 3.1. Content layer. 374. In this first layer, data and models are stored. In a smart city context, the. 375. data layer will contain the structure and the relationship of all the entities. 376. that are required for this model, in this case, a University campus. Each. 377. modelled element was stored in a main geodatabase and has features, such 18.
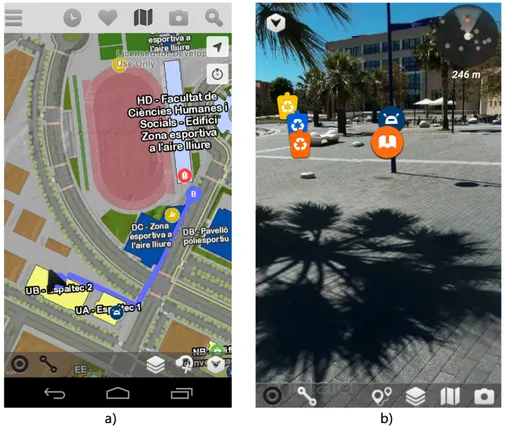
(19) 378. as: area, building identifier, floor, side and room number. These features. 379. were used to join geospatial elements and other information. Afterwards,. 380. these data were in different sites and formats (txt, csv, pdf, etc.). This. 381. platform has only been used to offer an access point.. 382. 3.2. Services layer. 383. Contains basic maps and data services. Several services have been de-. 384. veloped to retrieve the interior and exterior cartography of the campus.. 385. In addition, services have been developed to get information from exter-. 386. nal databases. Other services are provided in order to facilitate access to. 387. the data and to visualize them in layers. Some of them are: services to re-. 388. trieve information about technical services, academic and research staff from. 389. the university directory; a service to provide data about power consumption. 390. from smart energy meters; or a service to generate the route between two. 391. places. Also, we offer a Wi-Fi Indoor Positioning System (IPS) [49, 46] as. 392. a service. All these services can be used by applications, and any changes. 393. and improvements are transparent to the mobile application developers and. 394. to the final users.. 395. 3.3. Application layer. 396. The SmartUJI offers a wide variety of applications which have specific. 397. functionalities. Among these, a webmap-based called SmartUJI web (see. 398. Figure 2), that allows query and visualization of the university’s database. 399. records. It uses all services detailed above. SmartUJI APP (see Figure 4 a)):. 400. a native smartphone application which provides most of the functionalities. 401. of the web-based version. Also, SmartUJI Augmented Reality (AR) (see 19.
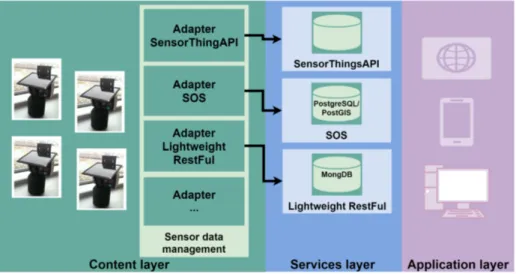
(20) 402. Figure 4 b)): this application can visualize the location of selected facilities. 403. superimposed on the real phone-view as well as guide users through the. 404. campus with its route displayed in real time. All applications use the services. 405. provided by the Core layer described above.. 406. 4. The SEnviro platform. 407. This section presents the sensorized platform used to be integrated in. 408. a smart cities context. As commented in the above sections, the platform. 409. Sense Our Environment (SEnviro) [12] follows the IoT and Web of Things. 410. (WoT) [50] paradigms by means of a low-cost, open-hardware and open-. 411. software, energetically autonomous and interoperable solution. Each node of. 412. the SEnviro platform is called SEnviro Thing. The SEnviro platform uses. 413. the IP protocol to establish the connection. With these features, it can be. 414. considered that each SEnviro Thing is a smart object. A network is formed. 415. by joining several SEnviro Things. This platform makes use of standards. 416. when publishing data. This guarantees the interoperability of the services. 417. provided by the platform.. 418. If we analyse SEnviro from a GIS context and specify what is happening. 419. in each of its layers, we obtain the Figure 6, which we are going to detail. 420. below. In the content layer there are different SEnviro Things that cover. 421. the area so that the sensors can measure the phenomena in each sensorized. 422. platform. When a SEnviro Thing gets a new observation, it invokes the. 423. Sensor Data Management (SDM) module. This component is implemented. 424. using a RestFul web service.. 425. The SDM module is responsible for publishing observations in different 20.
(21) 426. services that we want to offer, such as SensorThing API, SOS or others.. 427. Thus, it offers the same content using different interface; depending on the. 428. context. Thus, different adapters for each of these services are offered.. 429. Thereby, we are able to offer the same content using a different interface. 430. and these interfaces will be used depending on the appropriate context. Dif-. 431. ferent adapters for each of these services are offered. If we want to support. 432. new services/standards, we should only add a new adapter for the service.. 433. We use the adapter software pattern to implement this feature.. 434. The service layer, offers the services described above. One of the objec-. 435. tives of the SEnviro platform is to offer a standard service, in order to provide. 436. connectivity in an interoperable way. To meet this challenge, a candidate. 437. OGC standard, SensorThings API, has been used to offer an interoperable. 438. service to access the SEnviro platform. The most remarkable thing about. 439. this standard is that it breaks away from all “standard topics” [51] and offers. 440. access to restrictive devices, such as smartphones. Also, we offer a SOS in-. 441. terface to increase the interoperability, because this standard is widely used. 442. [52]. Finally, a Lightweight RestFul service is created to connect this service. 443. in a more agile way[53] and will be used to integrate SEnviro and Smar-. 444. tUJI platforms. The next section will present the different technologies and. 445. details.. 446. The last layer, application, is for the different clients, mobile, web-based. 447. and/or desktop. As a first proof of concept, we have included environmental. 448. sensors [12], such as temperature, humidity and CO2, among others (Figure. 449. 7) to the SEnviro platform.. 450. 21.
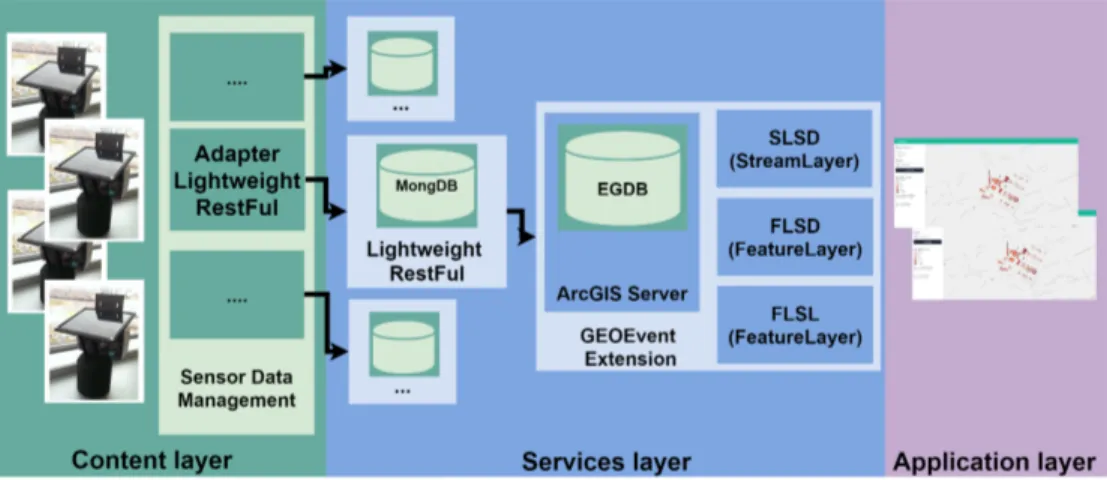
(22) 451. 5. Integration of SEnviro in SmartUJI. 452. This section details how we have deployed the sensorized platform in a. 453. smart city context. The last two sections have detailed both SEnviro and. 454. SmartUJI, subsequently, we present all steps defined to integrate both plat-. 455. forms. As we commented above, we have built five SEnviro Things to moni-. 456. tor environmental phenomena. They are installed around the campus. Each. 457. SEnviro Thing takes measurements on the different phenomena depending. 458. on the sensors installed in it. As detailed in Section 3, SmartUJI uses ESRI. 459. software for its deployment. This situation proposes a challenge, because we. 460. want to integrate an open sensorized platform in a proprietary solution. To. 461. address the integration of SEnviro Things of the smart campus, GEOEvent. 462. extension for ArcGIS Server is used. We will talk about this in the next. 463. sections. Also, the next subsection details the way to integrate all SEnviro. 464. Things. The first subsection presents the architectural overview. The second. 465. subsection details how we use GEOEvent. The last subsection provides an in. 466. depth explanation of the visualization client; it has been developed to show. 467. the data provided by SEnviro Things in the SmartUJI context.. 468. 5.1. Architecture overview. 469. To get a general overview, Figure 8 shows the scheme of the complete. 470. infrastructure with all of the system‘s components and describes each of. 471. them in different layers. In the first step, SEnviro Thing nodes are resided,. 472. it is built with an Arduino micro-controller as SEnviro Core. Each sensorized. 473. platform offers Wi-Fi connection to send the measured observations. We have. 474. selected this type of connectivity due to the ubiquitousness of official WI-Fi. 22.
(23) 475. connection throughout the university campus.. 476. Each Senviro Thing is able to adapt to its behaviour, updating the in-. 477. formation about which sensor is active and the frequency at which measure-. 478. ments are taken (as detailed in Section 4). At regular intervals, the platform. 479. requests a new behaviour to a server using a RestFul service. Then, the SEn-. 480. viro Thing will get a new behaviour following the new configuration received.. 481. The sensorized platform sends the observations to a server. To offer this in-. 482. tegration a sensor collector service has been created. Different operations. 483. are available to collect the observations measured. When one SEnviro Thing. 484. catches a new observation it invokes these operations to send data to the. 485. server using SDM module. When the SDM receives a new observation, it con-. 486. nects with the different adapters to send the data for each service available.. 487. To accomplish this objective, we have followed our previous work [53, 12] to. 488. connect with different OGC instances, such as SOS and candidate standard. 489. SensorThing API. Also, we provide a lighter solution for data sensors access. 490. using RestFul interface used in [53]. To offer all these interfaces, we provide. 491. different adapters to publish the sensor data in different service instances. 492. or databases. To offer a SensorThing interface, we use an external server. 493. to test this API, which is offered by the SensorThings API. For SOS, the. 494. 52North SOS 4.x implementation (which implements the SOS 2.0 interface. 495. standard) is used. In this case, the server is deployed using an Apache Tom-. 496. cat server and sensor data are stored in a PostgreSQL/PostGIS database13. 497. following the documented standard installation routines. Finally, for the last 13. See http://postgis.net/ (last accessed: November, 2015). 23.
(24) 498. interface, a Lightweight RestFul service is implemented using JAX-RS14 and. 499. Jersey15 and one MongoDB database16 is used to store the observations. As. 500. announced above, to integrate the sensor data from SEnviro Things in the. 501. SmartUJI, we use GEOEvent extension. In order to provide the sensor data. 502. from the SEnviro platform, GEOEvent connects to the Lightweight RestFul. 503. service using polling techniques. GEOEvent has three layers with the sensor. 504. data as an output. These layers are offered using publish/subscribe connec-. 505. tion and this kind of layer is based on ESRI features in the JSON encoding. 506. 17. . In the next section (Section 5.2), we will detail the GEOEvent usage in. 507. depth. The last step, is its integration in the smart campus. As commented. 508. above, the smart campus is a modular, extensible cartography-based plat-. 509. form to store, access and manage all the data, resources, common services. 510. and functionalities required to build a wide range of applications in a smart. 511. campus context.. 512. 5.2. GEOEvent, as a connector between IoT and smart cities. 513. As we commented, one of the most important challenges of the present. 514. work was to integrate an open sensorized platform in smart city development. 515. using proprietary software. For this we have chosen to use an extension for. 516. ArcGIS server called GeoEvent. GeoEvent is a tool developed by ESRI that. 517. enables processing real-time data. This tool can connect to many types of. 518. streaming data feeds as inputs and apply different processes over the pro14. See See 16 See 17 See 15. http://jax-rs-spec.java.net/ (last accessed: November, 2015) https://jersey.java.net/ (last accessed: November, 2015) https://www.mongodb.org/ (last accessed: November, 2015) http://www.json.org/ (last accessed: November, 2015). 24.
(25) 519. vided data. These processes can generate alarms or results as output. For. 520. instance a GIS layer can be updated, an alarm can be launched when certain. 521. events occur or the process results can be served using RestFul or real-time. 522. interfaces, like websockets. 523. data between SEnviro and SmartUJI platforms. In our work, GEOEvent. 524. connects with the lightweight RestFul service (detailed in the Section 4) to. 525. adapt the connection between SEnviro and SmartUJI and retrieves the last. 526. observations encoded as JSON. This integration permits using the data pro-. 527. vided by the sensorized platform easily. To achieve this, we have configured. 528. this connection and a refresh has been applied to obtain the observation in. 529. the same frequency that each SEnviro Thing produces as a new observation.. 530. Whenever GEOEvent receives a new observation, it automatically updates. 531. two layers provided as outputs. Figure 9 resumes all the steps followed to. 532. connect with GEOEvent.. 18. . This ArcGIS extension helps us to integrate. 533. The GEOEvent process has three different GIS layers as an output. The. 534. first layer is a FeatureLayer type, we will call this layer as FeatureLayerSen-. 535. sorData (FLSD). This layer will be used to offer both historical and current. 536. observations. The second layer, called StreamLayerSensorData (SLSD), fol-. 537. lows the type StreamLayer and will be used to publish the latest observations. 538. in real-time. These two layers are used to only get observation values. Fi-. 539. nally, another FeatureLayer, FeatureLayerSensorLocation (FLSL), provides. 540. the sensor locations. This layer is static and is not updated each time. The. 541. StreamLayer extends the FeatureLayer in order to connect to a stream of data 18. See https://www.websocket.org/ (last accessed: November, 2015). 25.
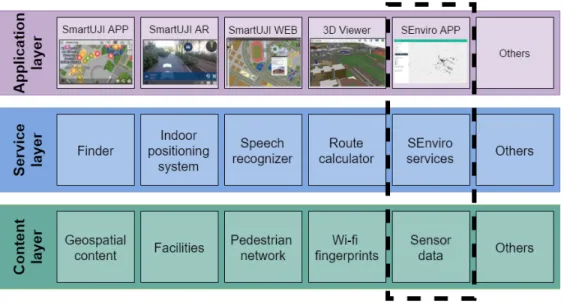
(26) 542. using WebSockets. StreamLayer connects to a server that emits geographic. 543. features continuously. While the FeatureLayer is used to map relatively. 544. static data, the stream layer is suitable when you would like to map dynamic. 545. streams of data that are unbounded and continuous. When a stream layer is. 546. added to a map, users are able to see any real-time updates pushed out by. 547. the server.. 548. The StreamLayer offers some advantages with respect to the Feature-. 549. Layer. It is more responsive, because features appear on the map right away.. 550. Also, the messages are sent without extra headers, so it is a more efficient. 551. transfer of data. StreamLayer offers better performance than FeatureLayer,. 552. because websocket connections “can provide a 500:1 or depending on the size. 553. of the HTTP headers even a 1000:1 reduction in unnecessary HTTP header. 554. traffic and 3:1 reduction in latency”. 555. backed by an Enterprise Geodatabase (EGDB) offered through one ArcGIS. 556. Server instance. These three layers will be used to visualize the sensor data. 557. on a web-map or similar.. 558. 5.3. SEnviro APP. 19. . All the defined layers are stored and. 559. To complete the SEnviro Thing integration, we have proposed a new. 560. SmartUJI application to access sensor data provided by each SEnviro Thing.. 561. The Figure 10 represents all applications that make up the current smart. 562. campus and SEnviro APP. The SEnviro APP is a web-application in charge. 563. of integrating the sensor data with the existing smart campus infrastructure. 564. using the layers provided by the SmartUJI Core. The web is the perfect 19. See http://www.websocket.org/quantum.html (last accessed: November, 2015). 26.
(27) 565. environment for this kind of applications because it is one of the most ac-. 566. cessible platforms [54]. In this way, our prototype can be tested on every. 567. platform that supports one of the major browsers available (for example,. 568. Mozilla Firefox, Google Chrome or derivatives). Our solution for SmartUJI. 569. is built following the concept of reusable Software [55]. In this way, it is easy. 570. for us to create new prototypes for testing new features.. 571. ESRI provides the ArcGIS Javascript API for accessing ESRI services. 572. and for creating geo-web applications. Our application is based on this tech-. 573. nology. Figure 11 shows a screen-shot about SEnviro APP.. 574. The main objective of this web-application is to connect to the different. 575. layers provided by the ArcGIS server. The web-application has two main. 576. functionalities, one of them is offering the real-time data provided by the. 577. SEnviro Things. The other is to relate these data the campus buildings and. 578. visualizing them.. 579. To achieve this, SEnviro APP subscribes to the StreamLayer in order. 580. to retrieve the last observations measured. To get historical sensor data,. 581. SEnviro APP it requests all previous observations from the FLSD. Sensor. 582. locations are obtained from the FLSD.. 583. The StreamLayer with the sensor data carries the sensors values and the. 584. identifier of the building where the sensor is located. This information is used. 585. to relate sensor data with the buildings FeatureLayer. A custom Renderer. 586. for the buildings FeatureLayer is used to show the data over the buildings. In. 587. this way, we can implement a Renderer depending on the type of sensors we. 588. are dealing with. Also, it is possible to adjust the behaviour of the Renderer. 589. based on the maximum and minimum value of the received data.. 27.
(28) 590. The ArcGIS Javascript API has proven to be flexible enough to provide. 591. the ability to dynamically change the Renderer of a specific Layer. The user. 592. can select and filter sensor data using a very simple form (located on the left. 593. of the application) and the map loads the sensor’s data and sets the correct. 594. Renderer on the FeatureLayer. For this example, each Renderer is preloaded. 595. into a RendererFactory module. In this prototype application, three types of. 596. renders are available, to support the sensors: light, temperature and humid-. 597. ity, because these are presented in all SEnviro Things. Our system gathers. 598. data from many sensors distributed over the campus, but this particular. 599. prototype covers only a small subset of them.. 600. The representation is done extending the ClassBreaksRenderer provided. 601. by the ArcGIS Javascript API. This Render uses some threshold values to. 602. define the number of classes the data are divided into. Afterwards, a special. 603. symbol is selected for each class. In our prototype, the data are divided. 604. into five classes and the values are assigned to: Very Low, Low, Medium,. 605. High and Very High (following some defined thresholds). Figure 12 shows. 606. the visualization of each sensor that the application currently provides.. 607. SEnviro APP is dynamically updated with the latest observations using. 608. SLSD. The FLSD is used when we select a prior date. FLSL is retrieved in. 609. order to know the geospatial position of each sensorized platform.. 610. Furthermore, the application is built using the Mobile-first approach. In. 611. this way, it can be easily tested on a mobile device. The purpose of this. 612. requirement is to show how map-based web application can be implemented. 613. to be available in mobile devices. Currently, we are performing usability tests. 614. to establish if the application is truly accessible on tablets or smartphones.. 28.
(29) 615. Early considerations suggest that a tablet is the preferred mobile device for. 616. accessing these kinds of applications. This is mainly because the screen is. 617. big enough to show the information on the map at a good scale.. 618. 6. Conclusions. 619. We have presented a comprehensive solution to provide IoT devices built. 620. with open hardware to the cities of the 21st century. Current cities need these. 621. devices in order to know the current state of the city as well as the planning. 622. decisions to improve the quality of life of citizens. The proposed solution. 623. can measure meteorological and air quality parameters; these phenomena. 624. are very useful for decision makers in order to make decisions. Some of these. 625. phenomena can be used to determine important indicators. For example,. 626. high temperatures can be an indicator of increased electricity consumption.. 627. Also, air quality phenomena can be used to analyze traffic conditions or. 628. other aspects that have an impact on the atmosphere. To our knowledge. 629. only two approaches offer a real-time connection (see Section 2.5), includ-. 630. ing ours. The current city necessities have to know what is happening at the. 631. same moment that it is occurring, for this reason is crucial to offer a real-time. 632. communication.Real-time is one of the key features, as there are many situ-. 633. ations that require obtaining the data as soon as these have been produced.. 634. For example, observations of environmental conditions have to be made as. 635. soon as possible to determine any action plan. Other examples could be,. 636. the observations of movement of vehicles around a transport network, where. 637. data from a network of cameras to be transferred in real time to a central. 638. control center to monitor traffic flow and adjust sequences traffic lights and 29.
(30) 639. speed limits and automatically administer the penalties for traffic violations.. 640. The third point, faced by the use of open-hardware, and explained in. 641. our work can be used to guide developers and policy makers to provide a. 642. comprehensive solution for the adaptation of a sensorized platform created. 643. with open-hardware within a smart city context. This is taken as a sensorized. 644. platform development using hardware and open software, called SEnviro [12].. 645. SEnviro is integrated within a proposed smart city for a university campus,. 646. called SmartUJI [13].. 647. The open hardware components usage allows that our approach can be. 648. used not only by developers, it can be used by city decision makers and. 649. citizens. The citizens can form part of the sensor network following the. 650. ‘crowdsourcing’ or ‘participatory sensing’ [56]. They can build new SEnviro. 651. devices and the data provided by these devices can be analyzed in order to. 652. make decisions. In this way, citizens can participate as input for governments.. 653. The current cities need has led to the evolution of the traditional WSNs. 654. to “smart networks”, permanently connected to the Internet (IoT), offering. 655. the possibility to know what is happening at every moment. This term has. 656. become very popular in the media and business realms. Therefore, it has. 657. triggered many business models, with closed solutions (proprietary imple-. 658. mentation) for monitoring and controlling different city environments. These. 659. solutions have the disadvantage of not being able to be used openly and not. 660. having total control over them [57]. As such, another movement has emerged. 661. to solve this problem; it is the open-hardware movement. Some studies have. 662. demonstrated that open-hardware projects are equally as valid as propri-. 663. etary solutions [21], in addition open-hardware solutions are much cheaper. 30.
(31) 664. than the proprietary ones [58]. If we see the features and greater advantages. 665. that open hardware solutions offer over proprietary ones, then we can observe. 666. how open source devices could be a possible solution for the implementations. 667. of the IoT.. 668. Finally, the last goal of our work is the integration between the sensorized. 669. platform within the platform of a smart campus following the paradigms of. 670. CC and M2M. In this integration, GIScience takes importance since it offers. 671. different standards to interconnect the “smart things” in an interoperable. 672. and scalable way. For this reason, GIScience becomes a good candidate to. 673. use in the future development of smart cities. Also, the methodology defined. 674. a possible way to connect an open platform within a platform of smart city. 675. using proprietary source software. It has been reached successfully, so it. 676. guarantees the scalability and interoperability of the SmartUJI.. 677. As future work, increased deployment of sensors is proposed to improve. 678. the granularity of the web-maps obtained and increase their quality. The. 679. generalization of the adaptation of SEnviro platform that can be deployed in. 680. other developments of different smart cities is also contemplated. Another. 681. open issue is to analyze the quality of the data provided by the sensors and. 682. make different comparative between SEnviro sensors and professional sensor. 683. stations. Finally, another future line that we pursue is the real-time analysis,. 684. in order to detect anomalies over the data obtained from sensors for decision-. 685. making [59].. 686. [1] G. K. Heilig, World urbanization prospects: the 2011 revision, United. 687. Nations, Department of Economic and Social Affairs (DESA), Popula-. 31.
(32) 688. tion Division, Population Estimates and Projections Section, New York. 689. (2012).. 690. [2] D. Satterthwaite, Cities’ contribution to global warming: notes on the. 691. allocation of greenhouse gas emissions, Environment and urbanization. 692. 20 (2008) 539–549.. 693. [3] R. Moss Kanter, S. S. Litow, Informed and interconnected: A manifesto. 694. for smarter cities, Harvard Business School General Management Unit. 695. Working Paper (2009).. 696. [4] D. INFSO, Networked enterprise & rfid infso g. 2 micro & nanosystems,. 697. in co-operation with the working group rfid of the etp eposs, internet. 698. of things in 2020, roadmap for the future [r], Information Society and. 699. Media, Tech. Rep (2008).. 700. [5] A. Kramers, M. Höjer, N. Lövehagen, J. Wangel, Smart sustainable. 701. cities–exploring ict solutions for reduced energy use in cities, Environ-. 702. mental Modelling & Software 56 (2014) 52–62.. 703. [6] R. Giffinger, C. Fertner, H. Kramar, R. Kalasek, N. Pichler-Milanovic,. 704. E. Meijers, Smart cities-Ranking of European medium-sized cities, Tech-. 705. nical Report, Vienna University of Technology, 2007.. 706. [7] D. Uckelmann, M. Harrison, F. Michahelles, An architectural approach. 707. towards the future internet of things, in: Architecting the internet of. 708. things, Springer, 2011, pp. 1–24.. 709. [8] J. Gubbi, R. Buyya, S. Marusic, M. Palaniswami, Internet of things 32.
(33) 710. (iot): A vision, architectural elements, and future directions, Future. 711. Generation Computer Systems 29 (2013) 1645–1660.. 712. [9] S. Dirks, M. Keeling, J. Dencik, Ibm how smart is your city? helping. 713. cities measure progress, Global Business Services Government Executive. 714. Report IBM Institute for Business Value Copyright IBM Corporation. 715. (2009).. 716. [10] K. Crowston, K. Wei, J. Howison, A. Wiggins, Free/libre open-source. 717. software development: What we know and what we do not know, ACM. 718. Computing Surveys (CSUR) 44 (2012) 7.. 719. 720. [11] Official arduino website, http://www.arduino.cc, ???? Accessed: 201411-3.. 721. [12] S. Trilles, A. Luján, Ó. Belmonte, R. Montoliu, J. Torres-Sospedra,. 722. J. Huerta, Senviro: A sensorized platform proposal using open hardware. 723. and open standards, Sensors 15 (2015) 5555–5582.. 724. [13] J. Huerta, Smartuji: Integrating information, services, and participa-. 725. tion, Technical Report, Specialist Meeting Advancing the Spatially En-. 726. abled Smart Campus, 2013.. 727. [14] P. Bellavista, G. Cardone, A. Corradi, L. Foschini, Convergence of. 728. manet and wsn in iot urban scenarios, IEEE Sensors Journal 13 (2013). 729. 3558–3567.. 730. [15] N. Walravens, P. Ballon, Platform business models for smart cities: from. 731. control and value to governance and public value, IEEE Communica-. 732. tions Magazine 51 (2013) 72–79. 33.
(34) 733. [16] C. Manville, G. Cochrane, J. Cave, J. Millard, J. K. Pederson, R. K.. 734. Thaarup, A. Liebe, M. Wissner, R. Massink, B. Kotterink, Mapping. 735. smart cities in the eu (2014).. 736. [17] P. Rashidi, D. J. Cook, L. B. Holder, M. Schmitter-Edgecombe, Dis-. 737. covering activities to recognize and track in a smart environment, IEEE. 738. transactions on knowledge and data engineering 23 (2011) 527–539.. 739. [18] D. J. Cook, M. Youngblood, S. K. Das, A multi-agent approach to. 740. controlling a smart environment, in: Designing smart homes, Springer,. 741. 2006, pp. 165–182.. 742. [19] M. Zhang, A. Ishii, N. Nishiyama, S. Matsumoto, T. Ishii, Y. Yamasaki,. 743. K. Kataoka, Pegylated calcium phosphate nanocomposites as smart. 744. environment-sensitive carriers for sirna delivery, Advanced Materials 21. 745. (2009) 3520–3525.. 746. [20] V. R. Jakkula, D. J. Cook, Using temporal relations in smart environ-. 747. ment data for activity prediction, in: Proceedings of the 24th Interna-. 748. tional conference on machine learning, pp. 20–24.. 749. [21] R. Fisher, L. Ledwaba, G. Hancke, C. Kruger, Open hardware: a role. 750. to play in wireless sensor networks?, Sensors 15 (2015) 6818–6844.. 751. [22] V. M. Rohokale, N. R. Prasad, R. Prasad, A cooperative internet of. 752. things (iot) for rural healthcare monitoring and control,. 753. less Communication, Vehicular Technology, Information Theory and. 754. Aerospace & Electronic Systems Technology (Wireless VITAE), 2011. 755. 2nd International Conference on, IEEE, pp. 1–6. 34. in: Wire-.
(35) 756. [23] C. Doukas, I. Maglogiannis, Bringing iot and cloud computing towards. 757. pervasive healthcare, in: Innovative Mobile and Internet Services in. 758. Ubiquitous Computing (IMIS), 2012 Sixth International Conference on,. 759. IEEE, pp. 922–926.. 760. [24] S. Amendola, R. Lodato, S. Manzari, C. Occhiuzzi, G. Marrocco, Rfid. 761. technology for iot-based personal healthcare in smart spaces, Internet. 762. of Things Journal, IEEE 1 (2014) 144–152.. 763. [25] M. Schneps-Schneppe, D. Namiot, A. Maximenko, D. Malov, Wired. 764. smart home: energy metering, security, and emergency issues, in: Ul-. 765. tra Modern Telecommunications and Control Systems and Workshops. 766. (ICUMT), 2012 4th International Congress on, IEEE, pp. 405–410.. 767. [26] X. Li, R. Lu, X. Liang, X. Shen, J. Chen, X. Lin, Smart community:. 768. an internet of things application, Communications Magazine, IEEE 49. 769. (2011) 68–75.. 770. [27] N. Kumar, J.-H. Lee, J. J. Rodrigues, Intelligent mobile video surveil-. 771. lance system as a bayesian coalition game in vehicular sensor networks:. 772. learning automata approach (2014).. 773. [28] P. Hank, S. Müller, O. Vermesan, J. Van Den Keybus, Automotive. 774. ethernet: in-vehicle networking and smart mobility, in: Proceedings. 775. of the Conference on Design, Automation and Test in Europe, EDA. 776. Consortium, pp. 1735–1739.. 777. [29] A. Somov, C. Dupont, R. Giaffreda, Supporting smart-city mobility with. 35.
(36) 778. cognitive internet of things, in: Future Network and Mobile Summit. 779. (FutureNetworkSummit), 2013, IEEE, pp. 1–10.. 780. [30] A. Botta, W. de Donato, V. Persico, A. Pescapé, On the integration of. 781. cloud computing and internet of things, in: Future Internet of Things. 782. and Cloud (FiCloud), 2014 International Conference on, IEEE, pp. 23–. 783. 30.. 784. [31] A. Weiss, Computing in the clouds, Computing 16 (2007).. 785. [32] X. Fang, S. Misra, G. Xue, D. Yang, Managing smart grid information. 786. in the cloud: opportunities, model, and applications, IEEE network 26. 787. (2012) 32–38.. 788. [33] M. Naphade, G. Banavar, C. Harrison, J. Paraszczak, R. Morris,. 789. Smarter cities and their innovation challenges, Computer 44 (2011). 790. 32–39.. 791. [34] S. K. Dash, S. Mohapatra, P. K. Pattnaik, A survey on applications of. 792. wireless sensor network using cloud computing, International Journal. 793. of Computer science & Engineering Technologies (E-ISSN: 2044-6004) 1. 794. (2010) 50–55.. 795. [35] G. C. Fox, S. Kamburugamuve, R. D. Hartman, Architecture and mea-. 796. sured characteristics of a cloud based internet of things, in: Collabo-. 797. ration Technologies and Systems (CTS), 2012 International Conference. 798. on, IEEE, pp. 6–12.. 36.
(37) 799. [36] C. Potter, G. P. Hancke, B. Silva, Machine-to-machine: Possible appli-. 800. cations in industrial networks, in: Industrial Technology (ICIT), 2013. 801. IEEE International Conference on, IEEE, pp. 1321–1326.. 802. 803. [37] K. C. Clarke, Getting started with geographic information systems, volume 3, Prentice Hall Upper Saddle River, NJ, 1997.. 804. [38] J. J. Rodrigues, P. A. Neves, A survey on ip-based wireless sensor. 805. network solutions, International Journal of Communication Systems 23. 806. (2010) 963–981.. 807. [39] J. Galache, J. R. Santana, V. Gutiérrez, L. Sánchez, P. Sotres, L. Muñoz,. 808. et al., Towards experimentation-service duality within a smart city sce-. 809. nario, in: Wireless On-demand Network Systems and Services (WONS),. 810. 2012 9th Annual Conference on, IEEE, pp. 175–181.. 811. [40] G. Merlino, D. Bruneo, S. Distefano, F. Longo, A. Puliafito,. 812. Stack4things: integrating iot with openstack in a smart city context,. 813. in: Smart Computing Workshops (SMARTCOMP Workshops), 2014. 814. International Conference on, IEEE, pp. 21–28.. 815. [41] M. Faisal, S. Bakar, P. Rudati, The development of a data acqusition. 816. system based on internet of things framework, in: ICT For Smart Society. 817. (ICISS), 2014 International Conference on, IEEE, pp. 211–216.. 818. [42] Á. Asensio, T. Blanco, R. Blasco, Á. Marco, R. Casas, Managing emer-. 819. gency situations in the smart city: The smart signal, Sensors 15 (2015). 820. 14370–14396.. 37.
(38) 821. [43] R. Jalali, K. El-khatib, C. McGregor, Smart city architecture for com-. 822. munity level services through the internet of things, in: Intelligence in. 823. Next Generation Networks (ICIN), 2015 18th International Conference. 824. on, IEEE, pp. 108–113.. 825. 826. [44] A. Zanella, M. Zorzi, Applying internet of things paradigm to smart city: communication model and experimentation, E-LETTER (2014).. 827. [45] B. Pokric, S. Krco, D. Drajic, M. Pokric, I. Jokic, M. J. Stojanovic,. 828. ekonet-environmental monitoring using low-cost sensors for detecting. 829. gases, particulate matter, and meteorological parameters, in: Innovative. 830. Mobile and Internet Services in Ubiquitous Computing (IMIS), 2014. 831. Eighth International Conference on, IEEE, pp. 421–426.. 832. [46] J. Torres-Sospedra, J. Avariento, D. Rambla, R. Montoliu, S. Casteleyn,. 833. M. Benedito-Bordonau, M. Gould, J. Huerta, Enhancing integrated. 834. indoor/outdoor mobility in a smart campus, International Journal of. 835. Geographical Information Science (2015) 1–14.. 836. [47] Y.-S. Chang, H.-D. Park, Xml web service-based development model. 837. for internet gis applications, International Journal of Geographical In-. 838. formation Science 20 (2006) 371–399.. 839. 840. [48] I. Masser, GIS worlds: creating spatial data infrastructures, volume 338, ESRI press Redlands, CA, 2005.. 841. [49] J. Torres-Sospedra, R. Montoliu, S. Trilles, Ó. Belmonte, J. Huerta,. 842. Comprehensive analysis of distance and similarity measures for wi-fi. 38.
(39) 843. fingerprinting indoor positioning systems, Expert Systems with Appli-. 844. cations 42 (2015) 9263–9278.. 845. [50] D. Guinard, V. Trifa, T. Pham, O. Liechti, Towards physical mashups. 846. in the web of things, in: Networked Sensing Systems (INSS), 2009 Sixth. 847. International Conference on, IEEE, pp. 1–4.. 848. [51] A. Tamayo, P. Viciano, C. Granell, J. Huerta, Empirical study of sen-. 849. sor observation services server instances, in: Advancing geoinformation. 850. science for a changing world, Springer, 2011, pp. 185–209.. 851. [52] M. Botts, G. Percivall, C. Reed, J. Davidson, Ogc R sensor web enable-. 852. ment: Overview and high level architecture, in: GeoSensor networks,. 853. Springer, 2008, pp. 175–190.. 854. [53] S. Trilles, O. Belmonte, L. Diaz, J. Huerta, Mobile access to sensor. 855. networks by using gis standards and restful services, Sensors Journal,. 856. IEEE 14 (2014) 4143–4153.. 857. 858. [54] T. Berners-Lee, Www: past, present, and future, Computer 29 (1996) 69–77.. 859. [55] A. Jatain, T. Chawla, Architecture for developing reusable components. 860. for gis systems, in: Issues and Challenges in Intelligent Computing. 861. Techniques (ICICT), 2014 International Conference on, pp. 482–485.. 862. [56] J. A. Burke, D. Estrin, M. Hansen, A. Parker, N. Ramanathan, S. Reddy,. 863. M. B. Srivastava, Participatory sensing, Center for Embedded Network. 864. Sensing (2006). 39.
(40) 865. [57] S. Shrestha, J. Moore, J. A. Nocera, Open-source platform: exploring. 866. the opportunities for offline mobile learning, in: Proceedings of the 13th. 867. International Conference on Human Computer Interaction with Mobile. 868. Devices and Services, ACM, pp. 653–658.. 869. [58] A. Powell, Democratizing production through open source knowledge:. 870. from open software to open hardware, Media, Culture & Society 34. 871. (2012) 691–708.. 872. [59] S. Trilles, S. Schade, Ó. Belmonte, J. Huerta, Real-time anomaly de-. 873. tection from environmental data streams, in: AGILE 2015, Springer. 874. International Publishing, 2015, pp. 125–144.. 40.
(41) 875. List of figures. Figure 1: Representation of the cycle provided by IoT and IT, that it is divided between the physical and cyber world.. 41.
(42) Figure 2: Screen-shot about the SmartUJI web.. 42.
(43) Figure 3: Typical SDI three layers architecture applied in SmartUJI.. 43.
(44) Figure 4: Two screen-shots about the SmartUJI APP (a) and SmartUJI AR (b).. 44.
(45) Figure 5: SEnviro Thing parts.. 45.
(46) Figure 6: General overview about the SEnviro work-flow following three layers architecture.. 46.
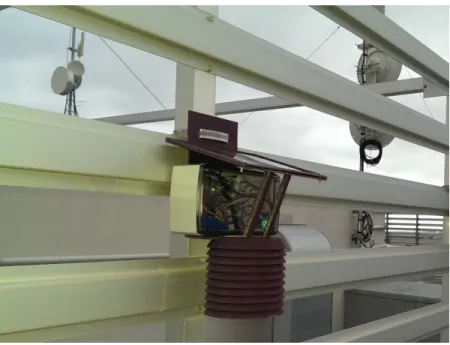
(47) Figure 7: Example of SEnviro Thing installed in Espaitec 2 building.. 47.
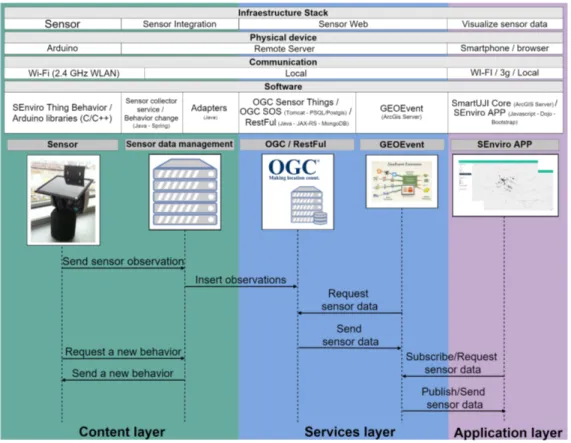
(48) Figure 8: Sequence diagram of the processing of an exemplary usage of the system (lower half). The upper half gives information about the realization of the different components of the infrastructure.. 48.
(49) Figure 9: General overview about the integration between SEnviro and SmartUJI using GEOEvent following three layers architecture.. 49.
(50) Figure 10: Proposed extended SmartUJI architecture to add SEnviro platform.. 50.
(51) Figure 11: Screen-shot of the application developed that use SmartUJI services to visualize the data provide by the SEnviro Thing.. 51.
(52) Figure 12: SEnviro Application Sensors visualization. It shows some of the sensors the application currently supports a) Humidity b) Light and c) Temperature.. 52.
(53)
Figure
+7
Documento similar
On the other hand, the Open Cities project, designed to test the open innovation methodologies in Smart Cities services , has also experimented extensively with the possibility
The faculty may have uploaded some file with the complete timetable by subjects.. 7) Scroll down and click on the academic course. You will find all the classes grouped by
In the preparation of this report, the Venice Commission has relied on the comments of its rapporteurs; its recently adopted Report on Respect for Democracy, Human Rights and the Rule
An Internet of Things and Fuzzy Markup Language Based Approach to Prevent the Risk of Falling Object Accidents in the Execution Phase of Construction Projects.. Sensors 2021,
This provides solid arguments for the impressive performance of LoRa and other Long- Range technologies in a wide range of environments (like cities, industries and smart grids)..
We analysed three key parameters for the Smart City, the convergence time of a network, the number of messages necessary to connect a node to the network (control overhead) and
Method: This article aims to bring some order to the polysemy and synonymy of the terms that are often used in the production of graphic representations and to
Document management - a key technology for the construction industry, In: Information and Communications Technology (ICT) in the Practice of Building and Civil
