LA. Karimi and Rajagopalan Srinivasan (Editors), Proceedings of the 11th International Symposium on Process Systems Engineering, 15-19 July 2012, Singapore.
Information integration: From P&I diagrams to
functional models
Manuel Rodríguez , José L. De la Mata , M. Eugenia Alvarez
Abstract
Information integration is a very important topic. Reusing the knowledge and having common and exchangeable representations have been an active research topic in process systems engineering. In this paper we deal with information integration in two different ways, the first one sharing knowledge between different heterogeneous applications and the second one integrating two different (but complementary) types of knowledge: functional and structural. A new architecture to integrate these representation and use for several purposes is presented in this paper.
Keywords: Process representation, functional models, structural models.
1. Introduction
Information integration and exchange has been and still is a very important topic (see ISO standards like 10303-221, 231 or AP233). In the past decades ontologies have got an important role in information representation, some of them have been developed for process systems, as OntoCape (Morbach et al, 2007) and some neutral model formulations have also been presented (as CapeOpen). But these approaches deal only with structural models and with the problem of merging and using information from different software applications (Wiesner et al., 2011). In this paper we present an architecture to integrate the information coming from the structural and the functional views of a single system. The remaining of the paper is organised as follows, section 2 introduces the D-higraph functional modeling methodology, the third section presents the developed tool for the integrated use of structural and functional models, section four shows an application of the proposed architecture and finally section five presents the conclusions of this work.
2. D-higraph functional modeling methodology
This section briefly presents the D-higraph methodology. For further information and deeper understanding of the methodology, the reader is encouraged to have a look at De la Mata & Rodríguez (2010b).
2.1. D-higraph: Dualization of Higraphs
D-higraphs come from the dualization of Higraphs: blobs representing transitions and edges representing states. Disjoint blobs imply an AND relation, i.e., both transitions between states take place. Orthogonal blobs represent an OR relation, i.e., only one of the transitions takes place.
state 1
, Tuncuon ,
ACTOR
condition
state 2
*- mass edge
». energy edge
*• information edge
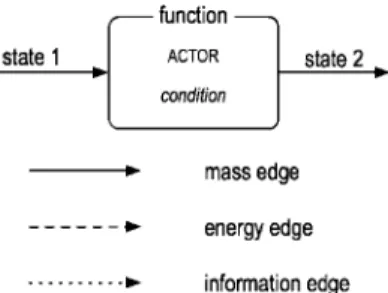
Figure 1. Basic blobs and types of edges 2.2. Main components
Blobs represent functions (transitions) and they include the ACTOR of the function and an optional condition for the transition to fire. As a result a new state is generated. The states are represented by edges coming in or out of a blob. Edges represent flows of mass, energy or information, which are responsible of all of the interactions in a process system (Lind, 1994). Mass, energy and information edges are depicted differently, as shown in the bottom of Fig. 1. However, the type of flow does not affect the behavior of the model, it is a visual aid to represent more information. An additional end of an edge is a hollow arrow which means that the state has influence on the blob pointed by the arrow (although the flow is in the opposite direction).
2.3. Properties
• Blob connection. An edge always links two blobs. Under certain conditions one of the blobs can not be represented (elliptic blob) but it exists.
• Blob inclusion. Blobs can be included inside of other blobs. This means that the inner blob performs a function that is necessary for the function of the outer blob. This is how hierarchical functions are represented and how structural and functional information is integrated.
• Partitioning blobs. A blob can be partitioned into orthogonal components, establishing an OR condition between the partitions.
The main objective of D-higraphs is not only the representation of knowledge about process systems. De la Mata & Rodríguez (2010a,b) provide a series of causation rules that allow to track the evolution and propagation of failures across the system. This rules combined with sensor data of the process enables the possibility of performing FDI analysis using D-higraphs models.
3. Information integration tool 3.1. P&I representation
3.2. D-h tool
The steady state model is automatically translated to a D-higraphs model, additional information regarding the functionality of the different units is provided to the API to perform the creation of the model. The developed tool, Alvarez (2010), allows a visual representation of the goals of the process.
3.3. CLIPS
The D-higraph representation is automatically translated to production (rule based) system (CLIPS, 2011) that will be used to conduct fault diagnosis and HAZOP analysis. 3.4. Architecture
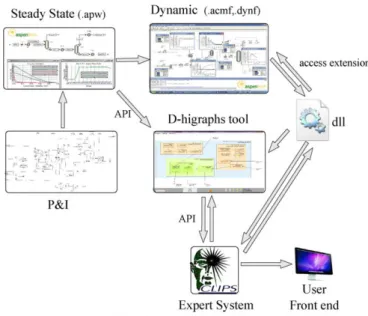
Figure 2 shows all the components of the architecture. The communication between the structural (dynamic) model and the functional one is through an access extension coded as a dll. This dll allows bidirectional communication between the simulation and the functional representation, allowing to study the effects of a fault on the whole process.
Steady State (.apw) Dynamic (.acmf,.dynf)
_ ^ _ . •¡paiiffiMJiffMii Hi'HFjrini'i-n'iam
-0^
t i l
-U : : ; - ' ^ aspen
P&I
access extension
TCLIRS] User Expert System Front end
Figure 2. Structural-functional information integration architecture
There are different uses of this environment from conventional simulation to fault diagnosis, sensor validation, control reconfiguration or HAZOP analysis.
4. Application
Amine gas treating is a process that uses an aqueous solution of an amine to remove H2S and C02 from gases. In this case we consider the treatment of an off-gas from a
secondary absorber of a FCC in an oil refinery using an aqueous solution of diethanolamine (DEA). In the absorber the DEA solution absorbs H2S and C02 from the
incoming off-gas producing a sweetened gas stream and a DEA solution rich in the absorbed acid gases. The sweet gas is sent to the high-pressure gas system of the refinery while the rich amine is routed to the regenerator.
The regenerator is a stripper with a reboiler where the rich amine desorbs H2S and C02
while the lean DEA is recycled to the absorber. A make-up DEA stream is needed to keep the amine inventory. The P&ID of the process is shown in Fig 3
Figure 3. Piping and instrument diagram of the amine gas treating process
For this P&I an steady state model as well as a dynamic model has been created. A functional model has also been generated using the D-higraph tool. Figure 4 shows the D-higraph of a small part of the process, the reflux section of the stripper and the dynamic model generated using Aspen Dynamics.
- provide reflux to the stripper — > REFLUX SECTION OF THE STRIPPER
keep reflux drum pressure — , REFLUX DRUM PRESSURE CONTROL LOOP
r
measure P —.. measured / — regulate — < .pressure SENSOR +\ CONTROLLER
J 111"» | J
3
i^aSasyaja ]jHjHffl
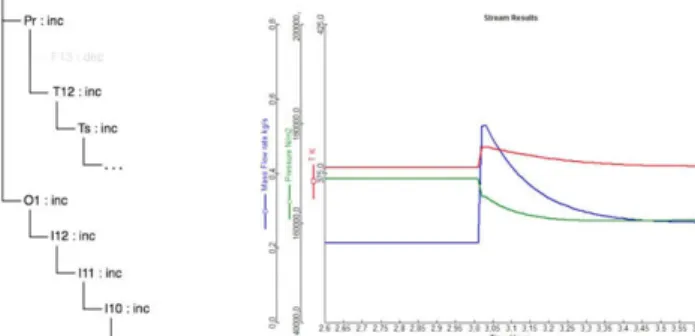
generated fault is produced in the pressure sensor. Figure 5 shows the set of possible causes (it produces as a possible cause the sensor fault 111 signal in the tree) and the simulated model used to validate and quantify the deviations provided by the functional model.
F13 : inc
— P r : inc — F13 :dec I — T 1 2 : i n c
I—Ts :inc
L...
I — 1 1 2 : ¡no I—111 :ino
I—110 : ¡nc
u.
Figure 5. Causal tree and dynamic simulation of the sensor fault
5. C o n c l u s i o n s
In this paper a new architecture to integrate structural as well as functional information has been presented. Functional models are represented using the D-higraphs formalism and its exploitation is made using a production system. Structural (steady state and dynamic) models are generated using the AspenTech software. Communication between both representations is made using a dll component which can control the simulation or generate events for the functional representation. This approach has been tested on an industrial process with satisfactory results. It can be used in many different ways as to validate and quantify functional models, to validate sensors and alarms or to provide control reconfiguration. Future research is being focused on automating all the procedure (including adding functional information directly on the Aspen models) and on testing and creating a procedure for automatic control reconfiguration.
References
Alvarez, M. E. (2010). Diagnosis de fallos en procesos químicos mediante modelos D-higraph.
Final Project, Department of Chemical Engineering, Technical University of Madrid.
CLIPS (2011). CLIPS, A Tool for Building Expert Systems. March, 13, 2011. http://clipsrules.sourceforge.net/
De la Mata, J. L., Rodríguez, M. (2010a). Abnormal Situation Diagnosis Using D-higraphs.
Computer Aided Process Engineering (ESCAPE 20), pp. 1477-1482.
De la Mata, J. L., Rodriguez, M. (2010b). D-higraphs. ASLab Report, http://www.aslab.org De la Mata, J. L., Rodríguez, M. (2011). Self-learning of fault diagnosis identification. Proc. of
the 21th European Symposium on Computer Aided Process Engineering (ESCAPE 21)., pp.
885-889
Harel, D. (1987). Statecharts: A Visual Formalism for Complex Systems. Sci. Comput. Program,
8 (3), pp. 231-274.
Lind, M. (1994). Modeling Goals and Functions of Complex Industrial Plant. Applied Artificial
Intelligence, 8 (2), pp. 259-283.
Morbach, J., Yang,A., Marquardt, W. (2007). OntoCAPE-A large-scale ontology for chemical process engineering. Engineering Applications of Artificial Intelligence, 20 (2), pp. 147-161. Rodriguez, M., Sanz, R. (2009). Development of Integrated Functional-Structural Models.
Computer Aided Process Engineering, 27, pp. 573-578.