city of Barcelona and the
evolution of the resources of
the Network of A
ttention to
Author:
Albert Sales i Campos (http://alberts
ales.wordpress.com)
Drafting committee:
Teresa Bermúdez, Carme Fortea, Ramón Noro, Andreu Parera, Albert S
abates, Laia Vila
Layout:
Elena Poncell i Garcia ([email protected])
Catalan to English translation:
Victoria Martín Santamarta
Acknowledgements:
To the professionals who, volunteering or s
alaried, devote their time and commitment to fighting
against poverty and providing attention to homeless people.
To the agents of the entities forming the XAP
SLL, who during the pre-publication discussions, by
using their daily experience, guided the t
ask of data interpretation.
To the SIS-Detection team of the B
arcelona City Council, for their day-to-day identification work.
To Albert Garcia, for being available to provide systematized S
IS data.
The Network of Attention to Homeless P
eople in Barcelona is conformed by:
ACCEM; Arrels Fundació; Associació Atra; Associació Raux
a; Associació per la reeducació i la reinserció social Lligam;
Associació Prohabitatge; Associació
Social Yaya Luisa; Asociación
de Alternativas, Motivación y Acompañamiento
(ADAMA);
Càritas Diocesana de Barcelona;
Centre d’Acollida Assís; Centre
Obert l’Heura; Companyia Filles
de la Caritat de Sant Vicenç
de Paül – Llar de Pau i Obra Social S
anta Lluïsa Marillach; Congregación Siervas de la Pasión; Comunit
at de Sant Egidi;
Cooperativa Suara; Creu Roja a B
arcelona; Fundació FIAS – Prisba Serveis; Fundació Engrunes; Fundació Futur; Fundació
IReS; Fundació Mambré; Fundació Maria Raventós; Fundació Quatre V
ents; Ordre Hospitalaria de Sant Joan de Déu- Serveis
Socials; Parròquia Sant Miquel del
Port- Santa Maria de Cervelló; Centre
Obert Heura; Dit i Fet; Amics
del Moviment Quart
Món Catalunya; Associació per a la promoció social C
EDRE; Associació per a la Recerca i l’
Acció Social Vincle; Fundació
Iniciatives Solidàries; Progess; Ajunt
Tables and
graphs
Introduction
8
1. Homelessness
12
2. Crisis
and homelessness
18
3. General
evolution
of housing
exclusion
in Barcelona
22
4. Homeless
people in
the city of
Barcelona
26
5. People
attended
in the housing
services and
night
shelters of
XAPSLL
32
6. XAPSLL
response:
Evolution
of resources
38
7. Policies
of intervention
and fighting
against
homelessness
42
Prevention:
measures
for avoiding
the loss of
housing
43
Strategies
at state-level
and country-level
44
Predict the
processes
of discharging
from institutions
44
Guarantee
the quality
of services
45
"Housing-led"
strategies
45
Knowledge
to act
46
Conclusions
48
Bibliography
CONTENTS
TablES aNd
Table 1.1.
Risk factors and triggering circum-stances of homelessnessTable 1.2.
ETHOS classificationTable 3.1.
Number of homeless people in the cityof Barcelona. ETHOS classification
Table 3.2.
Number of homeless people in the cityof Barcelona, 2008, 2011, 2013
Table 4.1.
Evolution of the number of peoplede-tected by the SIS-Detection team
Table 4.2.
Distribution of people contacted bySIS who were sleeping rough during March 2011, March 2012 and March 2013
Table 4.3.
People sleeping on the street alone orin group. Barcelona, by districts. March 2011, March 2013
Table 4.4.
Age of the people who were sleepingrough. Barcelona. March 2011, March 2013
Table 4.5.
Main problems (1) of the people whowere sleeping rough. Barcelona. March 2011, March 2013
Table 5.1.
People housed in homeless facilities.Barcelona, 2008-2013
Table 5.2.
Gender of the people housed inXAPSLL resources
Table 5.3.
Age of the people housed in homelessfacilities
Table 5.4.
Nationality of the people housed inhome-less facilities
Table 5.5.
People with certificate of disability inXAPSLL homeless facilities. November the 8th 2011, 12th March 2012, 12th March 2013
Table 5.6.
People with recognition of dependencygrade in XAPSLL homeless facilities. November 8th 2011, 12th March 2012, 12th March 2013.
Table 5.7.
Source of the income of people housedin XAPSLL services. 12th March 2012, 12th March 2013
Table 6.1.
Availability of places in the homelessfa-cilities. Barcelona, 2008-2011
Graphic 3.1.
Evolution of the number of homelesspeople in Barcelona. 2008, 2011, 2013
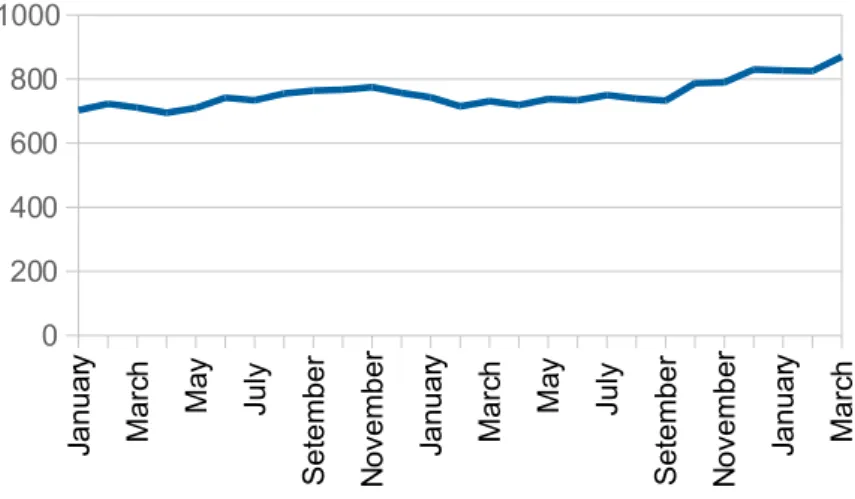
Graphic 4.1.
Evolution of the number ofdiffer-ent people contacted by SIS every month. January 2011-March 2013
Graphic 6.1
Evolution of the number of nightspro-vided in XAPSLL homeless facilities according to ownership. Barcelona, 2008, 2013
Graphic 6.2.
Evolution of the number of nightspro-vided in XAPSLL homeless facilities. Barcelona, 2008, 2013
Intro
-ductIon
The stereotyped image of a drifter
who lives on the street because of
his bad lifestyle, his addictions or his
unwillingness to work has little to
do with the diversity of profiles and
life journeys of the people sleeping
he stereotyped image of a drifter who lives on the street because of his bad lifestyle, his addictions or his unwillingness to work has little to do with the diversity of profiles and life journeys of the people sleeping rough today in big cities or in shelter facilities. To end up in a homeless situation a person needs to have accumulated different disadvantages and types of social exclusion. Sleeping rough is the result of becoming unable to afford the price of housing, the continuous exclusion from the labor market, a deterioration of social support networks, a breakdown of family solidarity and, in some cases, a disease, mental disorder or addiction. The increase of people on the street is one of the most visible and extreme symptoms of the vulnerability affecting the majority of the society in Barcelona.
Housing exclusion, a phenomenon which signifies more than just being homeless, is a consequence and also the cause of social exclusion processes. If a lack of income can lead to not having access to appropriate housing, the fact of not having a private space of intimacy and social life can condemn people and families to poverty. It’s not only about not having a place to sleep. Not having a home means having no place to keep their belongings; for developing the personal and intimate relationship; for resting safely. Homeless people live in a continuous temporary situation, unable to generate stable social relationships, without daily routines, without an address. This report updates data on homelessness in Barcelona, which is collected annually by the Xarxa d’Atenció a Persones Sense Llar –XAPSLL- (Network of Attention to Homeless People) of the city, conformed by entities and the City Council. Since 2008, every March 12th, basic statistical information about people sleeping rough is registered in all the care facilities specialized in the night attention of homeless people. The result is a static annual picture of the traits of users of these facilities. To complete the observation, in 2008 and 2011, XAPSLL started organized citizen counts, consisting in groups of volunteers walking through the city on the same night to count all the people who were sleeping in public areas or rough. Nevertheless, this report has been made using the data of analysis of the Social Insertion Service (SIS) of Barcelona City Council. The street teams for SIS draft monthly reports about their activity and outline the number of different people they’ve made contact with on the street throughout the month. Duplicities in the count are avoided through the knowledge of every case by the SIS professionals. The range of statistical information provided by them is wider than the counting of just one night. On a quantitative level, this report infers that the people sleeping on the street on the night of the 12th March 2013 are the same whom SIS contacted throughout March.
T
All the entities and administrations working together in fighting homelessness are certain that you must have knowledge to be able to intervene. Civil solidarity, crucial to rebuild the ties and bonds of people in severe social exclusion, must be led by a thorough knowledge of the reality which citizens and political law-makers don’t always have. The following paragraphs expose a theoretical approach on housing exclusion and the impact of the crisis on the reality of homeless people, aimed to complement the theoretical revision of the document Diagnosis 2011 (Sales, 2012); the presentation of the count results made by the entities of XAPSLL and the statistic results available about homeless people who lived in the city during march 2013 based on SIS data; the updated data on resources from XAPSLL and a review of the latest proposals on intervention and improvement of the public policies in fighting against homelessness.
Having a systematized and wider knowledge of the reality of homeless people in the city is a commitment which stems from making important changes in the perspective of public policies addressed to the hardest forms of social exclusion. Institutional intervention in homelessness has been maintained for a long time between crimi-nalization and persecution, shaped by the “Law of lazy people and villain”, and the caring assistance of specialized entities which used to work alone. It wasn’t until the democratization and the approval of the Law of Social Services of Catalonia in 1985 that the right for social services was accomplished for the entire population. With this step, an approach model with a public order and welfare perspective began a transition towards a model of public responsibility. To achieve this, the local administration launched collaboration frameworks with entities which had been filling in for the inactivity of the public sector for decades (Cabrera, 2008) and developed its own services and resources to reach a wide range of the vulnerable and unat-tended population.
With the approval of the City Plan for Social Inclusion 2005-2010 and the signing of the Citizen Agreement for an Inclusive Barcelona and the subsequent approval of the City Program of Attention to Homeless People, the City Council of Barcelona embraced the challenge and commitment to extend the services and resources for homeless people, to strengthen the orientation of the services towards the construc-tion of personal inclusion plans and to consolidate its collaboraconstruc-tion with the special-ized entities of the society with the joint creation of the Xarxa d’Atenció a Persones Sense Llar (Network of Attention to Homeless People).
Objectives of the Network
Sharing knowledge, experiences and information, as well as fostering dialogue and reflec-tion, to improve the orientation and efficiency of the services and resources.
Acting in a collective and coordinated way through specific projects.
Boosting innovation.
Raising awareness among the citizens about the situations of need and the interventions which are carried out.
Source: Presentation of XAPSLL. http://www.bcn.es/barcelonainclusiva/ca/xarxa2.html
The members of the Network meet at least three times a year to assess, analyze and prioritize the common actions which will be carried out through diverse working teams who intervene under the direction and supervision of the plenary session. These are the actions launched in the last few years by XAPSLL working teams:
• Two diagnosis-counts of the homeless people in the city (2008 and 2011).
• Two congresses. The first, entitled “Mental health and homeless people”, taking place in 2009 and the second, named “Imagine in 2015 nobody sleeping on the street”, and organized in 2010.
• Creating the catalog of services and resources of the Network (2009-2010).
• Report about the usage of XAPSLL services (2010).
• Outlining proposals for the improvement in the social and health care of homeless people with mental disorders (2009-2011).
• Systematizing the data collected from the activity (2009).
• The raising awareness campaign “Imagine in 2015 nobody sleeping on the street” (2010-2015).
1.Home
1.Home
-lessness
The exclusion from housing, homelessness, is identifi-ed as one of the most extremes ways in which poverty manifests itself in our cities. The European Economic and Social Committee Report on the “Problem of ho-meless people” outlines five types of factors which influence the risk of people suffering severe social exclusion and dwelling exclusion:
• structural factors: evolution of the economy, immi-gration, citizens rights and housing market;
• institutional factors: intervention of social services, performance of help schemes, procedures and institutional bureaucracy;
• interaction factors: family situation, relationship networks, breakdown situations;
• personal factors: health conditions, dependency situations, age;
• discrimination or absence of a legal status, a factor that can affect individuals and some ethnic mino-rities such as, for example, Romany communities
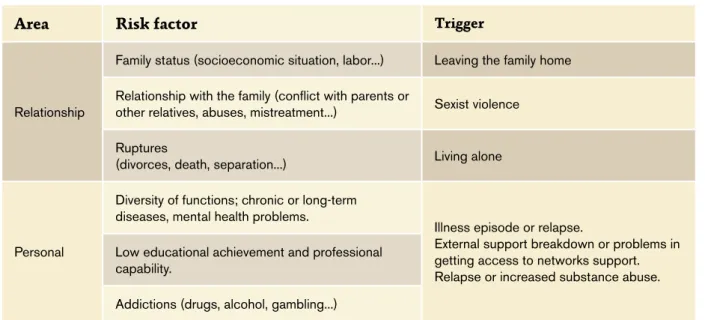
These factors broaden or minimize the individuals’ pro-bability to become homeless, but it’s the confluence of experiences of rupture and its whole manifestation in the development of their life cycle which can trigger the process towards dwelling exclusion or living on the street. The trigger factors can also be linked to the professional, institutional, personal, relationship or legal area and have different levels of importance according to the moment they impact on people’s lives.
1. Homelessness
Area Risk factor Trigger
Structural
Economic processes (poverty, unemployment...) Delays in paying the rent or mortgage.Eviction from their own home (owned or rented).
Loss of housing
Change of place of living Housing market
Social Protection
Arriving in a new country.
Change of the legal status or the adminis-trative situation.
Impossibility of accessing an affordable house.
Impossibility of accessing social protection. Immigration and citizens’ rights
Institutional
Scarcity of appropriate services or lack of coordi-nation between existing services, to find out the
demands and needs properly. Interruption of institutional support or failing to adapt to emerging needs.
Mechanisms for assigning resources.
Institutionalization (living in a shelter, prison, centre for mental disorders, etc.)
Discharge from prison.
Loss of home after admission in a centre. Administrative procedures linked to
institutionaliza-tion (admission or discharge from centres, transi-tions...)
This array of circumstances and life experiences create a wide range of pathways towards situations of social exclusion and poverty, whose hardest facet is living on the street or becoming homeless. But housing exclusion is more diverse. FEANTSA (European Federation of National Organizations aimed to work for the Homeless people) proposes an assessment of housing exclusion by outlining a classification of the situations of housing deprivation which identifies different grades of exclusion and breaks the classic distinction between the majority of society who have got a home and the people who spend the night on the street or in hostels for homeless people. The typology of situations, named ETHOS (European Typology of Homelessness and Housing Exclusion) ex-poses that access to housing has three dimensions: from a physical point of view, it consists of having an adequate place belonging exclusively to a person and his family; from a social point of view: having a private place to develop so-cial relationships and from a legal point of view it consists of owning a home or having a rental contract.
According to the conditions of habitability of the place where a person lives, the private and social life it permits and the legal framework of the housing’s usage, four situ-ations or categories can be defined:
• Rooflessness: the person hasn’t got a physical place to live in.
• Houselessness: the person has a physical place to live in, although doesn’t have the necessary privacy conditions to be considered his own place and the occupant doesn’t have ownership. A person who stays overnight in public facilities or social entities is considered homeless.
• Insecure accommodation: the person has got a physi-cal place to develop his private life, but hasn’t got a legal license of usage.
• Inadequate housing: the person lives in a place which doesn’t have adequate conditions of habitability. He has got a physical place where he can develop his private life, with legal license of usage or ownership, but with inconveniences brought about by the dete-rioration of the infrastructure.
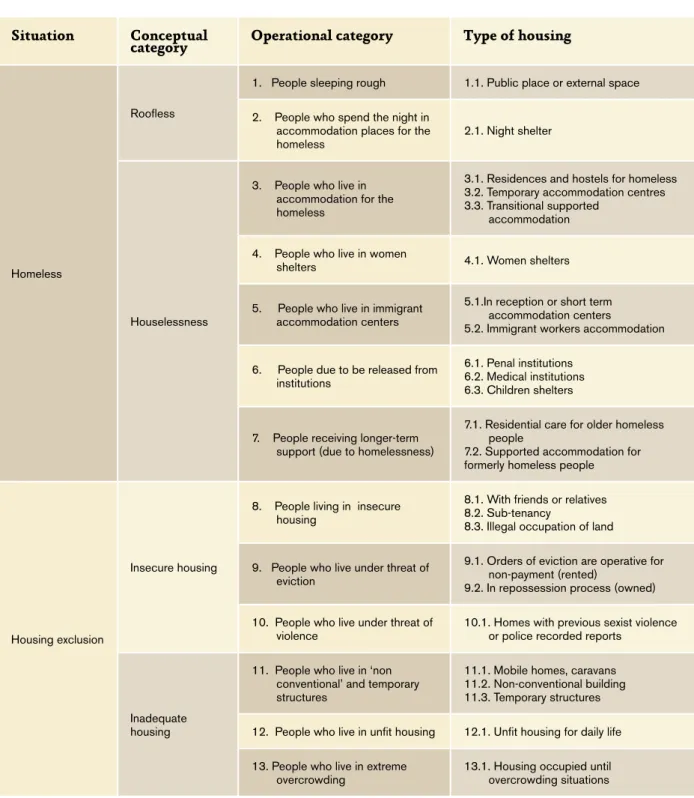
These four categories have been made operational by identifying thirteen specific situations which cover all the forms of deprivation of the right to dignified housing. It’s worth presenting the concepts of the different typologies established in FEANTSA’s framework, since this is the classification being adopted over Europe by the entities and public administrations to tackle the problem of hous-ing exclusion.
Area Risk factor Trigger
Relationship
Family status (socioeconomic situation, labor...) Leaving the family home
Relationship with the family (conflict with parents or
other relatives, abuses, mistreatment...) Sexist violence
Ruptures
(divorces, death, separation...) Living alone
Personal
Diversity of functions; chronic or long-term diseases, mental health problems.
Illness episode or relapse.
External support breakdown or problems in getting access to networks support. Relapse or increased substance abuse. Low educational achievement and professional
capability.
Addictions (drugs, alcohol, gambling...)
Table 1.1. Risk factors and triggering circumstances of the homelessness
Table 1.2. Classification ETHOS
Situation Conceptual
category Operational category Type of housing
Homeless
Roofless
1. People sleeping rough 1.1. Public place or external space
2. People who spend the night in accommodation places for the
homeless 2.1. Night shelter
Houselessness
3. People who live in accommodation for the homeless
3.1. Residences and hostels for homeless 3.2. Temporary accommodation centres 3.3. Transitional supported
accommodation
4. People who live in women
shelters 4.1. Women shelters
5. People who live in immigrant accommodation centers
5.1.In reception or short term accommodation centers
5.2. Immigrant workers accommodation
6. People due to be released from institutions
6.1. Penal institutions 6.2. Medical institutions 6.3. Children shelters
7. People receiving longer-term support (due to homelessness)
7.1. Residential care for older homeless people
7.2. Supported accommodation for formerly homeless people
Housing exclusion
Insecure housing
8. People living in insecure housing
8.1. With friends or relatives 8.2. Sub-tenancy
8.3. Illegal occupation of land
9. People who live under threat of eviction
9.1. Orders of eviction are operative for non-payment (rented)
9.2. In repossession process (owned)
10. People who live under threat of
violence 10.1. Homes with previous sexist violence or police recorded reports
Inadequate housing
11. People who live in ‘non conventional’ and temporary structures
11.1. Mobile homes, caravans 11.2. Non-conventional building 11.3. Temporary structures
12. People who live in unfit housing 12.1. Unfit housing for daily life
13. People who live in extreme
overcrowding 13.1. Housing occupied until overcrowding situations
Even though these categories multiply the diversity of sources needed to tackle the challenge of quantifying the social phenomenon of housing exclusion, entities and administrations committed to the fight against homelessness all over Europe are developing tools to be able to consider the problem in its full complexity. The very description of the categories shows us that the homeless situation is attached to many other situ-ations of social exclusion. Serious deficiencies in the physical space where a family lives, as well as over-crowding, are the direct consequence of economic de-privation. Living in residential centers for women who have suffered sexist violence is not only a symptom of having experienced this social scourge; in many cases the weakness of the support networks makes it strictly necessary to provide housing for the affected. Living in residential centers for immigrants is the main consequence of the legal exclusion suffered by immi-grants. Living in insertion flats owned by the council or a social entity is the response to a serious situation of exclusion (Sales, 2012). The intensity of social ex-clusion which an individual suffers is strongly linked to housing access. Being in a homeless situation means having run out of the personal and social resources needed to access a stable accommodation, which would permit a satisfactory private and social life. It is therefore, the result of a series of social exclusion factors that accumulate and turn situations of margi-nalization progressively more severe until the person loses his ties with society.
At the same time, the difficulties in accessing housing constitute a powerful factor of social exclusion and generational replication of poverty. Housing ownership is conditioned by a family’s economic capacity and in-herited estate. Due to the configuration of the Spanish housing market system and as a result of the policies which for decades have encouraged the purchase of houses, renting has been until now a minority option. In 2008, a research (Sarasa and Sales, 2008), on as-sessing the life path of 348 people in situation of social exclusion revealed clearly that the purchase of a house, once paid, was a guarantee against the risk of falling into a homeless situation. The same research showed that people who had suffered severe situations of so-cial exclusion had experienced much more difficulties in accessing housing than the rest of society. The increase of prices, along with the absence of family patrimony, had presented an unbreakable barrier and an intergenerational reproduction of housing exclusi-on. Low grades at school and leaving the educational
system early strengthened an early transition towards adult life, leading people without chances of a stable job to a precarious emancipation or remaining in the family home for many years of adulthood.
2.Cri
sis
and home
2.Cri
sis
and home
-lessness
2.Crisis and homelessness
Homelessness has been traditionally disassociatedfrom problems in accessing housing, acknowledging that ending up on the street was the end of a long process of social exclusion where economic vulnerability was added to a continuous exclusion from the labor market, the deterioration of supportive social networks, breakdowns in family solidarity and mental disorders or addictions. The collective imagination sees homeless people as drifters, tramps, vagrants; social outcasts who are integrated in the urban landscape, caused by the individual circumstances of those involved and to personal pathways, featuring so-called reprehensible activities, like small-scale delinquency, illegal drugs consumption or alcohol abuse. If in the society of abundance it was difficult to transmit that a broadening of risks concerning poverty situations was emerging, trying to convince society about a wider risk of becoming homeless was impossible. The explosion of the mortgage crisis and the succession of foreclosure procedures and evictions have changed this feeling of invulnerability for a great part of the public in terms of housing exclusion.
Although it’s right to say that the situation experienced by people who sleep in public places requires the failure of many other factors of social protection than just housing access, a life route marked by the incapability of affording dignified housing leads in all probability to suffer exclusion in other dimensions of human relations (Sarasa and Sales, 2009; CESE, 2011). In Catalonia, housing access was a privilege beyond the reach of a good amount of society. In 2006, the Special Envoy of the United Nations on the Right for an Adequate Housing, Miloon Kothari, visited Spain, and submitted a report where he concluded that the right of housing had been systematically made more vulnerable with the collaboration and tolerance of the Public Administrations (Colau and Alemany, 2012). The report claimed that the State housing sector had been extremely commercialized.
Extremely easy access to mortgage credit and public policies -like the application of the ‘Right of Urban Renting’- which fostered the purchasing in the housing market and converted renting into an uncertain and financially unattractive option created access
problems. Those on lower incomes couldn’t deal with the demands of a mortgage despite the concessions offered by banks. Among these social groups it was found that there were lots of young people who were already suffering the deterioration of labor conditions in their own lives and adults with unstable labor situations or recurring unemployment. In this second group, difficulties in stabilizing their housing situation were added to other factors of social exclusion and increased the risk of becoming homeless. If, in 1997, homes with a mortgage devoted 37,6% of their income to pay the mortgage fees, in 2007 the proportion had risen up to 51,2% (Colau and Alemany, 2012, page 54). The research made by Sarasa and Sales (2009) about pathways and factors of social exclusion in the city of Barcelona revealed that people who were suffering severe forms of social exclusion had repeatedly found obstacles to access dignified housing throughout their life due to their low financial capacity and having no family support or patrimony to access to a property. If the lack of housing access represents a factor of social exclusion by increasing the poverty risk, enduring a foreclosure procedure and eviction constitutes a turning point in people’s lives that worsens and can make the poverty situation chronic, leading to non-payment of credit fees. It’s true that an evicted family doesn’t automatically start to sleep on the street. In general, family, local and institutional resources protect people who are expelled from their houses from sleeping rough, but these resources can deteriorate easily if social inclusion paths aren’t found. The Spanish law which permits the bank debt to become impossible to pay doesn’t help expelled families to rebuild their lives1.
Despite big difficulties in registering and comparing data on homelessness in the different European countries, FEANTSA has been making an effort for a long time to systematize the information available and to identify tendencies. In the report On the way home? (FEANTSA, 2012), it states that the number of homeless people has risen in fifteen of the twenty-one member states represented in this federation. In three of the states no tendencies were identified; in Denmark, the number of homeless people has remained stable and only in Finland and the Low Countries is a
decrease on the impact of homelessness detected. The German region of North-Rhine-Westphalia and Scotland also show a reduction. The rise is attributed to the economic crisis and the widening of social vulnerability it has created all over Europe, though there are variables. Entities and experts of FEANTSA maintain that countries who have registered a decrease in the number of homeless people have implemented specific policies based on rigorous data collection and put the need for housing at the center of the attention for homeless people (housing-led policies)2 .
On a quantitative level, the European Commission (2013) estimates that 410.000 people sleep on the street on any one night in the EU. Moreover, 4 million citizens of the EU are considered to be exposed to a roofless or homeless situation at one time or another moment throughout the year. The Eurobarometer in 2010 indicated that more than 3 million European citizens claimed they felt the risk of becoming homeless3 .
In the Spanish state, between the survey made by the NSI in 2008 in the homeless services and the one carried out in July 2012, the number of housed people had risen in 15,7%. In this survey, people sleeping rough are not taken into account. Therefore, there’s an interaction between the increase in supply and the increase in demand that makes it difficult to reach conclusions. In Barcelona, the 2008 count revealed there were 2.013 people in a roofless or homeless situation or spending the night in support facilities, whereas the 2011 count recorded 2.791 (Sales, 2012).
FEANTSA confirms that “countries most affected by the crisis, like Greece, Portugal and Spain, have experienced a dramatic increase in homelessness” (FEANTSA, 2012, p. 30). The profiles of homeless people identified by the entities and social services from the different European countries are also affected by the crisis. Six of the 21 countries assessed by FEANTSA display an increase of homeless families; in ten countries an increase of women; in 14 an increase of foreign immigrants and in ten an increase of young people. In 4 of these countries -Spain, Italy, Portugal
and Greece- “new falls” in homeless situations directly linked to the crisis are registered. In the Spanish state, all the tendencies currently existing in the rest of Europe –with the exception of the increase of families with children- are displayed. As a result, the homelessness reality in the State turns out to be more diverse and reflects an incidence even bigger than the last economic period on new arrivals. The stereotype of the middle-aged man, drifter, with alcohol problems because of his social isolation and permanent exclusion from the labor market, ending up on the street, is getting further and further from reality.
3.General
evolution
of hous
-inG exclu
-sion in
XAPSLL data sources used to identify housing exclusion tendencies in Barcelona are limited. Of the 13 ETHOS categories, the network can record fairly complete information from categories 2, 3, 7 and 8. The information collected and handled by SIS provides an accurate knowledge of categories 1 and 8, people living in a public space or rough and people living in settlements and shacks. We’ve also got partial information of category 4, living in women’s shelters, due to the partial specialization of one of the network’s entities, but that’s only an incidental piece of data in the wider reality of these support services in the city administrated by entities which don’t belong to XAPSLL.
Even though XAPSLL is still not able to monitor the evolution of all the ETHOS categories, the willingness to understand that different realities of housing exclusion are intrinsically linked urges us to consider them as the reference for knowledge creation about homelessness and housing exclusion in Barcelona.
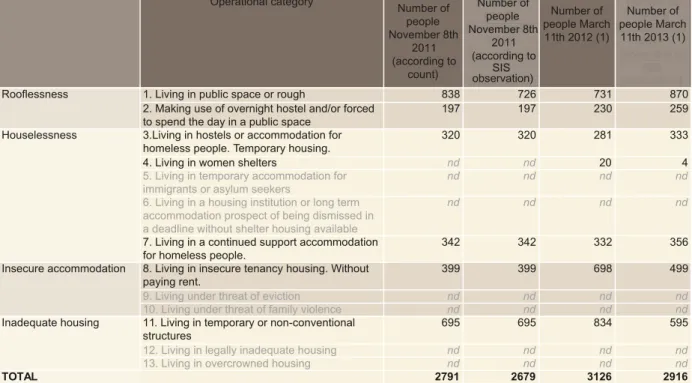
If we look carefully at the figures, the number of 2.679 homeless people counted by us in November 20084 (official date of the last count) has risen to 2.933 people in March 2013.
The number in 2012, 3.126 people can’t be considered a decisive point after which there is a regression due to the counting complexities. Unfortunately, the differences between 2012 and 2013 are, as detailed further on, methodological.
The most reliable indicator to point out the general tendency is the number of people contacted by SIS on the street. This number is not conditioned by methodological changes, nor modifications in the handling policies of the problematic issue by the entities or administration. The rise in ETHOS category 1 is clear and more marked in the last year than the year before. From 726 people contacted by SIS in November 2011, we have moved on to 870 in March 2013. The increase occurs concurrently with the amplification of places in shelters, allowing a rise of people in ETHOS category 2, reaching 259 people. In total, the number of homeless people in Barcelona, according to FEANTSA conceptualization, would reach 1.129 in March 2013, compared to 923 in November 2011.
3. General evolution of
housing exclusion in
Barcelona
3.General
evolution
of hous
-inG exclu
-sion in
Barcelona
If we recuperate the simplified classifications that were used in previous XAPSLL reports, an increase of 47% between 2008 and 2013 of people sleeping on the street is observed, a very notable increase, 125%, in the population of settlements and an increase of 23% in the people sleeping in homeless shelter facilities provided by XAPSLL. On the 12th March 2013 it is estimated that there are 2916 people without a home in the city. Of these, 870 sleep on the street, 595 in settlements and temporary structures and 1468 in residential resources of the network.
To explain the evolution of the rest of the categories, the interrelation between supply and demand of services and the orientation of attention policies for homeless people must be considered. There are different focuses of attention in this sense. A slight increase can be seen in category 3, belonging to the evolution of places available and the creation of a new resource which is discussed further on -in the annex devoted to available resources. Regard-ing the number of people classified in category 8, embracRegard-ing men and women livRegard-ing in hostels or sub-tenancy flats with financial and social support from the city council social services or entities, the fluctuating evolution answers especially to a decrease of the number of people housed in this type of resource by Caritas, which has launched 63 one-family accommodation units where families who were living in sub-tenancy rooms have been housed. Lastly, it is very difficult to determine the real change in the number of people counted in settlements, due to the complexity of the situation in the industrial units in Poble Nou. In this area, the economic activity of scrap recycling is shared with situations of extreme exclusion and the capacity of the attention teams to quantify people who live there or stay overnight there is limited.
Table 3.1. Number of homeless people in the city of Barcelona according to ETHOS classification
Sources: SIS reports. Counts made by XAPSLL on 8th/11/2011, 11th/3/2012 and 11th/3/2013.
(1) Data of categories ETHOS 1 and 11 come from observations made by SIS. Don’t belong to a night count, but to the identification of different people in the streets of Barcelona during March.
Number of people November 8th 2011 (according to SIS observation) Number of people November 8th 2011 (according to SIS observation) Operational category Number of people November 8th 2011 (according to count) Number of people November 8th 2011 (according to SIS observation) Number of people March 11th 2012 (1)
Number of people March
11th 2013 (1)
1. Living in public space or rough 838 726 731 870
2. Making use of overnight hostel and/or forced to spend the day in a public space
197 197 230 259
3.Living in hostels or accommodation for homeless people. Temporary housing.
320 320 281 333
4. Living in women shelters nd nd 20 4
5. Living in temporary accommodation for immigrants or asylum seekers
nd nd nd nd
6. Living in a housing institution or long term accommodation prospect of being dismissed in a deadline without shelter housing available
nd nd nd nd
7. Living in a continued support accommodation for homeless people.
342 342 332 356
8. Living in insecure tenancy housing. Without paying rent.
399 399 698 499
9. Living under threat of eviction nd nd nd nd
10. Living under threat of family violence nd nd nd nd
11. Living in temporary or non-conventional structures
695 695 834 595
12. Living in legally inadequate housing nd nd nd nd
13. Living in overcrowned housing nd nd nd nd
TOTAL 2791 2679 3126 2916
Rooflessness
Houselessness
Insecure accommodation
Table 3.2. Number of homeless people in the city of Barcelona, 2008, 2011, 2013.
Sources: Countings made by NAHP. SIS registers and reports
0 500 1000 1500 2000 2500 3000 3500
Graph 3.1. Evolution of the number of homeless people
in Barcelona.
2008, 2011, 2013
People housed in NAHP resources Settlements (according to SIS reports)
Street count, SIS detection
2013
Variation 2008-2013 % According
to the counting made the night of March the 11th 2008
According to SIS estimatio
n
According to counting made the night of Novembe
r the 8th 2011
According to SIS estimatio
n
According to SIS estimatio
n
11901 190 1258 1258 1468 23,4% 2008 2011
Counting on the street, SIS detection 658 562 838 726 870 46,8% Settlements (according to SIS reports) 265 265 6956 955 95 124,5% People housed in housing resources
of NAHP
4. Home
-less peo
-ple in tHe
city of
Barcelo
4. Home
-less peo
-ple in tHe
city of
Barcelo
-na
4. Homeless people in the
city of Barcelona
Since the housing exclusion phenomenon has started to be assessed with relative frequency, estimations about the number of homeless people sleeping rough on the streets of Barcelona come from two sources: citizen counts promoted by XAPSLL, made on March the 11th 2008 and November the 8th 2011 and the reports drafted by the Social Insertion Service (SIS) about its interventions, which gather the number and characteristics of homeless people whom the professionals of the service have been in touch with for a specific month. Since there hasn’t been any new citizen count, the current report reflects data provided by SIS, taking as months of reference March 2011, March 2012 and March 2013, so as to make the information coincide with the counts made by the XAPSLL units which are shown in the next graph.
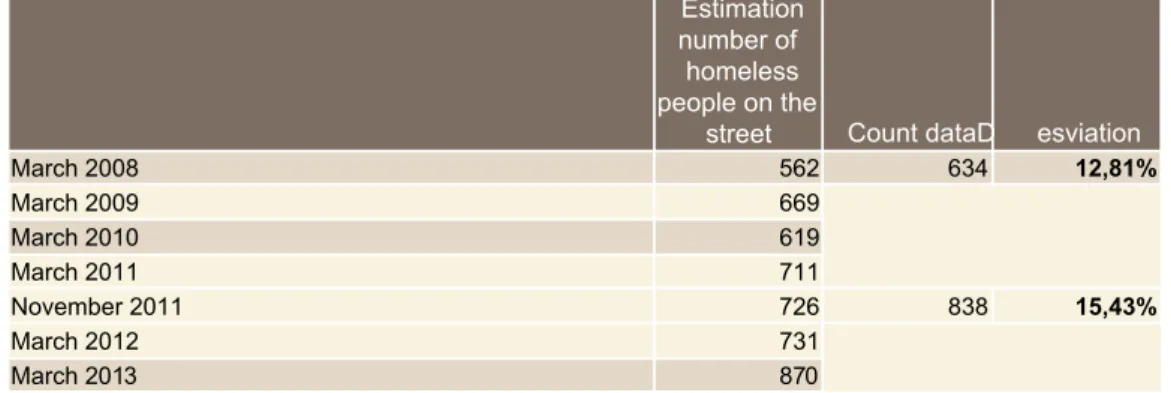
It’s worth pointing out that the citizen count, consisting in combing all the city on one night with the help of around 700 volunteers, has recorded, on the two occasions when they have been carried out, figures slightly higher than SIS numbers (between 12 and 16% higher), although the tendencies shown by the two sources were very similar. In March 2008, the citizen count made the night of the 11th identified 634 people sleeping rough, whereas the number of people in contact by SIS this month was 562. In November 2011, the count made the night of the 8th identified 838 people sleeping rough, whereas SIS kept in touch with 726 different people during this month. During March 2013, the number of different people identified by SIS has been of 870, confirming the recent tendency of rising numbers.
Table 4.1. Evolution in the number of people detected by the educators team of SIS-Detection:
Note: Settlements not included
562 634 12,81%
669 619 711
726 838 15,43%
731 870
Estimation number of
homeless people on the
street Count dataD esviation
The distribution of homeless people by districts hasn’t changed remarkably over the last few years. Ciutat Vella, Eixample and Sants are still the districts with more homeless people, ac-counting for half of the people who sleep rough on the streets of the city. The total increase of people between 2011 and 2013 is of 22,4% and, whereas Ciutat Vella and Sants-Montjuic have registered increases in keeping with the municipal average, Eixample has seen an increase of 40,5%. Changes in other districts are not really significant due to the fact that absolute numbers of people sleeping rough are low. However, Nou Barris’s figures stand out; the 14 people contacted by SIS in March 2011 have increased to 49 in March 2013. The rise is due to the opening of the Primary Shelter in Marie Curie street.
Januar y Marc h Ma y July
Setember November Januar
y Marc h Ma y July
Setember November Januar
y Marc h 0 200 400 600 800 1000
Graph 4.1
Evolution of the number of different people
monthly in contact
with SIS. January 2011-March 2013
2011 2013 Number %N umber%
1251 7,6% 1541 7,7% 23,2%
1211 7,0% 1701 9,5% 40,5%
1191 6,7% 1421 6,3% 19,3%
38 5,3% 38 4,4% 0,0%
59 8,3% 75 8,6% 27,1%
21 3,0% 35 4,0% 66,7%
45 6,3% 46 5,3% 2,2%
14 2,0% 49 5,6% 250,0%
44 6,2% 50 5,7% 13,6%
1251 7,6% 1211 3,9% -3,2%
Total 7111 00,0%8 70 100,0% 22,4%
Table 4.2. Distribution of people contacted by SIS who were sleeping rough in March 2011, March 2012 and March 2013
Variation 2011-2013 % District Ciutat Vella Eixample Sants Les Corts Sarrià Sant Gervasi Gràcia Horta Guinardó Nou Barris Sant Andreu Sant Martí
Life on the street is usually associated with social isolation. The majority of people spend the night on the street alone. In March 2011, the SIS team registered that 85 of the contacted people who were sleeping rough formed part of 16 small groups. The presence of a family of three people was also registered, one of them under-aged -anecdotal, since the social protection system relating to minors, is very thorough. In this sense, we can state that there are no children living on the streets of the city. Families with under-aged children who are occasionally detected on the streets of Barcelona are immediately referred to the appropriate support services. Therefore, this overnight sleeping is considered occasional and sporadic. In March 2013, despite the increase of people in a ‘homeless’ situation, the number of groups had decreased to 12 and the number of people belonging to them was 50. We cannot affirm that isolation is on the rise taking into account only this data, but the evolution of the data must be still observed carefully.
People People
100 25 3-
-110 11 3-
-103 13 33 1
38
----53 61
--21
----40 51
--11 31
--32 12 2-
-115 10 2-
-Total 623 85 16 31
People People
137 17 4-
-170
----127 15 4-
-38
----66 92
--35
----36
----43 61
--50
----118 31
--Total8 20 50 12
--Table 4.3. Sleeping rough alone or in group. Barcelona, by districts. March 2011, March 2013
March 2011
District People alone Groups Families Groups Families Ciutat Vella Eixample Sants-Montjuïc Les Corts Sarriá-Sant Gervasi Gràcia Horta-Guinardó Nou Barris Sant Andreu Sant Martí March 2013 Districte People alone Groups
Groups Families Ciutat Vella Eixample Sants-Montjuïc Les Corts Sarriá-Sant Gervasi Gràcia Horta-Guinardó Nou Barris Sant Andreu Sant Martí
The socio-demographic profile of the people in a homeless situation hasn’t changed much between 2011 and 2012. Distribution by gender is nearly the same, with 90% men. Distribu-tion by age has remained stable as well. Various European countries have raised the alarm of the increase of young people among the homeless, especially between 18 and 24 years old (FEANTSA, 2012). This tendency is believed to be the consequence of the substantial increase of young unemployment all over the region. However, considering the Spanish State is one of the EU members with the most dramatic situation in terms of young unemployment, we can’t certify from data gathered on the street a significant increase of people among this age range between 2011 and 2013. In relative terms, the weight of this age range decreases from 12,5% to 8,6%. The evolution in the coming years must be assessed, in order to know if the tendency gets consolidated, since between 2008 and 2011 an increase of the people detected by SIS sleeping rough between 20 and 30 years old was observed. This increase in three years was of 20%; therefore, lower than the whole of the age ranges, but still alarm-ing takalarm-ing into account that it was traditionally protected from homelessness by the family networks.
With regard to the nationality of homeless people, there are no significant changes detected between 2011 and 2013. The last date of reference detected 43,1% Spanish people were contacted; 30% from the EU and 26,9% were from non-EU countries. Among them, more than half were in an irregular legal situation. In total, homeless people in irregular situations were 15.17% (only a percentage point less than in March 2011).
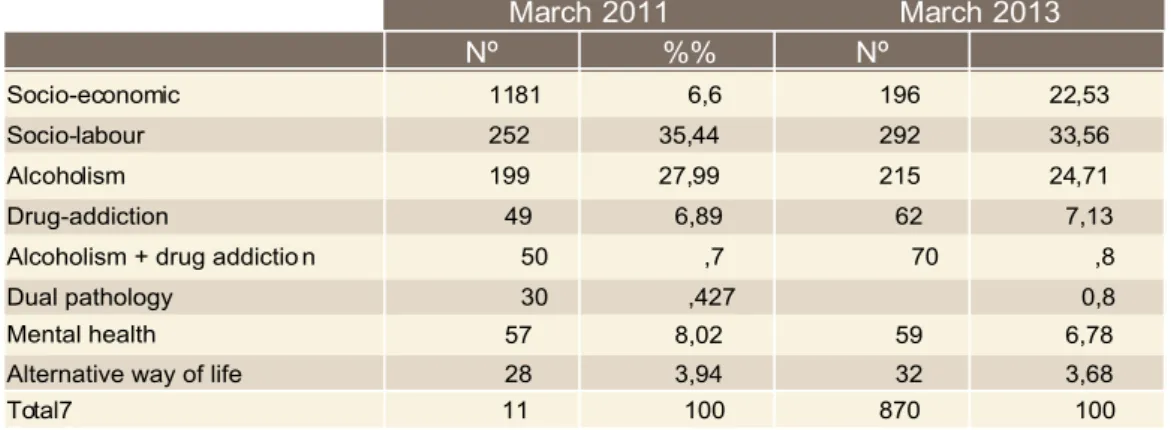
SIS experts also register the triggering problem of the homeless situation of every person dealt with. It’s important to note that data coming from this register must be interpreted bearing in mind that the information available for each individual is very different. There are people living on the street who are monitored and who have been known for many years; there are people with whom it’s been possible to speak to on repeated occasions while with others there’s only been sporadic contact, with practically no personal information gathered about them. Accordingly, what is registered is the triggering factor which homeless people themselves attribute their situation to. Consequently, when we say that 22.53% homeless people in contact with in March 2013 charged their situation to social and labor problems, we don’t say they aren’t enduring other problems or -after an individualized diagnosis is carefully made- there won’t appear further and more relevant problems to explain the lack of economic resources. As a consequence, this data can only be compared with its own precedents and allows us to detect tendencies, but not formulate absolute conclusions.
Men Women TotalM en Women Total
0,2% 0,0% 0,1% 0,0% 0,0% 0,0% 16-291 1,6% 20,5%1 2,5% 7,5% 18,4%8 ,6% 30-444 7,4% 42,5%4 6,8% 47,4%4 3,7% 47,0% 45-643 7,4% 30,1%3 6,6% 40,9%2 9,9% 39,7% >64 3,6% 6,8% 4,0% 4,3% 8,0% 4,6% Total1 00,0%1 00,0%1 00,0%1 00,0%1 00,0%1 00,0%
(604)( 73)( 678) (776)( 87)( 863)
Table 4.4. Age of the people who were sleeping rough. Barcelona, March 2011, March 2013
March 2011 March 2013
<16 years old
5 According to information from the Social Insertion Service of the City Council of Barcelona. Based on what have been considered triggering factors, more than the half of homeless people (56,9%) attribute their situation to socio-economic and socio-labour conditions, 24,7% point out the alcoholism, 7,1% drug-addiction and remarkably 6,8% address their situation to a mental disorder which becomes registered if diagnosed. As we have mentioned earlier, this doesn’t mean that 6,8% of homeless people actually have a mental illness, but it’s the proportion of those who suffer one, who have got a diagnosis and, furthermore, who consider it as the triggering factor of their situation of severe social exclusion.
The percentage of mental disorders among the homeless population is much higher. Accord-ing to the research on mental health among homeless people in Barcelona carried out in 2010, Uribe and Alonso determined, based on standardized questionnaires, that 49% of the people surveyed suffered from some kind of mental disorder (depression, anxiety or others). It was also certified that 16% of the people questioned had taken psychiatric medication aimed at controlling the symptoms of severe mental disorders like schizophrenia or manic-depressive disorders.
%%
1181 6,6 196 22,53
252 35,44 292 33,56
199 27,99 215 24,71
49 6,89 62 7,13
50 ,7 70 ,8
30 ,427 0,8
57 8,02 59 6,78
28 3,94 32 3,68
Total7 11 100 870 100
Table 4.5. Main problem (1) of the people who were sleeping rough. Barcelona, March 2011, March 2013
March 2011 March 2013 Nº Nº
Socio-economic Socio-labour Alcoholism Drug-addiction
Alcoholism + drug addictio n Dual pathology
Mental health Alternative way of life
Source: Service of Social Insertion. Barcelona City Council
5. PeoP
le at
-tended in
XaPSll
houS
-ing Service
S
and night
5. People attended in XAPSLL
housing services and night
shelters
5. PeoP
le at
-tended in
XaPSll
houS
-ing Service
S
and night
Shelter
S
XAPSLL entities6 counted 1.447 housed people in their support services on the night
between 11th and 12th March 2013. Between 2012 and 2013 a decrease in the number of people attended is noted among all the housing services (1.561 to 1.447), due more to changes in the attention policies and counting than a real decrease in the activity of the entities and the demand for places. The main cause of this reduction in the number of people housed -as we have pointed out previously- is the decrease in the number of people housed in sub-tenancy rooms with social and economic support from Caritas. A rise in one-family ac-commodation to house families in situations of social exclusion which is administrated by the entity has allowed a part of the sub-tenancy rooms demand to be diverted to these facilities, which are more adequate for developing daily life. However, this type of housing hasn’t been counted as support services addressed to the attention of homeless people.
The general trends show some stability in the number of housed people in homeless accom-modation, with an increase of people who spend overnight in housing centres. As we will see in the next annex, between 2012 and 2013 the increases run parallel to the opening of new centres with more places, which respond to the needs detected by XAPSLL.
With regard to the general counting of people housed, it’s worth noting that the decrease in the number of occupied places in inclusion flats is not the cause of a reduction in the number of places but of the circumstances of the night of the count. Despite the fact that officially what we identify as places is the number of beds, flats are resources of variable occupation. Depending on the socio-educational needs of the people living in them, there’s some fluc-tuation in the amount of people who can live there and the possibility of empty beds in flats exists where it’s considered that there are enough people living there or the characteristics or personal moment of the person living there advise against someone new entering the flat
When describing the profile of the people attended, it’s important to take into account that we don’t have the full data of the 1.451 people available. Depending on the availability of data, percentages are based on the amount of people about whom we do know their profile information. These figures are detailed in each of the tables. We have followed the same procedure for all the interpretations. That’s why the totals of each table can be different. In general, there are more information gaps referring to people housed in hostels and sub-tenancy rooms. Most adequate, therefore, is to focus on the assessment of relative figures.
With regard to the socio-demographic traits of people housed, there are no significant changes in gender distribution. There is a trend towards a higher presence of women in the last three years, but the variation is not important enough to be able to draw conclusions. With regards to the age of people attended, a two percentage points rise in the proportion of people older than 65 is noted. On March the 12th 2013, almost 63% of the people housed in resources were men; 26% were women and up to 11,4% under-aged (children and teenagers).
(1) Source: Cabrera et al (2008). Qui dorm al carrer? With revisions from the entities records of XAPSLL (2) Source: XAPSLL
(3) Caritas for all the series, Arrels from March 2011.
(4) Of the 207 places provided by private entities, 121 places were granted in agreement with Barcelona City Council. This means that the City Council has assumed the total cost of these places. This percentage represents 58% of the amount of places categorized as private.
(5) Along with the places granted, Barcelona City Council maintains several collaboration agreements with many of the private entities, in order to support financially different projects in the area of social action.
3633 53 3563 49 3653 39 401 Flats 67 64 66 75 94 70 101 1551 22 1101 02 1011 08 98
5855 39 5325 26 5605 17 600
1371 36 1331 39 1501 76 207 Flats 1151 49 1731 72 2482 78 243
69 54 32 50 19 69 57
2844 12 4043 43 2795 21 344 2
6057 51 7427 04 6981 0448 51 Total 1190 1290 1274 1230 1258 1561 1451
Table 5.1. People housed in homeless facilities. Barcelona, 2008-201 1
Type of homeless facility March 2008 (1)
March 2009 (2) March 2010 (2) March 2011 (2) Novembre 2011 (2) March 2012 (2) March 2013 (2) Public ownership Residential centers Hostels Total Private ownership (4) Residential centers Hostels Sub-tenancy rooms (3) Others
Total
Men 64,9% 65,2% 65,7% 67,7% 61,6% 62,7% Women 23,8% 23,3% 22,6% 21,8% 28,9% 25,9% 11,3% 11,5% 11,7% 10,6% 9,5% 11,4% Total 100,0% 100,0% 100,0% 100,0% 100,0% 100,0% N (1) 1141 1141 1229 1222 1560 1451
Table 5.2. Gender of the people housed in XAPSLL resources
March 10th 2009 March 12th 2010 March 10th 2011 November 8th 2011 March 12th 2012 March 12th 2013 Minors
Even though in the residential services we also find a majority of men among the users, the presence of women in situations of housing exclusion is markedly higher than on the street. Whereas SIS data estimated that only 10% of the people sleeping rough were women, in the homeless accommodation services this figure reaches 26%. There is a slight rising tendency in the rate of women in the last few years that seemed very clear in the comparison between 2011 and 2012, but this softens in 2013. We will have to wait to assess longer series to get conclusions, but the increase in the number of women among the homeless population is a phenomenon present in all European societies since the 90s (Casey et. Al 2007), as well as women’s higher disposition to get support and housing services when compared to men.
In the residential services, the age ranges registered don’t let us make conclusions about a possible increase of young people between attended people. In various European countries, an alarm has been raised over the increase of young homeless people. In the city of Barcelona we have seen, from SIS data, that in the last two years the proportion of young people aged between 16 and 29 has maintained stable and also in the residential resources in the ranges collected.
<18 11,7% 11,8% 11,9% 10,6%9 ,4% 11,2%
18-657 9,5% 79,9% 79,9% 80,1% 82,0% 78,4%
66-75 7,9%7 ,3%7 ,3%8 ,1%8 ,1% 10,4%
>75 0,9%1 ,0%0 ,9%1 ,2%0 ,4%0 ,0%
Total 100,0% 100,0% 100,0% 100,0% 100,0% 100,0%
N (1) 1121 1110 1228 1220 1561 1451
Table5.3. Age of the people housed in facilities
March 10th 2009 March 12th 2010 March 10th 2011 November 8th
2011 March 12th2012
March 12th 2013
(1) Number of people for whom we've got information
38,3% 34,9%5 2,8% 52,0%3 7,7% 42,6%
9,1% 7,6%1 0,1% 10,0% 8,7% 11,3%
52,5% 57,5%3 7,2% 38,0%5 3,6% 46,1%
14,9% 17,9%2 0,0% 19,2%2 3,7% 24,5% 37,6% 39,6%1 7,1% 18,7%3 0,0% 21,6%
Total 100,0% 100,0% 100,0% 100,0%1 00,0%1 00,0%
N (1) 11191 121 993 1035 1549 1446
Table 5.4. Nationality of people housed in facilities
March 10th 2009 March 12th 2010 March 10th 2011 November 8th 2011 March 12th 2012 March 12th 2013 Spanish European Non- European Regular situation Irregular situation
In the report published by the XAPSLL, which gathered data from 2011 (Sales, 2012), a confirmation of one of the trends described in nearly all European countries regarding to the change in the profile of homeless people was noted. It was the detection of the rapid growth of families attended in night care facilities. Between March 2011 and November 2011, the number of people belonging to families attended in these resources had risen from 114 to 178 without any change in the institutional action. The data of people housed in hostels or sub-tenancy rooms weren’t included in these figures, so it wasn’t possible to calculate the magnitude of the problem; they simply raised an alarm by highlighting a trend. However, from the data taken from care facilities in 2012 and 2013 it is possible to obtain the number of people housed in hostels and sub-tenancy rooms with their nuclear families. This change and the action of entities and social services, who prioritize housing in inclusion flats or specialized facilities -like the Temporary Family Shelter Centre of Navas- makes it difficult to create a statistical series easy to compare. However, differences between 2012 and 2013 point to a continuing increase in the number of families in need of housing. From 343 people attended with their family in 2012, in 2013 this figure rose to 531. Even though the entities and administration have worked harder, the increase is due to the emergency reaction of entities which financially help families in need of housing by paying for a room.
For the drafting of the report Diagnosis 2011 (Sales, 2012), the XAPSLL started gather-ing data on health and dependency situations of the people attended. The methodological difficulties in applying objective indicators about the health situation of rough sleepers and the confirmation that the issue requires specialized research led us to register only those objective variables which are useful enough to maintain statistical series through the years. To this extent, in the services the number of people with recognized disability certificates and dependency grades were noted.
An increase in the proportion of housed people with disability certificates is seen. We could infer a greater vulnerability of the people with functional diversities in the city, but this data shows, above all, a greater effort from experts and users to process the documents needed to receive handicap benefits in the face of other income sources disappearing or public benefits getting more and more difficult to obtain, such as the minimum insertion benefit. In this sense, it’s important to point out the launch in 2012 of a specific protocol of collaboration between the XAPSLL and ICASS (Catalan Institute of Attendance and Social Services) entities, made
2011 2012 2013
N% N% N%
132 12,8% 237 15,2% 265 18,3%
45 4,4% 44 2,8% 50 3,4% 89 8,6% 193 12,4% 215 14,8%
Total 1034 1561 1451
Table 5.5. People with disability certificate in XAPSLL facilities the night of 8th November 12th March 2012, 12th March
With disability certificate
With disability certificate between 33% and 64%
With disability certificate of more than 64%
In the 2012 data collection a new variable was included. We have systemized information of the entities on the origin of the incomes, if they exist, of the people attended. It’s observed that in 2013 almost 57% of people attended haven’t got any income, nearly three percentage points more than in 2012. An increase in the proportion of homeless people receiving some kind of job-related income, understood as any form of income during the two weeks previous to the register of data (March 12th), relating to the payment for a job, also stands out. through the Department for the Attention to Vulnerable People in the area of Quality of Life, Equality and Sports from the City Council of Barcelona, in order to prioritize the procedure of assessing the certificates recognizing handicap grades.
2011 2012 2013
N% N% N%
32 3,1% 59 5,7% 60 5,8%
20 1,9% 34 3,3% 35 3,4% 70 ,7% 22 2,1% 22 2,1% 60 ,6% 30 ,3%3 0,3%
Total 1034 1561 1451
Table 5.6. People with recognition of dependency grade in XASPSLL homeless facilities. 8th November 2011, 12th March 2012, 12th March 2013.
Amb reconeixement de grau de dependència
Grade 1 Grade 2 Grade 3
Source: our own research from XAPSLL data
20122 013
N% N%
844 54,1% 824 56,8% 32 2,0% 15 1,0% Receiving non-contributory state p/disability benefit 201 12,9% 183 12,6% 50 ,3%2 0,1% 33 2,1% 42 2,9% 60 ,4%4 0,3% 105 6,7% 84 5,8% 64 4,1% 92 6,3% 14 0,9% 47 3,2% 37 2,4% 23 1,6% 142 9,1% 89 6,1% 78 5,0% 46 3,2% Total 1561 100,0% 1451 100,0%
Table 5.7. Source of the income of the people housed in XAPSLL services. 12th March 2012, 12th March 2013
People without income Receiving disability pension
Receiving short-term disability benefit Receiving unemployment benefit Prison release benefit
Receiving Minimum Insertion Benefit People with earned income
People with earned income along with some benefit or pension
People with unknown source of income People with other sources of income People uncategorized by lack of information
6. XAPSLL
reSPon
Se:
evoLu
-tion of re
6. XAPSLL response:
Evolution of resources
6. XAPSLL
reSPon
Se:
evoLu
-tion of re
-Source
S
Throughout the last few years, entities and organizations of XAPSLL have increased their resources destined to the attention of homeless people, as an answer to the rise in the needs and demand of accommodation places. Residential services, be it public, private or sponsored in agreement with the City Council, have grown prioritizing insertion flats ahead of large-capacity installations, at least until 2012. Between last year and this one, new facilities have been created in response to emerging needs, such as the Temporary Accommodation Centre Hort de la Vila, sponsored by the City Council of Barcelona and administrated by Sant Joan de Déu Social Services, the Mambré Social Hostel, a Mambré Foundation initiative, and the Temporary Housing Centre for Families (THCF), created by the Barcelona City Council.
It needs saying that the difference between public and private ownership relates to the owner of the resource –be it a flat or residential centre-, but the entities have a large number of sponsored places, in a way that the expenses from the people housed are covered by the municipal social service. In both 2012 and 2013, 121 of the places in privately-owned residential centres were sponsored in agreement with Barcelona City Council.
The promotion of inclusion flats continues because XAPSLL entities understand that the cur-rent social emergency can’t allow the quality of attention to deteriorate, and the possibilities of personalized accompaniment to people attended offered by this type of resource.
The rise in families in a situation of housing exclusion -a reality that has been discussed in previous chapters- has fostered the creation of new inclusion housing. Both the City Council and the entities have noticeably broadened the number of insertion flats during the last five years, turning this type of resource into a core element of their strategy of fighting against social exclusion.
0 200 400 600 800 1000 1200 1400 March 2008 March 2009 March 2010 March 2011 November 2011 March 2012 March 2013
Evolution of the number of nights provided in XAPSLL homeless facilities
according to ownership. Barcelona, 2008, 2013
Residential centers Flats
Residential centers Flats
Others
1) Source: Cabrera et al (2008). Qui dorm al carrer? With revisions from the entities records of XAPSLL (2) Source: XAPSLL
(3) 121 of the public places in housing centers were granted by the City Council of Barcelona, which covers the expenses on the 12th March 2012 and 12th March 2013
(4) Of the 231 places provided by private entities, 121 places were granted in agreement with Barcelona City Council. This means that the City Council has assumed the total cost of these places. This percentage represents 52% of the amount of places categorized as private.
(5) Along with the places granted, Barcelona City Council maintains several collaboration agreements with many of the private entities, in order to support financially different projects in the area of social action.
400 360 3603 70 3703 70 475 Flats7 26 77 71 04 1319 61 27
472 427 4374 74 5014 66 602
150 141 1411 42 1562 02 231 Flats1 26 177 2011 96 2852 97 312
6
276 318 3423 38 4474 99 543 Total 748 745 7798 12 9489 65 1145
Table 6.1. Places available in homeless facilities. Barcelona, 2008-2011
Type of homeless facility
March 2008 (1)
March 2009
(2) March 2010 (2)
March 2011
(2) November 2011 (2) March 2012 March 2013
Public ownership
Residential centers
Hostels no procedent
0 200 400 600 800 1000 1200 1400
March 2008 March 2010 November 2011 March 2013
Evolution of the number of nights provided in XAPSLL homeless
facilities. Barcelona, 2008, 2013.
Flats
7. Interv
en
-tIon pol
IcIes
In fIght
Ing
agaInst home
7. Intervention policies in
fighting against homelessness
7. Interv
en
-tIon pol
IcIes
In fIght
Ing
agaInst home
-lessness
Social intervention which gives support to people living in any kind of housing exclusion situation considered homelessness is only a tiny part of the policies needed to guarantee the right to housing. The homeless re-sources offered by the social services and entities of the XAPSLL provide the last emergency network for people and families immersed in poverty and social exclusion processes and the first points of support with which they can start recovering the reins of their lives. In the current context, addressing the fight against homelessness faces two great challenges: the increase in the number of people in need of support from the specialized entities and from social services to avoid sleeping rough and the difficulties in consolidating in-clusion processes in an environment lacking salaried employment opportunities, and in which incomes from subsidies and benefits are getting less and less.
Despite these difficulties, the European Commission (EC) urges the member states of the EU to launch brave and coordinated policies against housing exclu-sion. In the communication Towards Social Investment for Growth and Cohesion, the Commission states, in agreement with the current empiric evidence, that the access to stable housing is a key tool for the full devel-opment of the economical potential of people. Bringing back the idea exposed previously in this report that homelessness is a consequence and also the cause of poverty and social exclusion situations and taking into account the areas of action of XAPSLL, the proposals of the EC and the experience of the entities of the city can shape some recommendations in order to maintain a security network aimed at reducing the personal and social impact of the most severe types of social exclu-sion in our society.
Prevention:
measures for
avoiding the loss
of housing
The EC acknowledges in its official documents that homelessness prevention measures have an impor-tant social and economical return in the long term and create important savings in social services, health and legal systems and contribute to social cohesion. Dutch research carried out in 2011 (Van Leerdam), calculated that, for every euro inverted in preventing homelessness, the society got €2.20 in return. The re-search pointed out that the areas where savings were made were emergency health treatment, treatment in outpatient clinics, psychiatric services, police interven-tions, prisons, legal procedures and temporary hous-ing. Other research has confirmed the high cost-ben-efit ratios of eviction prevention policies. Calculations made in Scotland in 2010 showed that the process of re-housing a family meant an economic expenditure of £5.300 per year, whereas an intervention of mediation between landlord and renter to avoid eviction didn’t exceed £600(European Commission, 2011).