ASSESSMENT OF THE INFLUENCE DUE TO A NEW METRO
LINE ON THE PROMOTION OF BUSINESS ACTIVITIES
AROUND STATIONS: A CASE STUDY OF METROSUR IN
MADRID
Lucia Mejia Dorantes. PhD. Candidate, Transportation Department. Universidad
Politecnica de Madrid. Spain.
Antonio Paez. Associate Profesor. School of Geography & Earth Sciences. McMaster
University. Canada.
Jose Manuel Vassallo. Associate Professor, Transportation Department. Universidad
Politecnica de Madrid. Spain.
ABSTRACT
The construction of a new public transportation infrastructure in a metropolitan area has a great impact, in many different ways, on the neighborhoods surrounding the stations. The objective of this paper is to evaluate the influence that the construction of a new metro line has on the promotion of businesses (shops, offices and so on) near the stations. To that end, we have analyzed, as a case study, the construction of the new metro line, “Metrosur”, in Alcorcon, a municipality at the south east of Madrid. The analysis was carried out through two different approaches: on one hand, we used a “point pattern analysis” to estimate kernel surfaces to analyze the variation in the density of business activities during a period of ten years, from the conception of the line to four years after the line entered into operation. In the second approach, we calibrated a binary logit model to assess the probability that each location has to hold any economic activity taking into account its distance to Metrosur and other location characteristics. We found that the distance to the stations positively impacts the location of a business. Moreover, the paper demonstrates that agglomeration plays an important role in the collocation of economic activities.
INTRODUCTION
Public transportation infrastructure in urban areas has a significant impact. Banister and Berechman (2000) classify those varied effects, among other things on: transportation-related effects, land-use effects, and effects on jobs and business activities. Moreover, researchers such as Mas and Maudos (2004) have shown that transportation infrastructure does not only have significant effects on the area directly influenced by it, but also on areas close or connected to it.
Those effects can be classified as short-term and long-term (Boarnet, 2006). Short-term effects are those related to reductions in travel time for the population living or working around the infrastructure. Long-term effects are mostly those stemming from agglomeration economies caused by the existence of positive externalities that improve the efficiency of firms due to economies of scale (Fujita, 1989; Graham, 2005).
Commuter rail and metro stations often have positive rather than negative effects. A greater number of metro stations increase the accessibility to public transportation for the people living nearby and reduce their travel time to other destinations in urban areas. Similarly, business activities (both offices and shops) near the stations also enjoy some advantages. On the one hand, jobs and shops are now more accessible for those coming from any destination. On the other hand, business activities close to the stations —especially shops— can take advantage of the increase in the number of people who pass by near the shops in their way to or from the stations. Moreover, metro stations could have also negative effects caused by such externalities as greater noise and damage to the urban landscape. The effects described above depend on the type of transport infrastructure (Inc, 1998; Mas and Maudos, 2004), its location, and its specific characteristics.
Literature, both theoretical and empirical, on industrial location shows that the location of firms is not a random process, but rather the result of an analysis aimed at maximizing location benefits for individual firms, where the location decision is based on the future profits that a firm expects to earn in that location (Holl, 2004). This theory, known as the Industrial Location Theory, was first proposed by Alfred Weber (1869-1958) and it has evolved from a simple matter of transportation costs into more complex location patterns. In this respect, such authors as Mori and Nishikimi (2002) point out that there is a process of reciprocal reinforcement between industrial agglomeration and transport. In spite of that, the location of businesses does not depend only on a reliable transportation infrastructure by itself, but also on a combination of factors which include, among others: firms agglomeration, labor market characteristics, land market, and enhancement of environmental quality (Banister and Berechman, 2001). Authors suggest that agglomeration is caused by clustering of firms which eventually become employment nodes. Over the time, those nodes define urban form (Maoh and Kanaroglou, 2007).
improvements in the transportation infrastructure, such as travel time reductions that promote industrial agglomeration. However, economic development requires a social and political framework that prompts such economic growth. Banister and Berechman (2001) propose that the analysis of such a framework will include the study of:
- Political factors related to policy actions and institutional support. - Availability of funds for investment and its efficient implementation. - Economic conditions such as labor force and other positive externalities.
Some researchers point out that due to agglomeration economies and the advantages of easy access, most business activities are concentrated very close to transportation stations (Inc, 1998). However, scarce research has been proposed to evaluate in detail the benefits due to a transport infrastructure, taking into account the type of businesses affected, and demographic and economic characteristics (Vuchic, 2005). Measuring the economic impact caused by transportation infrastructure is complicated since information and data are not always available at the local or regional levels (Melo and Graham, 2009; Maoh and Kanaroglou, 2007).
The goal of this paper is to assess the effect that an increase in accessibility caused by the construction of a new metro line may have on changes in the density of business activities close to new stations. We conducted the analysis for the case study of Alcorcon, which is located at the south of Madrid, focusing on Metro line 12 (known as Metrosur). Our approach was twofold. First, we carried out the analysis from 1998 to 2007 based on a Point Pattern analysis. And second, we calibrated a binary logit model to account for the probability that each establishment has to be in use or vacant, taking into account location, demographic and other neighboring characteristics. We found that business activities have increased in neighborhoods where the original business activity had not been of great importance, that being closer to a Metrosur station positively influences the probability to locate any commercial activity within the municipality of Alcorcon and finally, that economic clusters play an important role in the location pattern. This paper contributes to the literature because it combines geostadistical techniques with discrete choice analysis for the case study of Alcorcon, a municipality within the Madrid region.
THE ROLE OF METROSUR IN THE MADRID METROPOLITAN
AREA
Characteristics of Madrid Metropolitan Area
Almost six million people live in the Madrid Metropolitan Area (MMA) (Consorcio Regional de Transportes de Madrid, 2006), which is made up of a huge economic and social pole (Madrid City with a population slightly over three million) at the centre and a set of small and medium cities around this central population pool. Those cities are connected to Madrid City through both private and public means of transportation.
In the last three decades, the municipality of Madrid itself has substantially constrained new real estate development inside Madrid City, which has prompted high real estate prices in the city. Due to this fact, some municipalities outside of, but surrounding Madrid City, have promoted large real estate developments in order to increase the supply of affordable housing. As a consequence of this, some municipalities, which four decades ago were small villages with little connection to Madrid City, became in only few years satellite cities with large populations, places where people lived who commuted everyday to Madrid City. The most impressive growth occurred in five municipalities located to the southeast of Madrid (Alcorcon, Mostoles, Leganes, Getafe and Fuenlabrada); especially remarkable if one takes into account that the population of all these municipalities is almost 1 million, whereas the population of Madrid City is slightly over 3 million.
Inhabitants (2009) 1) Alcorcon 167,997 2) Fuenlabrada 194,791 3) Getafe 164,043 4) Leganes 184,209 5) Mostoles 206,275
Total 917,315
(2)
(5) (4)
(1)
(3)
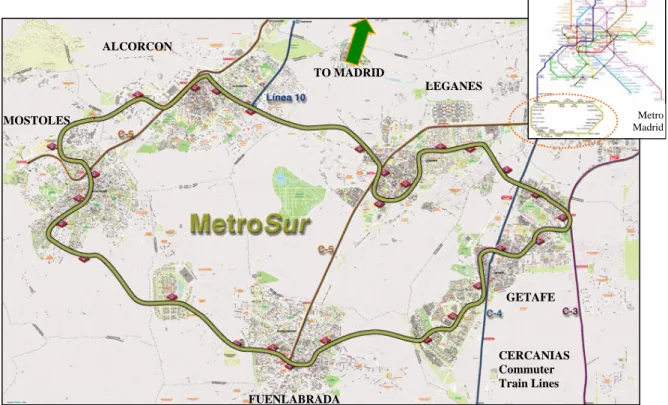
Figure 1 shows the location of these municipalities within the MMA (see the location of the different municipalities connected by Metrosur). The shaded areas represent Madrid City. The darkest shaded areas show the central districts of Madrid City, while the areas that are only slightly shaded show the outer districts of Madrid City. Until recently, the metro system of Madrid City did not extend beyond the Madrid City limits so as to reach other municipalities (shaded areas).
The urban areas of the five municipalities mentioned before are neither connected to each other, nor connected to the City of Madrid. In other words, between each city there remain large areas where there is still undeveloped land. The transportation systems in these cities used to be focused on connecting these municipalities to the City of Madrid through both commuter trains and regional buses. The public transportation networks linking these five municipalities used to be extremely poor.
One of the most important problems of those municipalities is that they are basically “dormitory” cities where most of their inhabitants commute everyday to Madrid City. Consequently, jobs and business activities are, in these municipalities themselves, noticeably scarce.
The construction of METROSUR
Owing to that fact, the Regional Government of Madrid decided to adopt some measures to promote a more balanced growth of those municipalities intending to foster economic activities through promoting greater accessibility to transportation and a better linkage among these five municipalities around Madrid City. To that end, it was decided to build a new circular metro line (named Line 12 or Metrosur) linking the five municipalities of the southeast of Madrid (Alcorcón, Móstoles, Fuenlabrada, Getafe and Leganes). The line was built entirely underground in order to minimize the negative environmental impact. This was the first time that the metro network was extended beyond Madrid City itself (see Figure 2).
ALCORCON
LEGANES
GETAFE
Figure 2 - Map of Metrosur and its connection to Madrid City
One of the most ambitious objectives of building Metrosur was that of boosting business activities in the five municipalities. The aim was to turn these municipalities from mere “dormitory” cities into cities with a better balance between population and jobs.
The Municipality of Alcorcon
Alcorcon is the closest municipality to the city of Madrid. It is served by Metrosur through four metro stations (Puerta del Sur, Parque de Lisboa, Alcorcon Central, Parque Oeste); by the
metro line 10 (L10) through the final station Puerta del Sur, which is also the transfer station
to Metrosur; by the commuter train through three stations (Las Retamas, Alcorcón Central, San José de Valderas), where Alcorcon Central is the transfer station to Metrosur; and by
different interurban buses.
FUENLABRADA TO MADRID
CERCANIAS Commuter Train Lines
L12
L12
Figure 3 – Alcorcon 2006 aerial view. It can be noticed different transport infrastructure: highways (A-5, 40, M-50, M-406, M-501) Metrosur line 12 (yellow), Metro line 10 and the commuter train Cercanias (red dot line)
(Comunidad de Madrid, 2009).
Figure 4 – Metrosur stations within Alcorcon (Melis, Arnaiz, Trabada, et al, 2003)
OBJECTIVES AND METHODOLOGY
1. To assess the location of business activities across the 1998-2007 period through kernel density surfaces and to illustrate how establishments have impacted on urban form.
2. To evaluate whether Metrosur has positively impacted on the location of business activities close to the stations or not, and to quantify its influence through a binary logit model.
3. To evaluate if firms are benefited by locating close to others, creating firm clusters.
Methodology
Our research evaluates how the location of business activities (offices, shops, industrial and so on) evolves throughout the years both before, and after, the inauguration of Metrosur and it assesses if factors such as the distance to Metrosur and its proximity to other firms influence decision of where to open any economic activity. The data about business activities was obtained from the Bureau of Statistics of the Region of Madrid. We analyze the evolution of business activity within Alcorcon over a period of ten years (1998 to 2007), from the time the construction of the metro-line was planned to four years after the inauguration of the line. This research uses two different approaches: a point pattern analysis and a binary logit model. They are detailed in the following paragraphs.
Point pattern analysis
There are different statistical methods to analyze urban patterns. One of them is the point pattern analysis, which evaluates the distribution of events over an urban area. To analyze the firm location evolution over time and its clustering, the kernel estimation method for point pattern analysis was used. Kernel surfaces are a powerful tool for the exploration of the spatial and temporal characteristics of clustering (Maoh and Kanaroglou, 2007). It generates density surfaces that show where point features are concentrated. It allows identifying zones where firms have increased or decreased its activity. In this case, the outcome is a continuous surface which represents the number of firms per square meter and its evolution from 1998 to 2007.
To conduct the analysis, we used a Geographic Information System (GIS). GIS integrates the information to be managed under one system (Cressie, 1991). GIS provides important tools for transportation research and planning because it facilitates the calculation of distances and densities (Hsiao, Lu, Sterling and Weatherford, 1997).
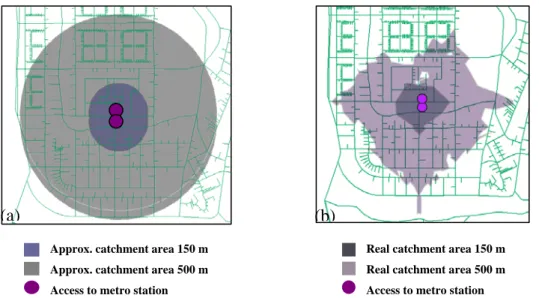
network (Gutiérrez and García-Palomares, 2008). The second and more sophisticated approach consists of calculating the walking distance over the street grid. This is the way in which the distance to the business activities (shops, offices industrial and so on) from the Metro or from other transport infrastructure have been calculated in this research. Figure 5b shows, for a Metrosur station with two exits, how the catchment areas of those who walk to the station from 150 meters up to 500 meter, have been estimated. It is notable how neither of these areas has anything to do with the concentric circles drawn according to Euclidean distance.
Figure 5 – Example of catchment areas using Euclidean distance (a) and street network (b) for 150 m and 500 m
Different analysis note that the characteristics of the street network determine the attractiveness of the stations because most of the riders access the stations by walking. For example, traditional street patterns (narrow roads with frequent crossings) enhance pedestrian access. However, newly developed areas designed for private transport (longer and wider roads, irregular patterns) limit pedestrian access to the stations (Hsiao, Lu, Sterling and Weatherford, 1997; Gutiérrez and García-Palomares, 2008).
Binary Logit Model approach
The proposed model assesses the opportunity that each location has to be in use by any firm, according to different independent variables, presented in table 1, using the information we have for the year 2007. The analysis was carried out through random utility models, specifically, a conditional logit model, developed by McFadden in 1974. The endogenous term is a dummy variable, which takes the value of 1 if the location is occupied by any type of business activity and zero otherwise. The proposed model indirectly measures if that location maximizes each business’ opportunities.
Real catchment area 150 m Real catchment area 500 m Access to metro station Approx. catchment area 150 m
Approx. catchment area 500 m Access to metro station
Yi = 1 if Yi* = Max (Y1*, Y2*,..., Ym*)
Yi = 0 otherwise
(1)
The probability that each establishment is occupied is defined by a utility function. Utility is assumed to be a random function due to the impossibility to measure differences in perception and all the relevant variables (Ben-Akiva and Lerman, 1985). Maddala (1986) explains that the utility Yi for an alternative i for each establishment n may be expressed as
the sum of a systematic utility and an error term.
( )
i i ii
V
X
Y
*=
+
ε
(2)Where Xi is the vector of attributes for the ith location, and εi is the residual that captures the
unobserved variations in the attributes of each location, tastes, and other characteristics to maximize, which are perceived by the one that makes the decision of where to locate that firm.
The residuals εi are independently and identically distributed. The function of probability is:
(
)
∑
==
=
m j V V i j ie
e
X
Y
prob
11
(3)Hence, for N firms, facing m location choices, we define:
Ykj* the level of indirect utility that a location kth has for the jth firm
Ykj = 1 if the location kth is occupied by the kth firm
Ykj = 0 otherwise
Therefore,
i k j kj
kj X Z
Y* =
β
´ +α
′ +ε
(4)Where Zt are the specific characteristics of each firm and Xkj is the vector of values of the
attributes of the jth location perceived by the kth firm. Then, the probability that a certain
location is not empty is:
(
)
∑
= ′ + ′ + = = = m t Z X Z X kj kj k t kt k j kj e e Y prob P 1 ´ ´ 1 α β α β (5)Which is the multinomial logit model. Further explanation of the conditional probability can be obtained at Maddala (1986).
A spatial distance weight matrix, W was used to obtain the business occupation vector. It accounts for the number of open establishments that each location has within a radius of 150 m. It is a measure of geographical clustering of business to analyze agglomeration economies.
Table I – Variables used in the specification of the logit model
Variable Description
OC07 1 if any type of business activity is established in 2007 in that location. 0 if it is vacant
MS Street network distance from each possible location to the closest Metrosur station entrance, squared root
CBD Street network distance from each possible location to Alcorcon downtown, squared root
CER Street network distance from each possible location to the closest commuter train station (Cercanias) entrance, squared root
INTBUS Street network distance from each possible location to the closest Interurban bus stop, squared root POPD Population density around 100m for each location, squared root
STRD Street density around 100m for each location, squared root
WOC Business occupation vector. It gives information related to how many business activities are around 150m of each location
RESULTS
In this section, we obtain the results and assess them. First, we analyze in detail the Kernel analysis. Then we show a summary of the results obtained through the Binary Logit analysis.
Business location density
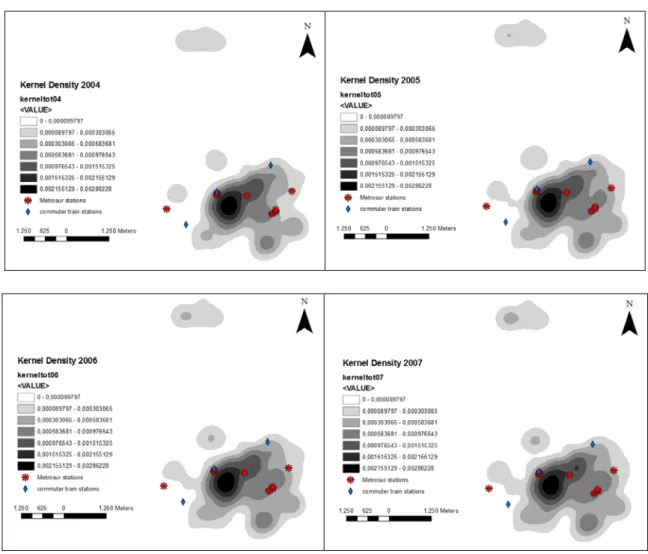
The results through kernel estimations suggest that there are important economic poles around the stations. Business activities were already located close to the stations, but as Metrosur started operating (2003) more economic activities were attracted which lead to an increase in business densities in the following years.
Figure 6 – business intensity surface for different years in Alcorcon
The characteristics of the neighborhood seem to have an important influence on the location of business activities. Neighborhoods with greater density of population are those made by apartment buildings, which are located in the core of Alcorcon. On the other hand, neighborhoods with low density of population are formed by detached-houses, in many cases not transit oriented developments (TOD) which might imply less people accessing the stations. The same happens with the street network; newly developed areas have wider streets and irregular patterns that diminish pedestrian access. That might explain why station “Parque Oeste” (which is the one at the west) presents a less significant growth than other stations in the kernel surfaces thorough the years. Even though there is an important commercial centre close to the station, since the commercial activity is spread in a bigger area the impact is less noticeable.
Binary logit model
the influence of Metrosur. The negative sign of the Metrosur distance (MS) means that the farther the location is from a Metrosur station, the less probable it is to be in use with any business activity. The variable related to population explains that the more people around each establishment, the more probable it is to be in use. The same happens with the WOC vector, which says that the more open establishments there are around each location, it has more probability to be in use.
Many tests were carried out, even using a binary probit model, however, as variables are highly correlated, the same problems arouse and the results were basically the same. For the sake of simplicity, we only present the binary logit model and results.
Table 2 – Estimation results of binary logit model
Number of obs = 6218 LRchi2 (3) = 606.28 Prob >chi2 = 0.0000 Pseudo R2 =0.0737 Log likelihood = -3812.1173
OC07 COEF STD.ERR.
MS -0.0138079 0.0026182
POPD 0.0113877 0.0011075
WOC 0.0078778 0.0010534
CONST -0.7793238 0.1195191
Spatial autocorrelation
Finally, it was verified the Spatial Autocorrelation through Moran’s I. The results were the following:
Moran’s I index= 0.24 Z Score= 112.39
The above indicates that there is an overall positive spatial correlation, and that there is less than 1% likelihood that this clustered pattern could be the result of a random choice. This result follows the same trend of WOC variable of the logit model, which explains that there is a cluster pattern because the probability of being in use is higher if there are more establishments around each point.
DISCUSSION AND CONCLUSION
a commercial location is from the closest station, the less likely it is to be occupied by any type of economic activity.
It is also shown with the logit model that more concentration of people around each point enhances the location of economic activities.
The kernel surfaces also demonstrate spatial variations in the clustering pattern among the years. They show an increase in economic activities in space which might have been triggered by the new urban transport infrastructure. It is shown that economic activities are spread out in the city, located at new neighborhoods, however the density is higher as one gets closer to downtown and around the stations. It is interesting to point out the difference with the north part of Alcorcon, where the density of establishments has not increased as much as the regions close to the stations.
The results about agglomeration both by the logit regression and Moran’s I, validate the theory about geographic clusters of economic activities due to their economic linkages at intra-metropolitan level. The more open establishments there are around each point, the more probability it has to be in use by any economic activity.
This study proves the importance of GIS tools for analysis and the importance of spatial statistics to explain the relation in urban form. It leaves many doors opened to further research. An analysis that considers the type of business activity (industrial, retail, services and so on) and their clustering would be very interesting. Similarly, an analysis of the jobs created in the area would shed plenty of light on the influence of the increase in transportation accessibility on the labor market. Finally, an analysis of the relationships among the five municipalities as a result of Metrosur can also be of great interest. Of course, the key factor to succeed with any of these analysis is the availability of detailed data.
AKNOWLEDGMENTS
The authors would like to thank Professors Javier Gutierrez & Juan Carlos Garcia from the Department of Human Geography of the Universidad Complutense de Madrid and the Bureau of Statistics of the Region of Madrid for the information shared with us that helped to carry out this research. Special thanks are due to Emilio Ortega and Belen Martin for their support on GIS. Financial support from the Ministry of Science and Innovation of Spain (TRA2006-07008) is gratefully acknowledged.
REFERENCES
Banister, D. and Berechman, Y. (2001). Transport investment and the promotion of economic growth. J.Transp.Geogr. 9. Elsevier. 3. 209-218
Ben-Akiva, M. and Lerman, S. R. (1985). Discrete choice analysis: theory and application to travel demand. MIT press.
Boarnet, M. G. (2006). Conducting impact evaluations in urban transport. Doing impact evaluation series 5. The World Bank.
Comunidad, de M. NOMECALLES. Nomenclator Oficial y Callejero. Consejería de Economía e Innovación Tecnológica. Instituto de Estadística. 2009.
Consorcio Regional de Transportes de Madrid. (2006). Encuesta domiciliaria de movilidad en día laborable de 2004 en la Comunidad de Madrid. Resumen de Resultados. CRTM.
Cressie, Noel. (1991). Statistics for spatial data. John Wiley and Sons, Inc.
Fujita, M. (1989). Urban economic theory: land use and city size/Masahisa Fujita. Cambridge University Press.
Graham, D. (2005). Transport investment, agglomeration and urban productivity. 4–6 Gutiérrez, J. and García-Palomares, J. C. (2008). Distance-measure impacts on the
calculation of transport service areas using GIS. Environment and Planning B: Planning and Design. 35. Pion Ltd, London. 3. 480-503
Holl, A. (2004). Manufacturing location and impacts of road transport infrastructure: empirical evidence from Spain. Regional Science and Urban Economics. 34. Elsevier. 3. 341-363 Hsiao, S., Lu, J., Sterling, J. and Weatherford, M. (1997). Use of geographic information system for analysis of transit pedestrian access. Transportation Research Record: Journal of the Transportation Research Board. 1604. Trans Res Board. -1. 50-59
Inc, C. S. (1998). TCRP Report 35: Economic Impact Analysis of Transit Investment: Guidebook for Practitioners. National Academy Press, Washington, DC.
Instituto Nacional de Estadística. (2008). Población por municipios de Madrid. 2009. Maddala, G. S. (1986). Limited-dependent and qualitative variables in econometrics. Cambridge Univ Press.
Maoh, H. and Kanaroglou, P. (2007). Geographic clustering of firms and urban form: a multivariate analysis. Journal of Geographical Systems. 9. Springer. 1. 29-52
Mas, M. and Maudos, J. (2004). Infraestructuras y crecimiento regional en España diez años después. Instituto de Estudios Fiscales. 143
Melo, P. and Graham, D. (2009). Estimating the spatial decay of labour market interactions using data on commuting flows. Transportation Research Record: Journal of the
Transportation Research Board. in press. Transportation Research Board of the National Academies. x-x
Mori, Tomoya and Nishikimi, Koji. (2002). Economies of transport density and industrial agglomeration. Regional Science and Urban Economics. 32. 2. 167-200