Barcelona
Data Sheet
2015
3
Table of Contents
4
Privileged location
4 Population, area and climate
5 Foreign population
6
Accessible and well
communicated
6 The Airport7 The Port of Barcelona
8
The driving force behind a
large, diversified economic
area
8 Economic activity
9 Production specialisation
10 Commitment to knowledge and creativity 12 Innovation
12 Creative industries
13
An Entrepreneurial City
13 Companies
14 Business creation 15 Property market
16
A Hub to Attract Talent
16 Jobs in Barcelona
17 Activity, employment and unemployment
17 Salaries
18 Universities and business schools
19
An Internationalised
Economy
20 Exports21 Foreign investment in Catalonia
22 Catalan investment abroad
23
Strategic
and Driver Sectors
24 Strategic sectors in the economy of Barcelona
25 Tourism
27 Commerce
28
Ambitious City Projects
28 Smart City
29
Best Quality of Life
in Europe
30 Quality of life30 Energy and the environment
32 Sustainable mobility
32 Cultural and educational facilities
33
A City Brand that adds value
34 Barcelona’s international positioning
Barcelona, central hub in a mega-region with a population of 27,000,000
The city of Barcelona, capital of Catalonia with more than 1,600,000 inhabitants, is the central hub in a 2,500-square-kilometre metropolitan region that, with nearly 5,000,000 inhabitants, represents 63.5% and 10.2% of the total populations of Catalonia and Spain, respectively.
As metropolitan regions grow nowadays, they spread beyond their boundaries to create mega-regions or polycentric agglomerations of cities as natural units of economic influence in a given geographic area. One such mega-region in southern Europe is that formed by the Barcelona-Lyon corridor, which has a total population of 27.3 million people and generates production of more than 700,000 million euros per year, positioning it in 6th and 5th place in terms of population and wealth, respectively, among the twelve European mega-regions.
Compared to the consolidated metropolitan agglomerations, the population of Barcelona Metropolitan Region is approximately one-quarter of that of New York, but is higher than those of Boston, Berlin and Montreal, for example.
Barcelona’s diverse, cosmopolitan and intercultural spirit is illustrated by the fact that nearly 16.3% of the city’s residents are foreign nationals.
Population, area and climate
FIGURES ON POPULATION AND AREA
POPULATION JANUARY 2014 (INHABITANTS)
POPULATION AS A PERCENT-AGE OF THE TOTAL FOR
SPAIN (%) AREA (KM2) (HAB./KMDENSITY 2)
Barcelona 1,602,386 3.4% 102.2 15,685.1
Metropolitan
Region* 4,774,561 10.2% 2,464.4 1,937.4 Catalonia 7,518,903 16.1% 32,108.0 234.2 Spain 46,771,341 100.0% 505,968.4 92.4
* Barcelonès, Baix Llobregat, Maresme, Vallès Oriental and Vallès Occidental counties SOURCE: Barcelona City Council Department of Statistics, Idescat, INE
DEMOGRAPHIC INDICATORS FOR BARCELONA, 2014
Age structure
0-14 years 12.5%
15-64 years 66.0%
65 years and over 21.5%
Life expectancy (2013) 83.8
Men 80.7
Women 86.6
Birth rate (2014) 8.4‰
Mortality rate (2014) 9.3‰
Fertility rate (2013)
Births per 1,000 women aged 15-49 years 36.2‰
SOURCE: Barcelona City Council Department of Statistics and Idescat
CLIMATE INDICATORS FOR BARCELONA, 2014
Annual mean temperature 18.3 ºC
Maximum extreme temperature 33.0 ºC
A Privileged
location
Foreign population
PERCENTAGE OF FOREIGN NATIONALS OVER TOTAL POPULATION
20%
18%
16%
14%
12%
10%
8%
6%
4%
2%
0%
2000 2005 2007 2009 2011 2013 2014 2015
NOTE: Figures at January 1st each year
SOURCE: Barcelona City Council Department of Statistics
FOREIGN NATIONALS IN BARCELONA BY CONTINENT OF ORIGIN (January 2015)
America Africa Europe Asia Oceania
SOURCE: Barcelona City Council Department of Statistics POPULATION OF 20 METROPOLITAN AREAS AROUND THE WORLD*
METROPOLITAN AREA POPULATION
Tokyo 37,843,000
Shanghai 23,416,000
New York 20,630,000
Mexico City 20,063,000
Los Angeles 15,058,000
Buenos Aires 14,122,000
Paris 10,858,000
London 10,236,000
Hong Kong 7,246,000
Toronto 6,456,000
Madrid 6,454,440
San Francisco 5,929,000
Milan 5,257,000
Barcelona 4,774,561
Boston 4,478,000
Berlin 4,069,000
Sidney 4,036,000
Montreal 3,536,000
Seattle 3,218,000
Stockholm 1,484,000
* Estimate updated May 2014. For Barcelona and Madrid, official population figures at 1st January 2014
SOURCE: Demographia World Urban Areas: 11th Annual Edition (2015.01), INE and Idescat
31.9%
7.4% 37.2%
23.3% 0.1%
1.9%
14.2% 15.6% 18.1%
17.3% 17.4% 16.7% 16.3%
2
,
636
annual sunshine16
.
3
%
Accessible
and well
communicated
As regards infrastructure providing access to the city, in 2014 El Prat International Airport handled a record 37.6 million passengers, enabling Barcelona to remain in tenth place amongst the major European airports, according to the Airport Council International ranking. International passenger traffic is particularly intense at Barcelona’s airport, and for the third consecutive year this activity accounted for more than two-thirds of its total activity in 2014 (72.5%).
In 2014, activity in the Port of Barcelona reached 1.9 million TEUs and 45.3 million tons transported, with both figures marked by a year on year increase of more than 9%, in line with the excellent
performance of foreign trade. Moreover, in 2013, the Port of Barcelona occupied 16th place in the ranking of European ports for container traffic.
In 2014, Barcelona received 2.36 million cruise passengers, and was the leading cruise base in Europe and the Mediterranean for the 13th consecutive year, as well as fourth base port in the world in 2013.
The inclusion of the Mediterranean railway corridor in the basic trans-European transport network will enable direct communications to be established between the Mediterranean ports and the rest of Europe, and represents a strategic opportunity for the Port of Barcelona to increase its market share in the traffic of goods from Asia.
The Airport
BARCELONA AIRPORT
2013 2014
Total passengers 35,216,828 37,559,044
Goods (in tons) 100,288 102,706
SOURCE: Spanish Airports and Air Navigation (AENA)
LEADING EUROPEAN AIRPORTS BY VOLUME OF PASSENGERS
CITY (AIRPORT) PASSENGERS 2014
London Heathrow (LHR) 73,371,195
Paris Roissy (CDG) 63,813,756
Frankfurt (FRA) 59,566,132
Istanbul (IST) 56,954,790
Amsterdam (AMS) 54,978,023
Madrid (MAD) 41,833,374
Munich (MUC) 39,716,877
Rome-Fiumicino (FCO) 38,506,467
London Gatwick (LGW) 38,094,845
Barcelona (BCN) 37,559,044
SOURCE: Airports Council International. Airport Traffic Report, 2014 and Barcelona Committee for the Development of Air Routes (CDRA)
BARCELONA AIRPORT. INTERNATIONAL FLIGHTS BY REGION, 2014
REGION DESTINATION AIRPORTS FLIGHTS WEEKLYNUMBER OF DIRECT PASSENGERSNUMBER OF TOTAL
North America 7 60 865,982
Africa 11 87 285,711
Middle East 5 41 804,361
South America 3 14 963,416
Asia 4 11 154,676
BARCELONA - MADRID AVE (HIGH-SPEED TRAIN)
2012 2013 2014
Passengers (thousands) 2,688.6 3,117.4 3,527.7
Trip time 2 hours 30 minutes
EUROPEAN RANKING OF PORTS BY CONTAINER TRANSPORT, 2013
2013 RANKING CITY PORT TEU* 2013
1 Rotterdam 11,621,249
2 Hamburg 9,302,219
3 Antwerp 8,578,269
4 Bremen 5,830,711
5 Algeciras 4,500,600
6 Valencia 4,327,838
7 Felixstowe 3,740,000
8 Ambarli (Istanbul) 3,378,000
9 Piraeus 3,163,755
10 Gioia Tauro 3,087,000
11 Marsaxlokk 2,750,000
12 St. Petersburg 2,515,000
13 Le Havre 2,486,000
14 Zeebrugge 2,026,270
15 Genoa 1,988,013
16 Barcelona 1,720,383
17 Southampton 1,491,270
18 Mersin 1,378,000
19 La Spezia 1,298,012
* TEU: Measurement of capacity used in international shipping, equivalent to a 20-foot container SOURCE: Containerisation International, Top 100 container ports 2014
The Port of Barcelona
INDICATORS, PORT OF BARCELONA
2013 2014
TRAFFIC (FIGURES IN MILLIONS)
Goods (tons) 41.5 45.3
Containers (TEU*) 1.7 1.9
Passengers 3.6 3.5
INFRAESTRUCTURE
Terrestrial area (ha.) 1,081
Docks and moorings (km.) 22
* TEU: Measurement of capacity used in international shipping, equivalent to a 20-foot container SOURCE: Barcelona Port Authority
CRUISE INDICATORS
2014
Cruise passengers 2,364,292
Embarking 615,377
Disembarking 607,112
In transit 1,141,803
Cruiser stops 764
SOURCE: Barcelona Port Authority
10
th
European airport in number of passengers1
st
cruise port baseThe driving force behind
a large, diversifi ed
economic area
Barcelona is internationally recognised as a powerful economic driver with a highly diversifi ed structure
The city’s international positioning and the strength of the Barcelona brand are assets that, in an economic environment like the present, are key to increasing the Catalan capital’s capacity to attract businesses, jobs, talent and foreign investment.
In 2012, the gross domestic product (GDP) of the city of Barcelona reached 64,241,5 million euros, with GDP per inhabitant of 40.1 thousand euros. In the distribution of added value by sector – according to estimates made in 2012 – the outstanding sectors were the collective services of education, health and social services (which accounted for 11.9% of the total), followed by commerce and repairs (11.7%), services to companies (11.3%), hotels and catering (9.1%) and information and communication (7.3%).
In 2014, Catalonia generated GDP of 209,282 million euros, representing 19.8% of total Spanish GDP. Per capita GDP in the Principality in 2014 was 15% higher than the European Union average.
Barcelona continues to have an important industrial sector, which employs 8.1% of salaried workers. Moreover, Barcelona’s metropolitan region – with 14.8% employed by industry – accounts for more than half (61.3%) of such jobs in Catalonia. The particularly outstanding clusters here are automobiles (Catalonia is one of the biggest manufacturers in Europe), pharmaceuticals and chemicals, food and drink, electrical material and equipment, paper and graphic arts, and waste
Economic activity
GROSS DOMESTIC PRODUCT AT MARKET PRICES (GDP)* 2012 (current prices million €)
GDP PM GDP MP PER INHABITANT
MILLION EUROS THOUSAND EUROS CATALONIA = 100INDEX
Barcelona 64,241.5 40.1 145.3
Barcelona
Metropolitan Region 141,498.7 29.7 107.8
* GDP 2012. Base 2010. Valuation at market prices. SOURCE: Statistical Institute of Catalonia
GROSS DOMESTIC PRODUCT AT MARKET PRICES (current prices million €)
CATALONIA SPAIN % CAT/ESP
2011 209,716 1,075,147 19.5
2012 206,920 1,055,158 19.6
2013 206,617 1,049,181 19.7
2014 209,282 1,058,469 19.8
SOURCE: Statistical Institute of Catalonia
GDP PER CAPITA, 2014
Base LINE EU = 100 (purchasing power parity*)
150
130
110
90
70
50
Catalonia Spain Eurozone
INDEX (EU 28 = 100)
* Harmonised GDP
SOURCE: Statistical Institute of Catalonia and Eurostat
115
93 107
19
.
8
%
of totalProduction specialisation
PRODUCTION STRUCTURE. PERCENTAGE WAGE EARNERS BY ECONOMIC SECTOR, 2014*
BARCELONA BMR CATALONIA SPAIN
Agriculture 0.0 0.1 0.3 0.4
Industry 8.1 14.8 17.0 14.4
Construction 2.6 3.6 4.2 4.9
Services 89.3 81.6 78.5 80.2
TOTAL 100.0 100.0 100.0 100.0
* Fourth quarter data
SOURCE: Department of Statistics of Barcelona City Council and National Social Security Institute
COMPANY STRUCTURE BY ECONOMIC SECTOR, 2014 (% of total)
Business services* 26.2%
Commerce and repairs 19.5%
Education, health
and social services 10.0%
Construction 8.7%
Real estate activities 7.6%
Hotels and catering 6.4%
Transport and storage 5.0%
Other services 4.7%
Information and
communications 3.6%
Industry 3.2%
Art, culture and leisure
activities 2.7%
Financial activities and
insurance 2.1%
Energy and water 0.4%
* Business services include professional, scientific, technical, and administrative activi-ties, along with auxiliary services
SOURCE: Central Business Directory, National Statistics Institute BARCELONA. GROSS VALUE ADDED (GVA*) BY BRANCH OF
ACTIVITY 2012
PERCENTAGE/ TOTAL (%)
Commerce 11.7%
Professional, technical and
administrative activities 11.3%
Hotels and catering 9.1%
Other sectors 8.3%
Information and
communication 7.3%
Health and Social Services 6.7%
Financial activities and
insurance 6.6%
Public administration 5.8%
Construction 5.7%
Education 5.2%
Transport and storage 5.0%
Real estate activities
(without declared income) 4.4%
Metallurgy, machinery, and electrical and transport
material 3.5%
Artistic and recreational
activities 2.7%
Other industrial sectors 2.6%
Chemicals and
pharmaceuticals 2.5%
Mining, energy, water and
waste 1.5%
* GVA 2012
Commitment to knowledge and
creativity
R&D SPENDING AS A PERCENTAGE OF GDP IN CATALONIA AND SPAIN, 2003-2014*
1.60
1.40
1.20
1.00
0.80
0.60
2003 2004 2005 2006 2007 2008 2009 2010 2011 2012 2013 2014
SPAIN CATALONIA
* From 2003 to 2008, GDP with base year 2000. From 2009 to 2011, GDP with base year 2008. From 2012 on, GDP with base year 2010
SOURCE: INE Statistical Institute of Spain
SCIENTIFIC AND TECHNICAL FACILITIES OF INTERNATIONAL STANDING IN BARCELONA
Barcelona Supercomputing Centre (BSC-CNS)
Maritime Research and Experimentation Wave Flume (CIEM) Supercomputing Centre of Catalonia (CESCA)
Barcelona Nuclear Magnetic Resonance Laboratory (LRB)
White Room of the Institute of Microelectronics of Barcelona (IMB-CNM) ALBA Synchrotron CELLS
National Centre for Genome Study (CNAG)
SOURCE: Ministry of Education and Science, Map of Outstanding Science and Technology Facilities
Barcelona leads Spain’s advance towards a knowledge economy
At the end of 2014, 29.7% of companies and 54.1% of salaried workers in the city were engaged in knowledge-intensive sectors. The city is the main centre for such activities in Catalonia, accounting for 44.1% of jobs and more than one-third of all companies (34.9%) in these sectors.
In 2014, the Barcelona area topped the Spanish ranking in applications for utility models, with 18.5% of the total, whilst the Catalan capital also accounted for 13.2% of total patents in Spain. Moreover, Catalonia is home to the largest number of innovative companies in Spain (24.1%) and generates 24.1% of total spending on innovative activities in the entire State.
According to a study drawn up by the Polytechnic University of Catalonia based on the Science Citation Index, in 2014 Barcelona occupied fourth place in Europe and eleventh place in the world in terms of scientific production. R&D spending in Catalonia was the equivalent of 1.47% of GDP in 2014, whilst 43,898 workers are engaged in research and development in the Principality.
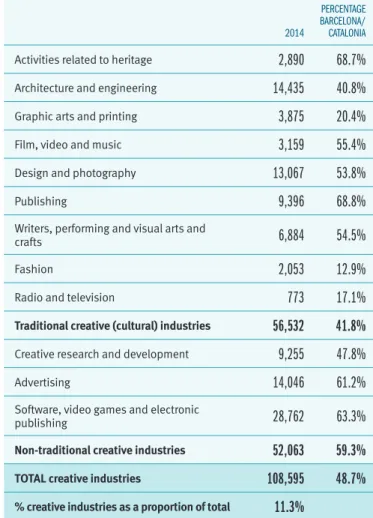
Moreover, figures drawn up in 2014 show that creative activities generate more than 108,000 jobs and account for nearly 7,800 companies with employees in Barcelona, a figure that represents 11.3% of employed people and 10.9% of businesses in the city. The Catalan capital is home to 46.8% of creative companies and 48.7% of jobs in the creative sector in the entire Principality. It is also notable that, according to the most recent urban research, a higher percentage of people employed in the creative industries is closely linked to higher production rates per inhabitant.
1.38
1.33 1.35
1.42 1.48
1.61 1.70 1.66 1.56
1.51 1.50 1.47
1.10 1.06 1.12
1.20 1.27
1.35 1.39 1.40 1.36 1.30 1.24 1.23
54
.
1
%
of salaried workers engagedLEADING CITIES IN THE WORLD FOR SCIENCE PRODUCTION, 2014
CITY RANKINGWORLD EUROPEAN RANKING
Beij ing 1 —
London 2 1
Shanghai 3 —
Seoul 4 —
Tokyo 5 —
New York 6 —
Boston 7 —
Paris 8 2
Madrid 9 3
Toronto 10 —
Barcelona 11 4
Baltimore 12 —
Cambridge-Ma 13 —
Chicago 14 —
Los Angeles 15 —
Moscow 16 5
Philadelphia 17 —
Sao Paulo 18 —
Houston 19 —
Rome 20 6
FONT: Polytechnic University of Catalonia - Centre for Land Valuation Policy
4
th
European city in science production
11
th
Innovation
INNOVATION INDICATORS
PATENT APPLICATIONS APPLICATION FOR UTILITY MODELS
2014 %/TOTAL SPAIN 2014 %/TOTAL SPAIN
Barcelona* 400 13.2 498 18.5
Catalonia 516 17.0 633 23.5
Spain 3,031 100.0 2,689 100.0
* Province
SOURCE: Spanish Office for Patents and Marks
COMPANIES AND INNOVATION
NUMBER OF
INNOVATIVE COMPANIES INNOVATIVE ACTIVITIES TOTAL SPENDING ON
2014 %/TOTAL SPAIN (THOUSAND €)2014 %/TOTAL SPAIN
Catalonia 3,801 24.1 3,118,847 24.1
Spain 15,748 100.0 12,959,842 100.0
SOURCE: National Statistics Institute
Creative industries
JOBS IN CREATIVE INDUSTRIES IN BARCELONA, 2014
2014
PERCENTAGE BARCELONA/
CATALONIA
Activities related to heritage 2,890 68.7% Architecture and engineering 14,435 40.8% Graphic arts and printing 3,875 20.4%
Film, video and music 3,159 55.4%
Design and photography 13,067 53.8%
Publishing 9,396 68.8%
Writers, performing and visual arts and
crafts 6,884 54.5%
Fashion 2,053 12.9%
Radio and television 773 17.1%
Traditional creative (cultural) industries 56,532 41.8%
Creative research and development 9,255 47.8%
Advertising 14,046 61.2%
Software, video games and electronic
publishing 28,762 63.3%
Non-traditional creative industries 52,063 59.3%
TOTAL creative industries 108,595 48.7%
% creative industries as a proportion of total 11.3%
NOTE: Salaried workers and self-employed according to Social Security data (figures for the fourth quarter).
SOURCE: Compiled by the Department of Studies of the Economy, Business and Employ-ment Area based on figures from the GovernEmploy-ment of Catalonia Business and EmployEmploy-ment Observatory
24.1
%
Companies
COMPANIES
2013 2014 %/TOTAL SPAIN (2014)
Created
City of Barcelona 7,067 7,221 7.7
Barcelona province 14,221 14,072 14.9
Catalonia 17,708 17,665 18.8
Spain 93,363 94,152 100,0
Dissolutions
Barcelona province 1,711 1,397 6.4
Catalonia 3,013 2,460 11.3
Spain 24,616 21,850 100.0
SOURCE: National Statistics Institute
COMPANIES IN BARCELONA BY NUMBER OF EMPLOYEES, January 2014
BARCELONA % TOTAL BARCELONAPROVINCE % TOTAL
Without employees 94,697 56.6 245,989 56.6 With employees:
From 1 to 199
employees 72,275 43.1 188,006 43.2 More than 199
employees 467 0.3 919 0.2
TOTAL companies 167,439 100.0 434,914 100.0
SOURCE: Central Business Directory, National Statistics Institute
An Entrepreneurial
City
Barcelona is a centre of dynamic, flexible business activity
Some 434,914 companies (nearly 14% of the total in Spain) have their headquarters in the Barcelona area. Most of these firms are SMEs, small and medium-sized enterprises characterised by their great flexibility and capacity to adapt to complex environments.
The early stage Entrepreneurial Activity rate (TEA) amongst the resident population (18-64 years) in Barcelona province stood at 7.3% in 2014, higher than the rates in such countries as Sweden (6.7%), Germany and France (5.3% in both cases), and above the Spanish average (5.5%) and that of EU economies based on innovation (6.9%).
In 2014, a total of 7,221 new businesses were created in Barcelona, the highest number in the last six years, representing a 12.5% increase on 2011. At provincial level, Barcelona tops the ranking of large urban areas in Spain with regard to this indicator, with a ratio of 4.1 businesses created per thousand inhabitants.
The city aspires to create an environment of confidence to encourage the development of economic and business activity. Key factors in this context include the creation of a zone for entrepreneurs to promote the creation of businesses in the “mobile” ecosystem (mobile technologies). Moreover, Barcelona City Council enjoys a healthy financial situation and applies rigorous economic and budgetary management that guarantees payment to suppliers within a maximum of 30 days.
Barcelona is a leading centre for the social
Business creation
ENTREPRENEURIAL ACTIVITY IN EUROPEAN COUNTRIES, 2014 (% population aged 18-64 years)
Lithuania 11.3
Romania 11.3
Slovakia 10.9
UK 10.7
Portugal 10.0
Netherlands 9.5
Estonia 9.4
Hungary 9.3
Poland 9.2
Austria 8.7
Croatia 8.0
Greece 7.9
EU average 7.8
Catalonia 7.5
Barcelona* 7.3
Luxembourg 7.1
Sweden 6.7
Ireland 6.5
Slovenia 6.3
Finland 5.6
Denmark 5.5
Spain 5.5
Belgium 5.4
Germany 5,3
France 5,3
COMPANIES IN BARCELONA BY NUMBER OF EMPLOYEES
BARCELONA BARCELONA PROVINCE
More than 199 employees From 1 to 199 employees Without employees
SOURCE: Central Business Directory, National Statistics Institute
COMPANY HEADQUARTERS, January 2014
NUMBER OF COMPANIES %/TOTAL SPAIN
Barcelona 167,439 5.4
Barcelona province 434,914 13.9
Catalonia 576,565 18.5
Spain 3,119,310 100.0
SOURCE: Central Business Directory, National Statistics Institute
COMPANIES BY KNOWLEDGE INTENSITY, 2014*
BARCELONA %/TOTAL CATALONIA %/TOTAL
High-technology
industrial sectors 165 0.2 693 0.3
Medium-high technology
industrial sectors 545 0.8 4,103 1.7
Knowledge intensive
services 20,575 28.7 56,158 23.1
TOTAL knowledge
intensive companies 21,285 29.7 60,954 25.1
Other companies 50,288 70.3 182,063 74.9
TOTAL companies in
the city 71,573 100.0 243,017 100.0
* Figures for fourth quarter
SOURCE: Government of Catalonia Business and Employment Observatory
0.2%
56.6% 43.2%
0.3%
43.1%
Barcelona offers competitive real estate for business
The goal of the Barcelona-Catalonia initiative, launched by the Government of Catalonia and Barcelona City Council, is to jointly promote the development of new economic activities in the main sectors of the knowledge economy. These projects are located near major infrastructures that are intensive in both knowledge and mobility, comprise a total area of nearly 7 million square metres and have the capacity to generate more than 200,000 new jobs.
According to the global ranking published by Mercer Human Resource Consulting, Barcelona was in 124th position amongst the world’s cities in terms of cost of living in 2015. This was due, in the main, to the strength of the US dollar against the euro and to falling interest rates. Accordingly, Barcelona remains outside the top 50 most expensive cities in the world for the fifth consecutive year, while prices of commercial and office space and industrial land remain stable, with some price increases for commercial premises in prime areas. We can therefore conclude that Barcelona continues to be highly competitive for all uses compared to other reference cities in Europe, the Middle East and Africa.
Property market
OFFICE MARKET, 4th quarter 2014
Total office stock 5,916,592 m2
Office space available 759,099 m2
Vacancy rate 12.83%
SOURCE: On point, Jones Lang LaSalle
OFFICE PRICES, 4th quarter 2014
Prime line
(Pg. Gràcia-Diagonal) Business district (consolidated centre) New business areas Periphery (Sabadell, Sant Cugat, Esplugues, etc.)
4 6 8 10 12 14 16 18 20
SOURCE: On point, Jones Lang LaSalle
AVERAGE PRICES OF HOUSING IN BARCELONA, 4th quarter 2014
Rental (€/m2/month) 10.2
Second-hand housing sales (€/m2) 3,188
New housing sales (€/m2) 3,845
SOURCE: Barcelona City Council Department of Statistics and idealista.com
5,5-8€ m²/month
8,25-14,75€ m²/month 8,75-15,25€ m²/month 13-17,75€ m²/month
87
,
2
%
Barcelona’s employment market has critical mass and qualified human capital
There are nearly one million jobs in the city and more than 2.2 million in the Barcelona area. Rates of activity (80.9%) and employment (67.6%) in Barcelona are higher than the Catalan, Spanish and European averages.
More than half the jobs in Barcelona (54.1%) are in knowledge-intensive activities, and the city itself is a hub for this segment of the economy in Catalonia. Indeed some 44.1% of knowledge-intensive jobs in the Principality are found in the capital, although Barcelona accounts for 36.5% of salaried employees in Catalonia.
Today, Barcelona has an employment market with critical mass in sectors of high added value: according to figures for 2013, Catalonia is the ninth European region as regards workers employed in high and medium-high technology manufacturing and for personnel in the field of science and technology. The city also occupies fifteenth place as regards knowledge-intensive high-technology service sectors.
Catalonia has 12 universities, attended by a total of more than 244,000 students. Meanwhile, Barcelona’s metropolitan area accounts for 88.8% of those enrolled at the city’s 8 universities, including both public and private centres. These universities offer 434 official master’s degree courses on which 30,947 students are enrolled, whilst there were more than 21,000 foreign university students in Catalonia in the 2013-2014 academic year.
In 2013, the percentage of workers with university studies in Catalonia rose to 41.8% (total population)
As regards training, Barcelona is notable as the only city with two centres placed amongst the seven best business schools in Europe, as IESE and ESADE occupy third and seventh place on the continent, as well as occupying seventh and nineteenth positions in the world ranking respectively, according to the Global MBA 2015 ranking published by The Financial Times.
Jobs in Barcelona
WORKERS AFFILIATED TO SOCIAL SECURITY, 2014*
TOTAL %/SPAIN
Barcelona 993,512 5.97
Barcelona province 2,241,525 13.46
Catalonia 2,944,870 17.68
Spain 16,651,884 100.0
* Figures for fourth quarter
SOURCE: Government of Catalonia Business and Employment Observatory
% WORKERS TERTIARY EDUCATION*, 2013
WOMEN TOTAL
Catalonia 46.36% 41.76%
Spain 45.66% 41.59%
European Union 36.97% 33.47%
* % of the employed population between 25 and 64 years with university degree SOURCE: Eurostat
A Hub to Attract
Talent
67
.
6
%
EMPLOYEES ACCORDING TO KNOWLEDGE INTENSITY, 2014* (%/total)
Barcelona Catalonia
High-technology industries Medium-high technology industries Knowledge intensive services Other salaried employees
* Figures for fourth quarter
SOURCE: Government of Catalonia Business and Employment Observatory
Activity, employment and
unemployment
ACTIVITY, EMPLOYMENT AND UNEMPLOYMENT RATES* 4th quarter 2014 (in %)
ACTIVITY RATE EMPLOYMENT RATE UNEMPLOYMENT RATE
Barcelona 80.9 67.6 16.4
Catalonia 79.1 63.3 20.0
Spain 75.6 57.6 23.8
European Union 72.5 65.2 9.9
* Specific rates (16-64 years)
SOURCE: Labour Force Survey and Eurostat
1% 1%
3% 5%
39% 55%
50% 46%
Salaries
SALARY LEVELS IN THE WORLD’S CITIES, 2015
GROSS SALARY
(NEW YORK = 100) CITY (NEW YORK=100)NET SALARY
131.3 Zurich 141.8
130.1 Geneva 135.2
85.2 Chicago 84.5
77.4 Montreal 78.2
75.5 London 72.3
68.5 Vienna 69.7
67.7 Munich 68.2
62.8 Paris 67.1
70.1 Tokyo 66.5
58.6 Lyon 62.8
92.2 Copenhagen 56.8
60.0 Rome 54.2
65.3 Amsterdam 53.3
49.4 Hong Kong 51.3
51.7 Barcelona 46.8
29.8 Athens 28.2
BEST EUROPEAN BUSINESS SCHOOLS, 2015
EUROPEAN
RANKING WORLD RANKING BUSINESS SCHOOL CITY
1 2 London Business School London
2 4 Insead Fontainebleau
3 7 IESE Business School Barcelona
4 12 IE Business School Madrid
5 13 University of Cambridge: Judge Cambridge
6 16 HEC Paris Paris
7 19 ESADE Business School Barcelona
8 20 IMD Lausanne
9 22 University of Oxford: Saïd Oxford
10 26 SDA Bocconi Milan
11 34 Imperial College Business School Londres 12 35 Manchester Business School Manchester
13 36 The Lisbon MBA Lisbon
14 38 Warwick Business School Coventry 15 45 Rotterdam School of Management, Erasmus University Rotterdam 16 45 Cranfield School of Management Cranfield 17 45 City University: Cass London 18 50 Lancaster University Management School Lancaster 19 55 Mannheim Business School Mannheim 20 63 ESMT - European School of Man-agement and Technology Berlin
SOURCE: Financial Times, Global MBA Ranking 2015
Universities and business schools
TRAINING AND UNIVERSITIES (2013-2014)
Total number of university students in Catalonia* 244,277 Total number of university students in the Barcelona
area* 199,879
Number of Masters offered by the universities in the
Barcelona area 434
Number of Master and PhD students at universities in
the Barcelona area 31,707
Foreign students at Catalan universities 21,227 Foreign students on Master and PhD courses at
Catalan universities 11,125
* Including MA students
An Internationalised
Economy
Barcelona has an open economy, one that is connected to the world
In 2014, exports from Barcelona province reached 47,057.3 million euros, a new record according to historical data available. Following the stabilisation that took place the previous year, sales to the exterior flourished, growing by 2.7% year on year and
performing particularly well in the second half of the year thanks in part to the expansive measures taken by the European Central Bank, the depreciation of the euro and improved competitiveness.
The Barcelona area continues to lead the ranking for exports in Spain, accounting for nearly one-fifth (19.6%) of total sales to the exterior. Moreover, there are 41,951 exporting companies in Barcelona, representing 28.4% of the total for Spain as a whole.
The attractiveness of Barcelona as a territory for foreign investment is confirmed by several prestigious rankings. According to KPMG’s 2015
Global Cities Investment Monitor, over the 2010-2014 period Barcelona reached tenth position amongst urban areas in the world for attracting foreign direct investment, with a total of 502 greenfield foreign investment projects (those without local partners or in new locations). Moreover, the European Cities and Regions of the Future 2014/15 Report, drawn up by FDI Intelligence and published in 2015, ranks Barcelona seventh best city in Europe
in terms of its future prospects, while the recent Global Cities and Regions of the Future 2014/2015, compiled by FDI and published in 2015, places Barcelona sixth in the world and third in Europe in the ranking of the top 25 urban areas in terms of strategies for attracting foreign investment. Similarly, Ernst and Young’s Attractiveness Survey Europe 2015 shows Catalonia and the Barcelona area in fourth place on the continent in terms of numbers of international investment projects attracted. Moreover, the Principality leads the field in terms
investments, with 7,089 new jobs and accounts for 47% of these projects established in Spain.
More than 5,700 foreign companies have their headquarters in Catalan territory. The main countries of origin of these enterprises are Germany (14.6%), France (12.7%) and the USA (10.9%).
Moreover, when it comes to establishing headquarters in Spain, Catalonia is the location chosen by most companies from the United States (86%), Japan (80%), Italy (80%), Denmark (69%), Austria (68%), France (64%) and Switzerland (51%).
10
th
urban area in the world for attracting
Exports
EXPORTS. (in million €)
2012 2013* 2014* /SPAIN 2014PERCENTAGE
Barcelona** 45,444.3 45,828.8 47,057.3 19.6
Catalonia 58,853.2 58,957.2 60,194.5 25.1 Spain 226,114.6 235,814.1 240,034.9 100.0
* Provisional figures ** Figures for the province
SOURCE: Ministry of Economy and Competitiveness
EXPORTS FROM THE BARCELONA PROVINCE, 1995 - 2014 (in million €)
50.000 45.000 40.000 35.000 30.000 25.000 20.000 15.000 10.000
1995 1996 1997 1998 1999 2000 2001 2002 2003 2004 2005 2006 2007 2008 2009 2010 2011 2012 2013 2014*
* Provisional figures
SOURCE: Ministry of Economy and Competitiveness
MAIN COUNTRIES TO WHICH BARCELONA (PROVINCE) EXPORTS, 2014 (percentages of the total)**
France 14.9%
Germany 11.2%
Italy 7.5%
Portugal 6.8%
United Kingdom 5.9%
Switzerland 4.0%
United States 3.2%
Netherlands 2.9%
China* 2.3%
Turkey 2.0%
* Includes China, Hong Kong and Macao ** Provisional figures
SOURCE: Ministry of Economy and Competitiveness
DISTRIBUTION OF EXPORTS FROM BARCELONA PROVINCE ACCORDING TO TECHNOLOGY LEVEL, 2014*
High-level technology Medium-high level technology Medium-low level technology Low-level technology Unclassified
* Provisional figures SOURCE: Ministry of Economy and Competitiveness
DISTRIBUTION OF SPANISH EXPORTS ACCORDING TO TECHNOLOGY LEVEL, 2014*
High-level technology Medium-high level technology Medium-low level technology Low-level technology
11.3% 1.9%
48.6% 14.7%
23.4%
8.0% 4.4%
25.9%
Foreign investment in Catalonia
FOREIGN INVESTMENT (in million €)
2012 2013 2014*
Catalonia 2,676.0 3,485.5 3,025.3
Spain 14,661.9 16,823.6 19,169.8
* Provisional figures
NOTE: Total gross investment without Foreign-Securities Holding Companies (ETVE) SOURCE: Datainvex. Ministry of Economy and Competitiveness
FOREIGN INVESTMENT IN CATALONIA BY COUNTRY OF ORIGIN, 2014 (percentage of the total)
France 28.4%
Mexico 18.3%
Luxembourg 16.3%
Germany 6.9%
Israel 6.8%
United States 3.7%
Netherlands 3.5%
Japan 3.1%
Belgium 1.9%
United Kingdom 1.5%
Andorra 1.2%
Italy 1.2%
NOTE: Total gross investment without Foreign-Securities Holding Companies (ETVE) SOURCE: Datainvex. Ministry of Economy and Competitiveness
Main European countries of origin of foreign companies located in Catalonia
NUMBER OF FOREIGN COMPANIES ESTABLISHED IN CATALONIA
COUNTRY OF ORIGIN 2014 %/TOTAL
Germany 835 14.6
France 726 12.7
United States 625 10.9
Netherlands 599 10.5
Italy 551 9.7
United Kingdom 372 6.5
Switzerland 295 5.2
Luxembourg 285 5.0
Denmark 194 3.4
Portugal 134 2.3
Japan 131 2.3
Belgium 127 2.2
Austria 103 1.8
Other 731 12.8
TOTAL 5,708 100
SOURCE: Invest in Catalonia. Acció10
France
12
.
7
%
Netherlands
10
.
5
%
Germany
Catalan investment abroad
INVESTMENT ABROAD (in million €)
2012 2013 2014* % CAT/SPAIN
Catalonia 2,342.4 2,381.6 3,649.9 14.8 Spain 15,735.4 18,849.2 24,734.6 100.0
* Provisional figures
NOTE: Total gross investment without Foreign-Securities Holding Companies (ETVE) SOURCE: Datainvex. Ministry of Economy and Competitiveness
DESTINATION OF CATALAN INVESTMENT ABROAD, 2014 (percentage of the total)
United Kingdom 37.4%
Ireland 27.3%
United States 11.9%
Other 5.9%
Italy 4.0%
Colombia 3.2%
Hong Kong 3.0%
Netherlands 2.6%
Luxembourg 2.5%
Brasil 1.4%
France 0.9%
NOTE: Total gross investment without Foreign-Securities Holding Companies (ETVE) SOURCE: Datainvex. Ministry of Economy and Competitiveness
FDI IN THE MAIN URBAN AREAS OF THE WORLD
URBAN AREA 2010-2014 FDI PROJECTS
London 1 1,712
Shanghai 2 1,314
Hong Kong 3 1,047
São Paulo 4 864
Paris 5 717
New York 6 685
Sydney 7 647
Moscow 8 627
Beijing 9 520
Barcelona 10 502
SOURCE: Global Cities Investment Monitor 2015, KPMG
10 LEADING EUROPEAN URBAN AREAS IN FOREIGN INVESTMENT PROJECTS AND RELATED JOBS, 2014
REGION / URBAN AREA FDI PROJECTS JOBS
Greater London 383 3,470
Paris 159 1,200
Darmstadt (Frankfurt) 124 1,316
Catalonia (Barcelona) 108 7,089
Düsseldorf 86 1,649
Rhône-Alpes (Lyon) 83 1,592
Uusimaa (Helsinki) 83 197
Berlin 80 1,595
Stuttgart 74 982
Friburg 68 268
Others 3,093 166,225
Strategic
and Driver
Sectors
Barcelona actively promotes the development of sectors considered strategic for the economy of the city, such as ICT, logistics and agri-food, the powerful commerce and tourism industries, and new cutting-edge sectors such as the biomedical industry and – in the field of mobility and sustainable energy – electric vehicles.
Logistics and transport comprise a key sector in Catalonia. The sector accounts for 4.3% of total economic activity, has the largest amount of logistic land in Spain (24% of the total) and managed a total of 343 million tons of goods in 2014. The city of Barcelona and Catalonia as a whole present significant competitive advantages in this sector: geostrategic location, the existence of an important production industry, generating more than 44,000 and 101,000 jobs, respectively, the provision of refurbished infrastructure, such as Barcelona’s port and airport, and logistics areas, and so on. The Barcelona-Catalonia Logistics Centre (BCL), an initiative promoted by Barcelona City Council, the Barcelona Consortium and the Port of Barcelona, and which currently has more than 100 members in the sector, implements a strategy aimed at positioning metropolitan Barcelona as the leading logistics platform in Southern Europe and the Mediterranean.
Barcelona and Catalonia are home to one of the most important agri-food clusters in Europe and the largest in Spain. The cluster is backed up by
the powerful food and drink industry, which, with 3,500 companies, is the leading industrial sector in Catalonia in terms of turnover, and includes such major stakeholders as Mercabarna, leader in the distribution of fresh produce in Southern Europe, as well as a large number of facilities, universities and technology centres, which provide support for research and innovation activities. Other key assets in the territory in this sector include the twice-yearly organisation of Alimentària, the second-most important trade fair in the world in this industry, and the valuable intangible heritage represented by the Mediterranean diet, which, combined with the city’s large range of restaurants, helps to make Barcelona a capital of gastronomic quality and creativity.
Catalonia is a motor for medical and biomedical
research in Spain. Catalan biotechnology firms account for 20.5% of the total number in the State, generating 29.4% of turnover in the sector and accounting for 23% of new companies established in this field .
Barcelona is firmly committed to the electric vehicle
Barcelona is an international reference in terms of tourism and the organisation of fairs and congresses
In 2014, the tourism industry set new records in terms of visitor numbers (7.9 million) and overnight stays (17.1 million), as well as generating the biggest year-on-year increases of the last three years, with rises of 4 and 3.7%, respectively, compared to 2013.
Credit card spending reached 3,754.8 million euros in 2014, a substantial 22.3% increase on the previous year.
Several rankings highlight the attractiveness of Barcelona to foreign visitors: according to the MasterCard Index of Global Destination Cities 2014, Barcelona ranks as the eleventh best city in the world and the fourth in Europe (behind only London, Paris and Istanbul) in terms of number of international visitors. Moreover, according to the European Cities
Marketing Benchmarking Report, Barcelona occupied
fifth place in Europe for international overnight stays in 2013, whilst, according to Trip Advisor, the Catalan capital was the world’s thirteenth-most attractive destination for tourists in 2015. Finally, according to the Top City Destination Ranking, published by Euromonitor International, in 2014 Barcelona was twenty-sixth out of the 100 cities around the world most visited by international tourists and the eighth most visited in Europe.
With regard to business tourism, according to the International Congress and Convention Association (ICCA), Barcelona was the second city in the world in number of delegates and fifth in number of international conferences organised in 2014, behind only Vienna, Paris, Madrid and Berlin.
Strategic sectors in the economy of
Barcelona
BASIC INDICATORS OF STRATEGIC SECTORS IN BARCELONA, 4th quarter 2014
WORKERS* COMPANIES**
ICT 40,769 2,057
Logistics 3 44,396 1,716
Agri-food 1 14,728 1,214
Commerce 2 143,012 16,159
Tourism 86,795 8,375
Mobility 44,234 1,723
Creative industries 108,595 7,790
Biotechnology, life sciences and
medicine 8,226 165
Higher education and research 27,323 463
Energy and environment 11,701 128
Design 17,813 1,801
Fashion-textiles 3,180 361
* Salaried workers and self-employed according to Social Security data ** Social Security centres (companies with salaried workers) 1 Includes wholesale food trade
2 Does not include wholesale food trade or ICT 3 Includes all Group H, Transport and storage, CCAE-2009
Tourism
Urban tourism destination
TOURISTS AND OVERNIGHT STAYS IN BARCELONA
2012 2013 2014 2013-2014VARIATION
Tourists* 7,440,113 7,571,767 7,874,941 4.0% Overnight stays 15,931,932 16,485,074 17,091,852 3.7% Credit card
spending(€) 2,384,477,371 3,069,305,250 3,754,760,525 22.3%
* Tourists accommodated in hotel establishments SOURCE: Barcelona Tourism
HOTEL INDICATORS
2012 2013 2014 2013-2014VARIATION
Hotels 352 365 373 2.2%
Rooms 33,362 34,453 34,689 0.7%
Places (beds) 65,100 67,567 68,036 0.7%
SOURCE: Barcelona Tourism
COUNTRY OF ORIGIN OF TOURISTS, 2014 (% of tourists staying in hotels)
Spain 20.5%
France 8.6%
United Kingdom 8.6%
United States 8.3%
Germany 6.2%
SOURCE: Barcelona Tourism
DISTRIBUTION OF TOURISTS BY REASON FOR JOURNEY, 2014
Holiday Work Other
SOURCE: Barcelona Tourism
7
.
9
million tourists at hotels
+
4
%
compared to 2013
2
.
4
million cruise passengersBENCHMARK FIRA DE BARCELONA TRADE FAIRS IN EUROPE
FIRA DE BARCELONA
GSMA WORLD CONGRESS ALIMENTARIA
HIAPSCK+ BTA Food Technologies EIBTM
CARBON EXPO
PISCINA BCN. International Swimming Pool Fair HOSTELCO
CONSTRUMAT
3E / EXPOQUIMIA + EQUIPLAST + EUROSURFAS BARCELONA BRIDAL WEEK - NOVIAESPAÑA GRAPHISPAG
INTERNATIONAL CAR SHOW
BARCELONA INTERNATIONAL BOAT SHOW SMART CITY EXPO WORLD CONGRESS
SOURCE: Fira de Barcelona
City of Fairs and Conferences
INDICATORS OF CONGRESS ACTIVITY
2014
TOTAL meetings 1,969
Congresses 271
Conferences and courses 134
Conventions and incentives 1,564
TOTAL delegates 579,855
SOURCE: Barcelona Tourism and Barcelona City Council Department of Statistics
NUMBER OF DELEGATES AND INTERNATIONAL MEETINGS IN WORLD CITIES
CITY DELEGATES 2014 CONGRESSES 2014
Paris 130,516 214
Barcelona 127,469 182
Madrid 91,452 200
London 89,969 166
Vienna 81,902 202
Amsterdam 79,356 133
Berlin 76,880 193
Istanbul 75,864 130
Copenhagen 57,497 105
Munich 56,958 81
Seoul 53,700 99
SOURCE: International Congress and Convention Association Statistics Report, 2014
2
5
th
A city committed to a diversified, quality, local model of commerce
With 16,159 companies and 143,012 jobs, commerce is one of the most important branches in Barcelona’s economic structure. Despite the impact of the recession on levels of activity and employment, the sector continued to account for 22.6% of companies and 14.9% of wage earners in the city at the end of 2014.
Due to their economic and social importance in the city’s neighbourhoods, Barcelona’s municipal markets, which house 2,569 establishments in a total area of 245,000 square metres, making this the largest network of food markets in Europe, are a key element in the business model for commerce in the Catalan capital. In 2015, the American organisation Project for Public Spaces (PPS) presented its Market City award to Barcelona as a model city in the use of markets as a tool for sustainable urban development, where citizens leave only a short distance from a market, and as a city that champions public markets as essential tools for the revival of every neighbourhood.
The international ranking for commercial attractiveness in relation to the presence of international distribution companies, published in 2015 by Jones Lang Lasalle, places Barcelona amongst the top ten most attractive European cities from the point of view of the retail trade.
Commerce
TRADE IN BARCELONA
TRADE 2014*
Number of companies 16,159
Jobs 143,012
Commercial and restaurant establishments 34,276 MUNICIPAL MARKETS 2014
Food and drink 39
Special 4
Number of establishments 2,569
Total area 245,571 m2
* Figures for fourth quarter
1 Average sales by month and establishment
SOURCE: Barcelona City Council Department of Statistics, Municipal Market Institute and Eixos-Planol Info.
TOP 10 MOST ATTRACTIVE EUROPEAN DESTINATIONS FOR INTERNATIONAL RETAIL TRADE BUSINESSES (2015)
POSITION CITY
1 London
2 Paris
3 Moscow
4 Milan
5 Madrid
6 Rome
7 Istanbul
8 Munich
9 Berlin
10 Barcelona
Ambitious
City Projects
Commitment to mobile technology and ICT
Barcelona seeks to become a reference point in technology in order to improve quality of life in a global context in which mobile technology is a key vector for the growth of the economy as a whole. In this context, the designation of Barcelona as Mobile World Capital, hosting the Mobile World Congress
and the industrial legacy project, present a strategic opportunity to position the city in this sector of activity.
With more than 40,700 workers and 2,000 companies with employees in the industry, Barcelona is the main centre for ICTs in Catalonia, accounting for 56.1% of workers and 50.7% of companies with employees in the sector in the Principality. According to an estimate made in 2012, the information and communication vector that includes ICTs generates 7.3% of total Gross Added Value in the city.
Moreover, Barcelona’s whole-hearted commitment to becoming a Smart and Sustainable City centres on applying ICTs to generate urban innovation and ensure sustainable development, improved quality of life of citizens, greater efficiency in the use of resources (both human and energy) and increased citizen participation.
According to the ranking compiled by Juniper Research in 2015, Barcelona is the smartest city in the world, ahead of New York, London, Nice and Singapore, and provides a successful model from which much can be learned, having launched many initiatives to promote sustainability that are now at an advanced stage of development.
PENETRATION OF ICT IN HOUSEHOLDS (% population aged 16-74 years)
2012 2013 2014 2014-2013VARIATION
Have computer at
home 78.7 78.5 86.3 7.8
Internet connection
at home 75.0 78.1 85.3 7.2
Frequent Internet
use 76.5 74.3 80.1 5.8
SOURCE: INE survey of ICT equipment and use in the home
Smart City
10 Smartest Cities in Europe, 2013
1 Copenhaguen
2 Amsterdam
3 Vienna
4 Barcelona
5 Paris
6 Stockholm
7 London
8 Hamburg
9 Berlin 10 Helsinki
SOURCE: Fast Company, The Smartest Cities in Europe
ELECTRIC VEHICLES IN BARCELONA: BASIC INDICATORS, 2015*
BCN/CAT
Vehicles Electric vehicles registered (including hybrids) 4,581 28% Infrastructure Electrical recharging points ** 366 54%
Barcelona, amongst the world’s leading cities for quality of life
Barcelona’s outstanding image in terms of quality of life and, particularly, the city’s excellent education facilities and health system, are major competitive factors that help to establish the Catalan capital as seventh city in the world in terms of labour attractiveness, according to The Boston Consulting’s
Decoding Global Talent report. Moreover, Barcelona moved up one place to occupy fourth position in terms of labour attractiveness in the Toronto Board of Trade’s Scorecard on Prosperity 2015.
The city is also amongst the safest in the world, according to The Safe Cities Index 2015, compiled by the British magazine The Economist to assess
urban security in the digital age. The results of this survey, which placed the Catalan capital in fifteenth position in a global ranking of 50 cities, are based on forty indicators, and a particularly notable result was Barcelona’s seventh place for safety in the field of health, in an analysis that takes into account such aspects as public access to the health system, the ratio of beds and doctors per thousand inhabitants, air and water quality and life expectancy.
In the environmental sphere, the Barcelona model of the compact Mediterranean city fosters sustainable mobility, which accounts for 85% of internal journeys. Leading international rankings recognise the city in this respect. For example, the Toronto Board of Trade’s Scorecard on Prosperity 2015 rated Barcelona highly in terms of commute time –the time that is spent travelling to and from work–. Furthermore, the city continues to work towards the implementation of electric mobility (electric vehicles and NGVs) through the LIVE public-private platform.
Moreover, Barcelona is, today, a reference point at European level as regards water saving. In 2014, per capita water consumption stood at 104.4 litres, a
The Catalan capital is also the operating centre of GWOPA, the Global Water Operators’ Partnerships Alliance/UN-Habitat, and will host the permanent secretariat of this world water policy agency for the next five years.
The city has a large network of outstanding, high quality cultural and educational facilities. There are 38 international schools in the Barcelona area, as well as a system of 40 public libraries. Not only that, but Barcelona is also home to 9 sites catalogued as World Heritage by UNESCO – 7 buildings by Gaudí, as well as the Palau de la Música Catalana and the Hospital de Sant Pau.
Barcelona is also a reference city with regard to medicine and health. The Catalan public health system provides services of the highest level, whilst many internationally prestigious private centres help to position the city as a global destination for health tourism, as well as an outstanding venue for medical congresses. To these well-established elements of attraction should also be added the development of important research projects focused on the health sector.
Best Quality of Life
in Europe
7
th
most attractive city in the world for working
abroad
Quality of life
LABOUR ATTRACTIVENESS OF CITIES AROUND THE WORLD, 2014
POSITION CITY RESULT
1 London 16.0%
2 New York 12.2%
3 Paris 8.9%
4 Sydney 5.2%
5 Madrid 5.0%
6 Berlin 4.6%
7 Barcelona 4.4%
8 Toronto 4.2%
9 Singapore 3.9%
10 Rome 3.5%
11 Dubai 3.4%
12 Los Angeles 3.2%
13 Tokyo 2.8%
14 Munich 2.8%
15 Miami 2.6%
NOTE: The result is the percentage of responses to the question: “What cities would you consider for going to work abroad? Please give up to five answers.”
SOURCE: Decoding Global Talent. The Boston Consulting Group, The Network
Energy and the environment
GREEN ZONE INDICATORS IN BARCELONA, 2014
Urban parks (green zones for public use) 580.6 ha Urban green (green zones integrated into the
urban fabric) 11,226,042 m2
Urban green per capita 7.0 m2/inhabitant Urban and forest green 28,213,242 m2 Urban and forest green per capita 17.61 m2/inhabitant
SOURCE: Barcelona City Council Department of Statistics (Statistical Annual 2015) and Ecology, Urban Planning and Mobility Area
BEACHES, 2014
Number 10
Length (Km) 4.4 km
QUALITY INDICATORS
Concentration of Escherichia coli1 16-111 UFC/100 ml
Good visual inspections2 94%
1 Values below and above percentile 90. Sufficient according to current legislation (Royal Decree 1341/2007): percentile 90 = <500 UFC/100 ml (RD 1341/2007)
2 Visual inspections with absence or low presence of floating solid matter, oil/foam, bathers’ waste, seawater (index evaluated during the bathing season)
SOURCE: Barcelona City Council Department of Statistics (Statistical Annual 2015)
ENERGY INTENSITY IN THE CITY OF BARCELONA (MWh/M€)
295
290
285
280
275
270
265
2008 2009 2010 2011 2012
279 279
283 281 291
15
th
safest cityWATER CONSUMPTION IN BARCELONA (litres/inhabitant/day)
180
160
140
120
100
80
60
40
20
0
2006 2007 2008 2009 2010 2011 2012 2013 2014
TOTAL CONSUMPTION DOMESTIC CONSUMPTION INDUSTRIAL CONSUMPTION
SOURCE: Barcelona City Council Departments of Statistics and Environment RENEWABLE ENERGY PRODUCTION IN BARCELONA, 2008-2012
DISTRIBTION OF
RE PRODUCTION (MWH/INHABITANT)RE PRODUCTION
100%
90% 0.1
80%
70% 0.08
60%
50% 0.06
40%
30% 0.04
20%
10% 0.02
0%
2008 2009 2010 2011 2012
PHOTOVOLTAIC SOLAR THERMAL SMALL HYDRO BIOGAS (ECOPARC + GARRAF)
SOURCE: Barcelona Sustainability Indicators, 2013 Report. Barcelona City Council
EVOLUTION OF SELECTIVE WASTE COLLECTION IN BARCELONA
2014 36.1%
2013 36.2%
2012 37.1%
2011 37.9%
2010 39.5%
2009 32.4%
2007 32.0%
2005 28.8%
2000 11.1%
SOURCE: Barcelona City Council Department of Statistics (Statistical Annual 2015)
118.1
64.7 182.8 178.2
169.9 164.9 164.8 165.2 163.2 160.9 156.2
114.5
63.7 112.9
57 110.1
54.8 109.8
55 109.5
55.7
108.2 108.4 104.4
55.0 52.5 43.2
104
.
4
l
Domestic per capita water consumption
-21
.
6
%
comparedSustainable mobility
TRANSPORT MODES IN INTERNAL JOURNEYS IN BARCELONA, 2014 (in %/total)
On foot and by bicycle Public transport Private transport
NOTE: Result of processing MTA figures on stages, traffic counters in the city, tourist activity, school transport, traffic composition capacities, bicycle and pedestrian capacity SOURCE: Metropolitan Transport Authority
BIKE LANES AND USERS
2013 2014
Bike lanes (km) 104.9 km 116.0 km
Bicing users 98,786 96,250
SOURCE: Barcelona City Council Mobility Services Directorate
55.6% 29.3%
15.0%
Cultural and educational facilities
CULTURAL AND EDUCATIONAL FACILITIES, 2014
Public libraries (number and users) 40 / 6,433,294 Museums, collections, exhibition centres and sites
of architectural interest (number and users) 56 / 31,523,513 Theatre, music and cinema spectators 10,222,927 Public sports facilities (number and subscribers) 1,894 / 178,295 Nursery, primary and secondary schools 884 Foreign schools in the Barcelona area 38
SOURCE: Barcelona City Council Institute of Culture and Department of Statistics
WORLD HERITAGE IN BARCELONA
Palau de la Música Catalana Hospital de Sant Pau Parc Güell
Palau Güell Casa Milà Casa Vicens
Sagrada Família: Nativity Façade and crypt Casa Batlló
Crypt at Colònia Güell
Due to its quality of life and advances towards becoming a hub for scientific innovation and
education and in the digital and technological fields, Barcelona is considered an attractive place to work in, as well as for investment and the development of new business ideas. Moreover, the Catalan capital is also seen as an innovative city, one that is closely associated with creativity and the concepts of culture, fashion, architecture, art and modernity.
A City Brand
that adds value
Barcelona continues to enjoy an excellent position in the international and European context as a city with a powerful global brand and outstanding reputation that makes it attractive for business, entrepreneurship and foreign investment, for attracting talent and for science and production, as well as for its culture and quality of life.
The European Cities and Regions of the Future 2014/15 report, produced by FDI Intelligence, places Barcelona in seventh place among the leading twenty-five European cities in the global ranking of future prospects, ahead of such other major capitals as Berlin, Amsterdam, Edinburgh and Paris. The Catalan capital also has the sixth best global brand according to The Guardian and also enjoys the sixth best reputation according to the Reputation Institute. Regarding foreign investment, Barcelona occupies fourth place in the European ranking of projects attracted, according to Ernst and Young’s Attractiveness Survey Europe 2015, whilst the KPMG
Global Cities Investment Monitor ranked Barcelona as the tenth most attractive urban area in the world over the 2010-2014 period.
Turning now to tourism, such reports as the ICCA’s classification for congresses and international delegates in the business tourism sector, the
Euromonitor International rankings on numbers of international visitors, and the ranking of numbers of cruise passengers at ports in Europe and around the world are amongst the many surveys that place our city high on their lists. Particularly noteworthy are Barcelona’s second place in the world for number of delegates in 2014 and fifth place in number of congresses in 2014, according to the ICCA.
European Cities and Regions of the Future, 2014-2015
7th CITY IN THE GLOBAL CLASSIFICATION 1st CITY IN SOUTHERN EUROPE
Guardian Cities Global Brand Barometer, 2014
6th CITY WITH THE BEST GLOBAL BRAND IN THE WORLD
City RepTrak, 2015
6th CITY IN THE WORLD WITH BEST REPUTATION
EY’s Attractiveness Survey. Europe 2015
4th REGION WITH MOST FOREIGN INVESTMENT PROJECTS
Global Cities Investment Monitor, KPMG, 2015
10th CITY IN THE WORLD FOR FOREIGN INVESTMENT PROJECTS, 2010-2014 12th CITY IN THE WORLD FOR FOREIGN INVESTMENT PROJECTS, 2014
Mori Global Power City Index, 2015
12th EUROPEAN CITY FOR GLOBAL COMPETITIVENESS
26th WORLD CITY FOR GLOBAL COMPETITIVENESS
Scorecard on Prosperity, 2015
4th CITY FOR LABOUR ATTRACTIVENESS
Decoding Global Talent 2014. The Boston Consulting Group. The Network
7th CITY FOR LABOUR ATTRACTIVENESS
Barcelona’s international position
ICCA, 20145th CITY IN THE WORLD IN THE ORGANISATION OF INTERNATIONAL MEETINGS, 2014 2th CITY IN THE WORLD IN NUMBER OF DELEGATES
Euromonitor, 2014, i European Cities Market-ing BenchmarkMarket-ing Report, 2014/2015
8th EUROPEAN CITY IN NUMBER OF TOURISTS 5th IN INTERNATIONAL TOURIST OVERNIGHT STAYS
Travellers’ choice. Trip Advisor, 2015
13th CITY AMONGST THE 25 LEADING TOURIST DESTINATIONS IN THE WORLD
Mastercard, Global Destination Cities Index, 2014
11th CITY AMONG THE TOP 20 WORLD DESTINA-TIONS IN ATTRACTING INTERNATIONAL TOURISM
Cruise Insight, 2014
1st EUROPEAN CITY IN NUMBER OF CRUISE PASSENGERS
4th CITY IN THE WORLD IN NUMBER OF CRUISE PASSENGERS
The Global Language Monitor, 2015
5th WORLD FASHION CAPITAL
World-wide cost of living survey. Mercer Human Resource Consulting, 2015