Subjective Quality Assessment of an Adaptive Video Streaming Model
Samira Tavakoli,
aKjell Brunnström,
b, cKun Wang,
b, cBörje Andrén,
bMuhammad Shahid,
dNarciso Garcia
aa
Universidad Politécnica de Madrid, Spain; b Acreo Swedish ICT AB, Sweden; c Mid Sweden University, Sweden; d Blekinge Institute of Technology, Sweden
ABSTRACT
With the recent increased popularity and high usage of HTTP Adaptive Streaming (HAS) techniques, various studies have been carried out in this area which generally focused on the technical enhancement of HAS technology and applications. However, a lack of common HAS standard led to multiple proprietary approaches which have been developed by major Internet companies. In the emerging MPEG-DASH standard the packagings of the video content and HTTP syntax have been standardized; but all the details of the adaptation behavior are left to the client implementation. Nevertheless, to design an adaptation algorithm which optimizes the viewing experience of the end-user, the multimedia service providers need to know about the Quality of Experience (QoE) of different adaptation schemes. Taking this into account, the objective of this experiment was to study the QoE of a HAS-based video broadcast model. The experiment has been carried out through a subjective study of the end user response to various possible clients’ behavior for changing the video quality taking different QoE-influence factors into account. The experimental conclusions have made a good insight into the QoE of different adaptation schemes which can be exploited by HAS clients for designing the adaptation algorithms.
Keywords: HTTP adaptive streaming, quality of experience, subjective quality assessment
1.
INTRODUCTION
The Hypertext Transfer Protocol (HTTP) streaming of video content is expanding rapidly as an alternative to traditional TV broadcast like distribution, which relies on User Datagram Protocol (UDP) and Real-Time Streaming Protocol (RTSP) when implemented in IP networks. The application of traditional streaming was mainly the real-time video session, however due to the destabilized network resources it generally led to packet loss and consequently video picture distortion. This differs in HTTP video streaming techniques where packet delivery is guaranteed due to its underlying Transmission Control Protocol/Internet Protocol (TCP/IP). Furthermore, HTTP-based delivery provides the ability to use standard HTTP servers and has better scalability due to minimal state information on the server side. On the other hand, using HTTP as the streaming protocol enables utilization of existing HTTP caches, NATs and firewalls. However, a smooth and high-quality playback could not always be guaranteed, because of the variable bandwidth of the networks used to deliver multimedia content, as well as that additional waiting times in packet delivery may lead to that the video playback buffer is evacuated. These events usually show up as visual freeze of the video and are also known as rebuffering. To avoid this, it is possible to reduce the bandwidth requirements of the media data by, for example, reducing the coding quality of the video to achieve smooth playback.
As interest in the Video-on-Demand (VoD) increased, Internet-oriented streaming techniques emerged by dynamically adapting the video quality taking advantage of the pre-encoded content at the server. In this path, HTTP Adaptive Streaming (HAS) is a relevant advancement towards trying to ensure as good as possible Quality of Experience (QoE) for the end user taking into account the available bandwidth, optimizing video quality, startup delay and reducing stalling in playback. To make the transmission more adaptable to the rapidly fluctuating bandwidth of the Internet, the multimedia files are divided into small pieces, called chunks. This way, the servers make various segmented versions of the content with different quality levels and provide access to the segments and the quality level details. During the streaming session, a client adaptation algorithm can use the supplied details to adapt the playback to the current environment providing the best possible QoE.
DASH standard primarily focuses on the packaging of the content and HTTP syntax used to request/transfer segments between the client and server. Although there are several studies about the key features of DASH and its design principles, e.g. [2] and [3], there is still the lack of research to evaluate the perceptual impact of different configurations and adaptation behavior that can take place in DASH. From another point of view, in addition to the measurable performance metrics such as bit rate, segment size, adaptive streams, etc. , many confounding factors related to nature of the content which have influence on perceptual quality of the video have to be studied.
Considering the big demand of studying the perceptual effect of adaptation process to optimize the QoE, a study on the QoE of a HAS-based video broadcast model is presented in this paper.
The reminder of this paper is structured as follows. Section 2 gives a background on DASH and its quality metrics and also reviews related work in this regard. In Section 3, the study factors, proposed scenarios, experimental setup and procedure are described in detail. The results are presented and discussed in Section 4 and 5. In Section 6 a summary of our findings from this study are presented.
2.
DASH QUALITY METRICS AND RELATED WORK
In principle, HAS is based on streaming switching technique where the raw multimedia content is encoded at different increasing bit rates, known as adaptive streams. An algorithm must dynamically choose the video level which matches the user’s available bandwidth.
Adaptation streams are cut into chunks of one to several seconds. Every chunk initiates with a key frame, meaning that segments do not have any dependency on to past/future segments. Finally, all chunks are encoded in the desired format and hosted on a HTTP server. Chunks are requested sequentially by clients, downloaded through HTTP progressive download and subsequently played in order. All adaptation logic is controlled by the client. After streaming the first chunk of the video and monitoring the effective bandwidth of the network, the client decides about the quality of the next chunk if it should be higher, lower or in the same quality level. The properties of the adaptive streams available in the server are contained in a manifest file. In fact, in the format of the chunks and the manifest file lie the differences among the various commercial systems already developed. Therefore, to enable the interoperability between different servers and clients, DASH standard is being developed. DASH enables live, on-demand and time shifts services and allows independency of request sizes and segment sizes.
DASH specification defines the formats and functionalities of the segments, in addition to Media Presentation Description (MPD) which describes a manifest of the available content, its various alternatives and their Uniform Resource Locator (URL) addresses. However, delivery of the MPD and the media-encoding formats containing the segments, as well as client behavior for fetching, adaptation heuristics, and playing the content, are outside of the standard scope.
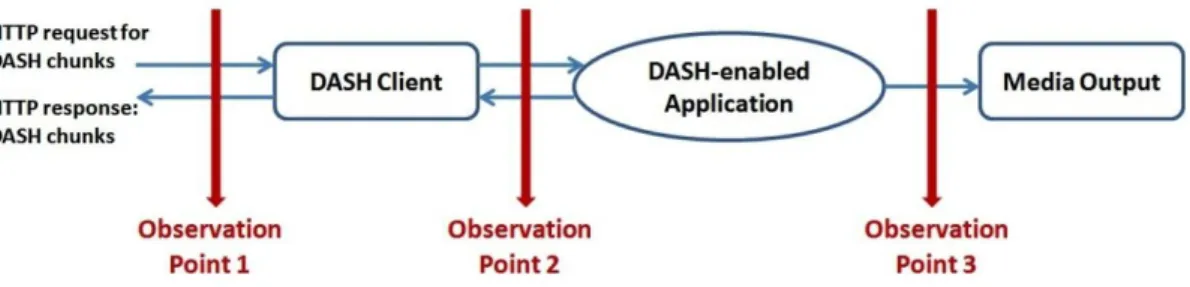
DASH standard has also a set of well-defined quality metrics for the client to measure and report back the QoE to a reporting server. In general, three conceptual observation points (OP) are considered for measurements which are shown in Figure 1. Example of possible OP1 metrics could be measuring the HTTP request/response transitions parameters such as an entry for a single HTTP request/response, IP address of the interface, the time at which the connection was opened and later on closed and connection time. In OP3, different representation switch events can be measured, for instance time of the switch event and the media time of the earliest media sample. The scope of current study is OP3, where different possible client behavior to adapt to the network state is studied.
Figure 1. Possible observation point metrics to measure the session QoE.
performance of video streaming systems, such as start-up latency, coding bit rate, frequency and severity of buffering events, and rendering quality [4]. Another example could be found in the work of Singh et al. where a no-reference metric, which is based on neural networks considering video freezes and the quantization parameters, estimates the QoE of the users of HTTP adaptive video streaming [5]. These proposals try to evaluate the effects of these systems taking into account the possible impact on the end user’s perceived quality in the simplest way, which is using quality metrics and not directly involving people in the evaluation. However, it is well-known that the most reliable way to evaluate the QoE of the users of a certain application is by means of subjective tests [6]. In addition, some works have been proposed regarding the control of the adaptive streaming system considering QoE issue. For instance, the decision strategy of the client for requesting chunks according to the network conditions could be optimized using an estimation of the QoE, based on the impact of video freezes, the effects of frequency and amplitude of the quality changes, and spatial and temporal information of the video [7]. Considering adaptation capability of Scalable Video Coding (SVC), Sieber et al. [8] presented a user-centric DASH/SVC streaming algorithm for mobile platform that reduces the number of quality switches by trying for a stable buffer level before increasing the SVC layers. Their study outperforms the other available algorithms in terms of switching frequency, and usage of the available resources; however it does not take the amplitude of quality switches into account.
Some subjective studies have been already published, for example, Thang et al. studied the optimum number of coding quality levels that could be used in an adaptive video system by investigating the Just Noticeable Difference (JND) levels existing in the quality range of mobile video content taking into account the perceptual factors of the human visual system [9]. Their experiment was done by side-by-side comparison of different quality levels looking for noticeable differences. However the test method was more oriented to the design of the streaming system than on the evaluation of system performance in relation to the quality transitions and the events that take place in HAS. Another example consists of the incorporation of the effects of frame rate and resolution adaptations on the user’s perception to obtain the encoding configuration that maximizes the QoE for a certain type of content [10]. In this study, the Single Stimulus Continuous Quality Evaluation (SSCQE) method [11] using a slider scale on the screen of the TV was employed as the subjective test methodology which could in fact distance the observers from the real viewing situations. Mok et al. presented in [12] a QoE-aware DASH system including a probing module to detect the highest quality level the current network conditions can support and another module that with the estimated available bandwidth helps the client to select the most suitable quality level. Their studies showed that inserting intermediate quality levels gives a better perceived quality. On the other hand, large buffer size does not necessarily improve the QoE, while small video buffer usually produces lower QoE as it has short period to have intermediate quality levels. An interesting study was presented by Robinson et al. [13], in which the impact of various patterns of quality variations, including rapid and gradual bit rate drop as well as oscillating the quality on the users’ QoE was studied. The experimental results confirmed that a constant bit rate was preferable to frequent changes, and rapid bit rate drops was more preferable than oscillatory changes. In spite of introducing interesting test conditions, possible adaptation behavior to increase the video quality has not been studied. Finally, in our previous study [14], various adaptation scenarios to decrease and increase the quality of stereoscopic video considering frame freezing due to buffering delays were introduced. Different results regarding the proposed scenarios have been obtained, such as almost imperceptible QoE of bit rate oscillation when there is not so much coding difference (2 Mbps in the current work). In spite of various observations regarding the proposed scenarios, the study did not take the influence of the spatial and temporal information of the video content into account.
3.
SUBJECTIVE EXPERIMENT
3.1 Experiment design
After a careful planning and discussions with the most dominant video streaming companies in Sweden, the study factors were chosen from the actual concerns of the aforesaid service providers. The selected video quality levels and video content types for the current experiment were also considered to be close to what are really used in practice for multiple screen delivery. The study factors considered in the experiment are listed below.
1. Adaptation strategy
2. Adaptive streams
To produce the adaptive streams, the characteristics of the streams which are in practice provided by the streaming companies for the living-room platforms have been considered. Consequently, in total 4 stream numbers have been considered as the adaptive streams. Rhozet Carbon Coder was used for transcoding the streams with the setting summarized in Table 1.
Table 1. Transcoding parameters for living-room platform.
Stream # Video Bit Rate Frame size Frame Rate Profile
1 600 1280×720 24 High
2 1000 1280×720 24 High
3 3000 1280×720 24 High
4 5000 1280×720 24 High
16×9, MPEG-4 stream type
H.264 setting: closed GOP (disable scene change detection), Max. B frames:2, Ref. frame:3
3. Content type
There is a definite link between quality and video characterization [15]. In particular, the spatial and temporal perceptual information of the scenes play an important role in determining the amount of the video compression and consequently, the level of impairment. Therefore the influence of spatial perceptual information (SI) and temporal perceptual information (TI) [16] on perceptual QoE of adaptation events should be taken into account. From another side, individual interests raise different expectation on QoE [15]. Based on this attribute, for example the video scene when the adaptation event takes place plays a crucial role on end user’s experience.
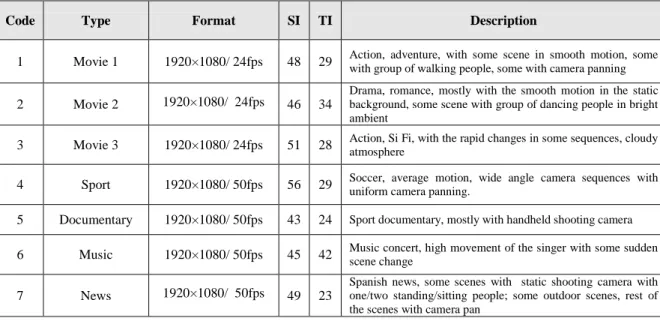
Taking these issues into account, for this experiment 7 source videos (SRC) in different content types were chosen among commercial video contents (Table 2). The characteristics of the contents were different containing from smooth to sudden motions, smooth scene change to fast scene change, and recorded using still, zoom or moving camera. On the other hand, the chosen sequences spanned a quite large portion of the spatial-temporal information plane. The duration of each video content was about 6 minutes.
Table 2. Main properties of the source sequences.
Code Type Format SI TI Description
1 Movie 1 1920×1080/ 24fps 48 29 Action, adventure, with some scene in smooth motion, some
with group of walking people, some with camera panning
2 Movie 2 1920×1080/ 24fps 46 34
Drama, romance, mostly with the smooth motion in the static background, some scene with group of dancing people in bright ambient
3 Movie 3 1920×1080/ 24fps 51 28 Action, Si Fi, with the rapid changes in some sequences, cloudy atmosphere
4 Sport 1920×1080/ 50fps 56 29 Soccer, average motion, wide angle camera sequences with
uniform camera panning.
5 Documentary 1920×1080/ 50fps 43 24 Sport documentary, mostly with handheld shooting camera
6 Music 1920×1080/ 50fps 45 42 Music concert, high movement of the singer with some sudden
scene change
7 News 1920×1080/ 50fps 49 23
4. Chunk size
Currently, majority of the video service providers are using about 10 seconds duration chunk size. However, this segment size is not suitable for the live broadcast. Furthermore, such a long duration chunk will cause low switching granularity on segment level. To study the impact of chunk size on perception of adaptation scenarios, both long and short chunks (specifically 10 seconds and 2 seconds) have been considered.
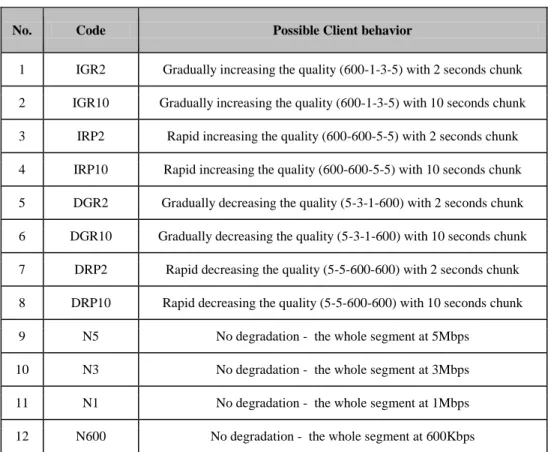
Considering above factors, for each of the condition of increasing, decreasing and constant quality, in total 4 different Hypothetical Reference Circuits (HRC) were considered as the possible client behavior which are summarized in Table 3. The total of 132 Processed Video Sequences (PVS) was generated by subdividing the 6 minutes videos into smaller segments using Adobe Premiere Pro CS6 with the same method as [14]. The length of the segments (or ultimately, PVSs) was variable depending on the HRCs, 40 seconds for those considering the quality variation with 10 seconds chunk, and 14 seconds for the rest of the HRCs.
Table 3. Test conditions.
No. Code Possible Client behavior
1 IGR2 Gradually increasing the quality (600-1-3-5) with 2 seconds chunk 2 IGR10 Gradually increasing the quality (600-1-3-5) with 10 seconds chunk 3 IRP2 Rapid increasing the quality (600-600-5-5) with 2 seconds chunk 4 IRP10 Rapid increasing the quality (600-600-5-5) with 10 seconds chunk 5 DGR2 Gradually decreasing the quality (5-3-1-600) with 2 seconds chunk 6 DGR10 Gradually decreasing the quality (5-3-1-600) with 10 seconds chunk 7 DRP2 Rapid decreasing the quality (5-5-600-600) with 2 seconds chunk 8 DRP10 Rapid decreasing the quality (5-5-600-600) with 10 seconds chunk
9 N5 No degradation - the whole segment at 5Mbps
10 N3 No degradation - the whole segment at 3Mbps
11 N1 No degradation - the whole segment at 1Mbps
12 N600 No degradation - the whole segment at 600Kbps
3.2 Evaluation methodology
be compared with each other. Following this idea, in this experiment, ACR standard method was considered as the test methodology (considering individual PVS with no audio).
Following the ACR method specification, after presentation of each PVS, the subjects were asked to evaluate the sequence by voting for two different questions: the overall quality of the PVS ranging from bad (1) to excellent (5) and if they have perceived any change in the quality by stating the type of the change. Figure 2 shows the voting interface used in the experiment.
Figure 2. Voting interface. 3.3 Environment, equipment, procedure and test subjects
The subjective experiment was carried out at Acreo Swedish ICT’s Lab. The test room complied with the recommendation ITU-R BT.500-11 [11]. The Lab was equipped with a 46” Hundai S465D display with the native resolution of 1920×1080 and 60 Hz refresh rate. Viewing distance was 4 times of display height. The peak white luminance of TV was 177 cd/m2 and the ambient illuminance level in the room was about 20 lux. A modified version of a video player, AcrVQWin [17], was used to present the randomized PVS. At the end of each PVS, a voting interface was displayed and the test subjects were asked to rate the PVSs on provided rating scales.
Outside the test room, the test subjects were initially screened for visual acuity (Snellen chart) and color vision (Ishihara), and later on, asked to fill the Simulator Sickness Questionnaire (SSQ) [18] as well as answering some questions about their background and interest. Afterward, they were led to the test room to read the test instruction. Subsequently, a training session was performed to familiarize them with the range of the qualities, some examples of PVSs including quality variation (adaptation scenarios) and the test procedure. The actual test where the randomized PVSs were presented, were then carried out divided into 3 sessions with a break between each session. After terminating the test, the test subjects were again asked to fill the SSQ.
The test subjects were of different ages (mean 30, median 28, max 68 and min 18) and background. There were 7 female and 16 male, including 4 Swedish and 19 international. Four of them had subscriptions from the streaming media service providers (specifically Netflix).
4.
EXPERIMENTAL RESULTS AND ANALYSIS
probability of the observing scores whether or not the difference amongst between- and within-factors variance is statistically significant. Generally, probability equal or lower than 0.05 is considered adequate to suggest the difference is statistically significant.
4.1 Perception of adaptation strategies in overall view
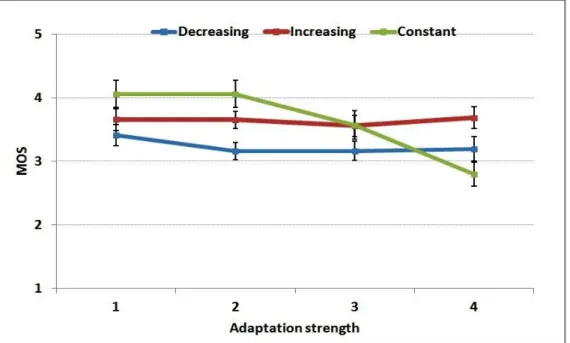
In Figure 3, the overall behavior of the adaptation scenarios are presented. The x-axis represents the mean of the MOS for all the content and the y-axis represent the four different scenarios considered for each of the status of decreasing, increasing and constant quality. For the scenarios to decrease and increase the quality, number 1 to 4 stands to GR10, GR2, RP10, and RP2 in order (refer to the codes in Table 3). For the constant quality scenarios, the numbers indicate to 5Mbps, 3Mbps, 1Mbps and 600kbps in order. The results show that in general there is no statistically significantly difference between the QoE of 5Mbps and 3 Mbps encoded video, while both were significantly preferred to the increasing scenarios (p < 0.001). The QoE of 1Mbps encoded video was not statistically significantly different compared to the increasing scenarios (p ≥ 0.8 for all increasing scenarios). On the other hand, all the adaptation scenarios have been preferred to 600kbps video and the differences were statistically significant (p < 0.001 for all scenarios). About scenarios to increase the quality, overall results did not show any statistically significantly difference between different strategies. For the decreasing scenarios, there was a statistically significantly preference to gradual change with 10 seconds chunk compared to the other scenarios (p ≤ 0.03).
Figure 3. Overall behavior of the adaption scenarios. For decreasing and increasing scenarios, number 1 to 4 stands to GR10, GR2, RP10, and RP2 in order (refer to codes in Table 3). For the constant quality scenarios, the numbers indicate to 5Mbps, 3Mbps, 1Mbps and 600kbps in order. The error bar shows 95% confidence interval.
4.2 Perception of adaptation strategies to decrease the quality
Figure 4. Adaptation strength when decreasing the quality in different test sequence. The error bar shows 95% confidence interval.
4.3 Perception of adaptation strategies to increase the quality
Considering Figure 5, the QoE of increasing the bit rate in general was better in Documentary compared to the other contents. On the other hand, there was no significant preference between scenarios in all the contents except for Movie3. Gradual increasing quality with 10 seconds chunk (IGR10) was perceived significantly better than other scenarios in the aforementioned content (p ≤ 0.02).
4.4 Perception of adaptive streams
The quality of the adaptive streams was perceived distinctly in different contents according to Figure 6. In Documentary, Sport, Movie 3, and Music video, the change in the perceptual quality has been statistically significant when watching 600kbps stream compare to the other qualities (p=0.00). While in Movie1 and Movie2, the observers started to get annoyed when watching 1Mbps (p=0.00).
Figure 6. MOS for each of the adaptive streams in different video content.
4.5 Increasing the quality or remaining in the low quality?
To have better understanding about the end user preference when experiencing N1, N600 and increasing scenarios, the QoE of these scenarios in the video contents has been compared in Figure 7. The results for Documentary, Sport, Movie1, News and Music showed that the QoE of N1 has been similar to the overall increasing scenarios (mean of MOS of increasing scenarios), both statistically significantly more satisfactory compared to N600. Regarding Movie2, QoE of the overall increasing scenarios has been preferred to N1 and statistically significantly to N600. And finally in Movie3, there has not been any statistically significantly deference in QoE of increasing the quality, N1 and N600.
4.6 Influence of the content characteristics on QoE of the adaptation strategies
Psychophysical experiments show that spatial and temporal masking in the human visual system makes the visual stimuli less noticeable [15]. Masking is stronger in the presence of high spatial and temporal information. Therefore, it should be taken into account that the quality judgment can be affected by the video content.
Figure 8 displays the relationship between the spatio-temporal information1 of the PVSs on the x-axis and the corresponded MOS results along the y-axis, which is included since these values were used to characterize the content used in the test. However, according to this Figure, it is difficult to draw any meaningful conclusions about the relationship between spatio-temporal characteristics of a video and its perceptual quality by using such straightforward relationship. This in turn necessitates the use of more rigorous and statistical techniques to make clear inferences. These observations indicate that describing the relationship between the objective parameters of the video and the perceived
1
The normalized magnitude of the SI and TI values: 2 2
max max
1 2
SI TI
SI TI
quality needs further study but this is out of the scope of this paper. Still, interesting to observe are the two outlier points on the right of the data crowd which belongs to Sport content representing N3 and N5. The other points which are relatively far from the crowd on the top belong to Movie2 when representing N3 and N5.
Figure 7. Comparison of QoE of increasing scenarios with N1 and N600.
4.7 Perception of changing the quality
In addition to rating the video quality, the observers were asked to indicate if they perceived any change in the quality of the PVS. The MOS shown in Figure 9 indicates that the test subjects perceived accurately the sort of the quality variation scenarios. Nevertheless, an interesting observation was found about gradually increasing the quality with 2 seconds chunk, IGR2, where the subjects did not perceive the change of the quality.
Figure 9. Perception of changing the quality in HRCs. Number “1”, “0” and “-1” indicate to “increasing the quality”, “no change” and “decreasing the quality” in order.
5.
CONCLUSSIONS
In recent years, the HTTP Adaptive Streaming (HAS) has gained popularity among multimedia content providers as an efficient way which can adapt the video playback to the variable network conditions. Various proprietary HAS methods were implemented by different Internet companies and eventually in 2012 MPEG-DASH was standardized to allow the client-side adaptation. Nevertheless, the choice of the adaptation strategy is out of the scope of MPEG-DASH and it is left to the client implementation. But it is not clear how the end user’s Quality of Experience (QoE) is influenced by different adaptation schemes.
In this paper, the end user response to various possible adaptation behaviors has been studied through conducting a subjective test. The study factors were selected from the actual concerns in this field and the selected video contents and quality levels were also considered to be close to the situation in practice.
Our findings regarding the overall observations of the adaptation scenarios indicate that in general 5Mbps and 3Mbps encoded video are not perceived statistically significantly different, while both qualities are statistically preferred to the increasing strategies. On the other hand, the perception of 1Mbps encoded video is not statistically significantly different than the increasing scenarios. Another observation was about the statistically significantly better QoE of all the adaptation strategies compared to 600kbps encoded video. Regarding the scenarios to increase the quality, overall results does not show any statistically significantly difference between them. About the quality decreasing strategies, a statistically significantly preference was found about the gradual bit rate changes with 10 seconds chunk compared to the others.
Various outcomes about the QoE of the adaptation strategies in different video contents were also obtained. Our findings indicate that the content type and its spatio-temporal information play an important role in the perception of the adaptation strategies and video playback. Therefore, the impact of the content type in the design of QoE evaluation studies should not be omitted.
REFERENCES
[1] ISO/IEC, “Dynamic adaptive streaming over HTTP (DASH) -- Part 1: Media presentation description and segment formats,” ISO/IEC 23009-1 (2012).
[2] Lederer, S., Müller, C., and Timmerer, C., "Dynamic adaptive streaming over HTTP dataset." Proc. Multimedia Systems Conference (ACM) (2012).
[3] Martin, J., Fu, Y., Wourms, N., and Shaw, T., “Characterizing Netflix bandwidth consumption,” in IEEE Consumer Communications and Networking Conference (CCNC), 230-235 (2013).
[4] Dobrian, F. , Sekar, V., Awan, A., Stoica, I., Joseph, D., Ganjam, A., Zhan, J., and Zhang, H., “Understanding the impact of video quality on user engagement,” SIGCOMM’11, 56(3), 91–99 (2011)..
[5] Singh, K. D., Hadjadj-Aoul, Y., and Rubino, G., “Quality of experience estimation for adaptive HTTP/TCP video streaming using H.264/AVC,” IEEE Consumer Communications and Networking Conference, 127–131 (2012).
[6] ISO/IEC JTC1/SC29/WG11, “Report of subjective test results from the call for proposals on 3D video coding technology”, MPEG2011/N12347 (2011).
[7] Menkovski, V., Member, S., and Liotta, A., “Intelligent control for adaptive video streaming,” IEEE International Conference on Consumer Electronics, 133–134 (2013).
[8] Sieber, C., Hoßfeld, T., Zinner, T., Tran-Gia, P., and Timmerer, C., “Implementation and User-centric Comparison of a Novel Adaptation Logic for DASH with SVC,” IFIP/IEEE International Workshop on Quality of Experience Centric Management (QCMan) (2013).
[9] Thang, T. C., Nguyen, H. X., and Pham, A. T., “Perceptual difference evaluation of video alternatives in adaptive streaming,” International Conference on Communications and Electronics, 322–326 (2012).
[10] Cranley, N. and Murphy, L., “Incorporating user perception in adaptive video streaming systems,” Digital Multimedia Perception and Design, Idea Group Inc. (2006).
[11] ITU-R Recommendation BT.500-11, “Methodology for the Subjective Assessment of the Quality of Television Pictures,” International Telecommunication Union (2002).
[12] Mok, R. K. P., Lue, X., Chan, E. W. W., and Chang, R. K.C., “QDASH: A QoE-aware DASH system”, Proc. Multimedia Systems Conference (ACM), 11-22 (2012).
[13] Robinson, D., Jutras, Y., and Craciun, V., “Subjective video quality assessment of HTTP adaptive streaming technologies,” Bell Labs Technical Journal 16(4), 5-23 (2012).
[14] Tavakoli, S., Gutierrez, J., and García, N., “Quality assessment of adaptive 3D video streaming”, SPIE 8650, Three-Dimensional Image Processing (3DIP) and Applications (2013).
[15] Winkler, S., “Digital Video Quality: Vision Models and Metrics”, JohnWiley & Sons Ltd. (2005).
[16] ITU-T Recommendation P.910, “Subjective video quality assessment methods for multimedia applications,” International Telecommunication Union (2008).
[17] Jonsson, J. and Brunnström, K., "Getting Started With ArcVQWin", Acreo AB, acr022250 (2007).
[18] Brunnström, K., Wang, K., and Andrén, B., "Simulator sickness analysis of 3D video viewing on passive 3DTV", SPIE 8648 Stereoscopic Displays and Applications XXIV (2013).