Ultraviolet diversity of Type Ia Supernovae
Ryan J. Foley,
1,2‹Yen-Chen Pan,
1P. Brown,
3A. V. Filippenko,
4O. D. Fox,
5W. Hillebrandt,
6R. P. Kirshner,
7,8G. H. Marion,
9P. A. Milne,
10J. T. Parrent,
7G. Pignata
11,12and M. D. Stritzinger
131Astronomy Department, University of Illinois at Urbana-Champaign, 1002 W. Green Street, Urbana, IL 61801, USA 2Department of Physics, University of Illinois at Urbana-Champaign, 1110 W. Green Street, Urbana, IL 61801, USA
3George P. and Cynthia Woods Mitchell Institute for Fundamental Physics & Astronomy, Department of Physics and Astronomy,
Texas A. & M. University, 4242 TAMU, College Station, TX 77843, USA
4Department of Astronomy, University of California, Berkeley, CA 94720-3411, USA 5Space Telescope Science Institute, 3700 San Martin Drive, Baltimore, MD 21218, USA
6Max-Planck-Institut f¨ur Astrophysik, Karl-Schwarzschild-Strasse 1, D-85748 Garching bei M¨unchen, Germany 7Harvard–Smithsonian Center for Astrophysics, 60 Garden Street, Cambridge, MA 02138, USA
8Gordon and Betty Moore Foundation, 1661 Page Mill Road, Palo Alto, CA 94304, USA 9University of Texas at Austin, 1 University Station C1400, Austin, TX 78712-0259, USA 10Steward Observatory, University of Arizona, 933 N. Cherry Ave, Tucson, AZ 85719, USA
11Departamento de Ciencias Fisicas, Universidad Andres Bello, Avda. Republica 252, Santiago, Chile 12Millennium Institute of Astrophysics, Avda. Republica 252, Santiago, Chile
13Department of Physics and Astronomy, Aarhus University, Ny Munkegade 120, DK-8000 Aarhus C, Denmark
Accepted 2016 June 14. Received 2016 June 10; in original form 2016 April 3
A B S T R A C T
Ultraviolet (UV) observations of Type Ia supernovae (SNe Ia) probe the outermost layers of the explosion, and UV spectra of SNe Ia are expected to be extremely sensitive to differences in progenitor composition and the details of the explosion. Here, we present the first study of a sample of high signal-to-noise ratio SN Ia spectra that extend blueward of 2900 Å. We focus on spectra taken within 5 d of maximum brightness. Our sample of 10 SNe Ia spans, the majority of the parameter space of SN Ia optical diversity. We find that SNe Ia have significantly more diversity in the UV than in the optical, with the spectral variance continuing to increase with decreasing wavelengths until at least 1800 Å (the limit of our data). The majority of the UV variance correlates with optical light-curve shape, while there are no obvious and unique correlations between spectral shape and either ejecta velocity or host-galaxy morphology. Using light-curve shape as the primary variable, we create a UV spectral model for SNe Ia at peak brightness. With the model, we can examine how individual SNe vary relative to expectations based on only their light-curve shape. Doing this, we confirm an excess of flux for SN 2011fe at short wavelengths, consistent with its progenitor having a subsolar metallicity. While most other SNe Ia do not show large deviations from the model, ASASSN-14lp has a deficit of flux at short wavelengths, suggesting that its progenitor was relatively metal rich.
Key words: supernovae: general – supernovae: individual: SN 1992A, SN 2009ig, SN 2011by, SN 2011fe, SN 2011iv, SN 2012cg, SN 2013dy, SN 2014J, ASASSN-14lp, SN 2015F – ultraviolet: stars.
1 I N T R O D U C T I O N
Type Ia supernovae (SNe Ia) are thermonuclear explosions of C/O white dwarfs in binary systems (see Hillebrandt & Niemeyer2000,
E-mail:[email protected].
for a review). Variable amounts of56Ni are produced in the
(Riess et al.1998; Perlmutter et al.1999) and continuing to provide critical constraints on cosmological parameters (e.g. Betoule et al. 2014; Rest et al.2014).
Despite our general physical understanding of SNe Ia, there re-main significant questions about their progenitor systems (e.g. what is the nature of the companion star) and the explosion mechanism (e.g. how is the flame ignited and how does it propagate). Lacking this fundamental knowledge hinders future theoretical and observa-tional investigations.
A unique way to probe the physics of SN Ia explosions and pro-genitors is through their ultraviolet (UV) spectra. While the main source of opacity for an SN atmosphere near peak brightness is electron scattering at most optical wavelengths, the UV opacity is dominated by a forest of overlapping lines from Fe-group elements (e.g. Baron et al.1996; Pinto & Eastman2000). UV photons are repeatedly absorbed and re-emitted, and typically are scattered red-ward where they eventually escape the expanding SN ejecta. There-fore, the UV is essential for understanding the optical emission of an SN Ia (Sauer et al.2008) as well as being extremely sensi-tive to both the progenitor composition and explosion mechanism. Because of the high opacities in the UV, we can use UV spec-troscopy to directly probe the composition of the outermost layers of the SN which are transparent at optical wavelengths soon after explosion.
After correcting for light-curve shape, SN Ia luminosity still de-pends significantly on host-galaxy environment (Kelly et al.2010; Lampeitl et al.2010; Sullivan et al.2010; however, for an alter-native explanation, see Kim et al.2014). This may indicate that environmental effects or progenitor properties affect our luminosity calibration. The UV can potentially improve our physical under-standing of the relationship between host-galaxy mass and SN Ia luminosity.
In particular, progenitor metallicity should affect the amount of radioactive material generated in the explosion (Timmes, Brown & Truran2003) and the relationship between SN luminosity and light-curve shape (Mazzali et al.2001; Mazzali & Podsiadlowski2006; Podsiadlowski et al.2006), while also shaping the UV spectrum (e.g. H¨oflich, Wheeler & Thielemann1998; Lentz et al. 2001). Such a relation may significantly impact the overall SN calibration and increase the scatter in SN distance measurements (Foley & Kirshner2013). Additionally, if the mean SN progenitor metallicity has evolved with cosmic time, we would expect a systematic bias in cosmological distance estimates.
To address these questions, we have undertaken a major pro-gramme to obtain UV spectra of SNe Ia with theHubble Space Telescope(HST). Until now, we have focused on the detailed study of individual events (Kirshner et al.1993; Foley et al.2012c,2014; Foley2013; Foley & Kirshner2013; Pan et al.2015). And while other studies have examined samples of SNe Ia with UV spectra (Foley, Filippenko & Jha2008b; Cooke et al.2011; Maguire et al. 2012; Wang et al.2012), those data either did not extend blueward of∼2900 Å or had low signal-to-noise ratio (S/N).
Here, we present the first study of a sample of SNe Ia with near-maximum-light space-UV (extending to<2000 Å) spectra. With our sample, we are able to investigate how the spectra are influenced by other properties of the SN. With these initial results, we can account for correlations between spectral features and light-curve shape, which, in turn, can isolate effects related to other physical properties such as progenitor metallicity.
This paper is structured as follows. We present new observa-tions of two SNe Ia and add those data to our previous sample in Section 2. The characteristics of the sample are examined and the
spectral properties are analysed in Section 3. We discuss our results and conclude in Section 4.
2 DATA A N D O B S E RVAT I O N S
ASASSN-14lp was discovered in NGC 4666 on 2014 December 9.6 (all dates herein areUT; Holoien et al.2014). Spectroscopic observations on 2014 December 10.8 indicated that it was a young SN Ia (Thorstensen et al. 2014). SN 2015F in NGC 2442 was discovered on 2015 March 9.8 (Monard et al.2015) and spectra taken on 2015 March 11.0 showed it was a young SN Ia (Fraser et al. 2015). As part of our ongoing programme to obtain UV spectra of SNe Ia, we triggeredHSTto observe ASASSN-14lp and SN 2015F in Cycle 22 (Foley2014,2015). ASASSN-14lp and SN 2015F peaked inBon 2014 December 24.25 (Shappee et al.2015) and 2015 March 24.98 (Im et al.2015), respectively.
ASASSN-14lp and SN 2015F were observed byHSTusing the STIS spectrograph on 2014 December 19.81 and 2015 March 22.66, corresponding tot= −4.4 and−2.3 d relative toBmaximum, re-spectively. The observations were obtained over one orbit per SN with three different gratings, all with the 52 arcsec×0.2 arcsec slit. Exposures of 1393 s (for ASASSN-14lp; 1345 s for SN 2015F) uti-lized the near-UV MAMA detector and the G230L grating. For each SN, exposures of 100 s were taken with both the CCD/G430L and CCD/G750L setups. The three setups yield a combined wavelength range of 1615–10 230 Å.
The data were reduced using the standardHSTSpace Telescope Science Data Analysis System (STSDAS) routines to bias-subtract, flat-field, extract, wavelength-calibrate, and flux-calibrate each SN spectrum. Similar reductions were performed for the other spectra used in this study (Foley et al.2012c,2014; Foley2013; Foley & Kirshner2013; Pan et al.2015).
In addition to the new data, we include near-maximum-light (|t|
5 d)HSTspectra of SNe 1992A (Kirshner et al.1993), 2011 by (Foley & Kirshner2013), 2011fe (Foley2013), 2011iv (Foley et al. 2012c), 2013dy (Pan et al.2015), and 2014J (Foley et al. 2014). We present the maximum-lightHSTspectrum of SN 2012cg, originally published by Amanullah et al. (2015), but rereduced as described above (with the modest difference that the UV spectrum was obtained with the STIS CCD/G230LB setup and there was no CCD/G750L observation). To this, we also add the high-S/N near-maximum-lightSwiftUV spectrum of SN 2009ig (Foley et al. 2012b). While the quality of the SN 2009ig spectrum is not as high as that of theHSTspectra and it does not probe shortward of
∼2500 Å, it still provides useful information in the near UV. We correct all spectra for both Milky Way reddening (Schlegel, Finkbeiner & Davis1998; Schlafly & Finkbeiner2011) and host-galaxy reddening as derived from the SN light curves (Phillips et al. 1999,2013; Foley et al.2012b,c,2014; Foley & Kirshner2013; Pereira et al.2013; Silverman, Ganeshalingam & Filippenko2013; Im et al.2015; Pan et al.2015; Shappee et al.2015) using a Cardelli, Clayton & Mathis (1989) reddening law. The exact reddening law and host-galaxy reddening uncertainties do not significantly affect our results (see Section 3.4).
Figure 1. pEWs of the SiIIλ5972 and SiIIλ6355 lines for a sample of SNe Ia (Branch et al. 2006), with symbol shapes corresponding to the designations defined by Branch et al. (2006). The large, labelled points indicate the sample of SNe Ia with near-maximum-brightness high-S/N UV spectra. The coloured points correspond to the SNe withHSTspectral sequences.
3 A N A LY S I S
3.1 Sample demographics
The diversity of peak-luminosity optical SN Ia spectra is primarily driven by the photospheric temperature, which changes the ion-ization state of elements, and the ejecta velocity, which shifts and broadens absorption features. This diversity can be parametrized by the pseudo-equivalent widths (pEWs) of the SiIIλ5972 and SiII
λ6355 features (Branch et al.2006). Alternatively, the diversity can be described by light-curve shape (e.g.m15(B)) and the
maximum-light velocity of SiIIλ6355,vSi0II(Wang et al.2009). Photospheric
temperature is highly correlated with bothm15(B) and the relative
strengths of SiIIλλ5972, 6355(Nugent, Kim & Perlmutter2002);
also, the pEW of SiIIλ6355 is correlated withvSiII0 (Foley & Kasen
2011).
Fig.1displays the SiIIparameter space for a sample of SNe Ia (Branch et al.2006). Branch et al. (2006) subclassified SNe Ia by these measurements. There is a general trend from weak lines (small pEW values) to strong lines. The SNe with the weakest lines are called ‘Shallow Silicon’ and have spectra (and light curves) similar
to those of SN 1991T (Filippenko et al.1992b; Phillips et al.1992). The SNe with slightly stronger lines are called ‘Core Normal’. The SNe with the strongest SiIIλ5972 lines share properties with
SN 1991bg (Filippenko et al.1992a; Leibundgut et al.1993) and are called ‘Cool’. Finally, those SNe with particularly strong SiII
λ6355, which generally correlates with high ejecta velocities, are called ‘Broad Line’.
Fig.1also displays where the SNe Ia with near-maximum-light UV spectra fall in this parameter space. For most of the sample, we were able to measure the pEWs directly from theHSTspectra. However, we used other optical spectra to determine these values for SNe 1992A, 2009ig, 2011by, and 2012cg (Kirshner et al.1993; Foley et al.2012b; Silverman et al.2012,2013).
The 10 SNe Ia with high-S/N near-maximum-light spectra span most of the above parameter space. While the SNe generally include most of the Shallow Silicon and Core Normal region, they only barely reach the Cool and Broad-Line subclasses. Moreover, SN 2014J, which has very high and uncertain reddening, is the only true Broad-Line SN. Because of the uncertain reddening, we remove SN 2014J from our subsequent analysis, making our final sample primarily a continuum from SN 1991T-like SNe to cool, but not extremely cool SNe (i.e. similar to SN 1986G; Phillips et al.1987), with no true Broad-Line SNe.
Optical spectral properties also correlate with light-curve shape (Nugent et al.1995) and host-galaxy morphology (e.g. Hamuy et al. 2000; Howell2001). We present basic parameters, including light-curve shape, velocity, and host-galaxy morphology for the sample in Table1. Light-curve shape measurements were taken from the literature (Phillips et al.1999; Foley et al.2012b,c, 2014; Foley & Kirshner2013; Pereira et al.2013; Silverman et al.2013; Im et al. 2015; Pan et al. 2015; Shappee et al. 2015; Marion et al. 2016). For the ejecta velocity, we measure the velocity of the SiII
absorption-line minimum in the optical spectra, and correct those data to their maximum-light values (Foley, Sanders & Kirshner 2011)v0
SiII. Host-galaxy morphology measurements were obtained
from the NASA/IPAC Extragalactic Database (NED).
3.2 Spectral correlations
To directly compare the UV spectral properties of our sample, we generate a smoothed spectrum of each SN using an inverse-variance Gaussian filter (Blondin et al.2006) and scale the spectra to have roughly the same flux at 4000 Å. The SNe all have relatively similar optical spectra, and therefore the exact choice of scaling
Table 1. UV SN sample properties.
SN m15(B) v0Si II E(B−V)MW E(B−V)host Host
(mag) ( km s−1) (mag) (mag) morphology
1992A 1.47 (0.05) −14 000 0.015 0.00 (0.02) S0
2009ig 0.89 (0.02) −13 500 0.029 0.00 (0.05) Sa
2011by 1.14 (0.03) −10 300 0.013 0.00 (0.03) Sbc
2011fe 1.10 (0.04) −10 400 0.008 0.00 (0.01) Scd
2011iv 1.69 (0.05) −10 400 0.010 0.00 (0.03) E1
2012cg 0.86 (0.02) −11 000 0.018 0.18 (0.04) Sa
2013dy 0.92 (0.01) −10 400 0.135 0.21 (0.01) Sdm
2014J 0.95 (0.01) −11 900 0.054 1.19 (0.14) Sm
ASASSN-14lp 0.80 (0.01) −11 100 0.022 0.32 (0.01) Sc
2015F 1.26 (0.10) −10 300 0.179 0.04 (0.03) Sbc
Note.vSi II0 measurements have a typical uncertainty of 250 km s−1.
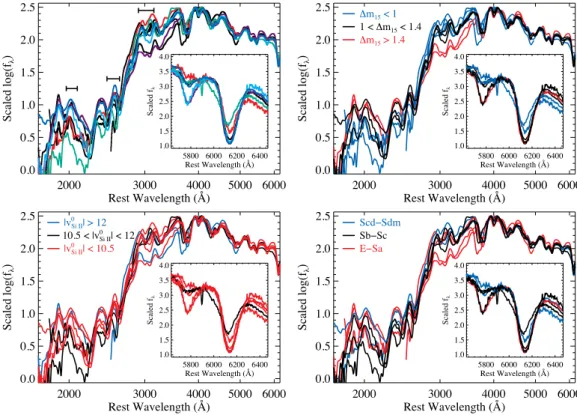
Figure 2. Near-maximum-light UV-optical spectra of several SNe Ia. In the main panels, the spectra have been smoothed using an inverse-variance Gaussian filter (Blondin et al.2006) and scaled to have a similar flux level at∼4000 Å. In the subpanels, the region near SiIIλλ5972, 6355 is shown in detail (with different flux scaling). The top-left panel displays the spectra with colours corresponding to those in Fig.1. The marked regions indicate, from shorter to longer wavelengths, thef3025,f2535, andf2030flux regions. The other panels display the same spectra, but coloured by different properties, with the top-right, bottom-left, and bottom-right panels representing light-curve shape, ejecta velocity, and host-galaxy morphology, respectively. The blue, black, and red curves correspond to (respectively)m15(B)<1, 1< m15(B)<1.4, andm15(B)>1.4 mag;|v0
Si II|>12 000, 10 500<|vSi II0 |<12 000, and|v0Si II|<10 500 km s−1; and E through Sa, Sb through Sc, and Scd through Sdm.
(or wavelength region where the scaling occurs) does not signifi-cantly affect any results.
We present these UV through optical spectra in Fig.2, including a zoomed-in region near SiIIλλ5972, 6355. The spectra are relatively
similar over the range 4000–6000 Å, but vary significantly forλ < 3500 Å. Increased diversity at shorter wavelengths has been shown for other SN Ia samples (Ellis et al.2008; Foley et al.2008a,2012a; Maguire et al.2012), but no previous study has examined the region below∼2500 Å.
The subpanels of Fig.2display the spectra coloured by their light-curve shape, ejecta velocity, and host-galaxy morphology. Ex-amining the spectra, there is a trend between light-curve shape and the flux level at∼3000 Å (relative to∼4000 Å), with faster de-cliners having lower flux. This is similar to the trend seen between the UV ratio and light-curve shape (Foley et al.2008b), but with a different normalization wavelength. The flux at other wavelengths is also correlated with light-curve shape, but not as strongly as at
∼3000 Å.
There are no clear trends between spectral flux levels and ejecta velocity or host-galaxy morphology. However, the velocity of UV features (unsurprisingly) correlates withv0
SiII.
We define three regions of interest, corresponding to wavelength ranges of 1970–2090, 2450–2620, and 2900–3150 Å. These rep-resent the far-UV region that is theoretically affected most by progenitor metallicity (e.g. Lentz et al.2000), a mid-UV region on top of a high-variation feature, and the near-UV feature that clearly and strongly correlates with light-curve shape. We label the median flux in these regions, relative to 10 times that of the peak flux near 4000 Å, asf2030,f2535, andf3025, respectively.
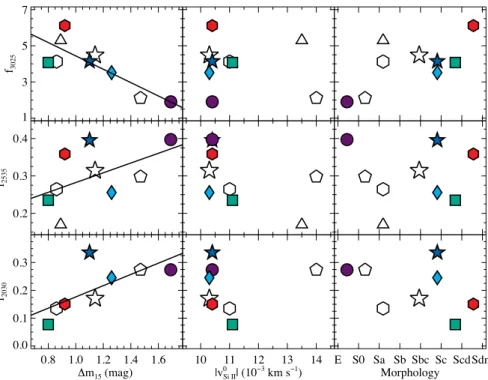
We display these flux values as a function of SN properties in Fig.3.
The flux in each of these regions is correlated with light-curve shape, although to varying degrees (Pearson correlation coefficient ofr=0.71, 0.52, and−0.82, respectively). With the exception of f3025, none is highly correlated with ejecta velocity or host-galaxy
morphology. Forf3025, it is correlated with host-galaxy morphology
(r=0.66), but this is likely because light-curve shape and host-galaxy morphology are highly correlated (e.g. Hamuy et al.2000; Howell2001).
To determine if there were additional correlations beyond light-curve shape, we first fit linear trends between the various flux mea-surements andm15(B). Examining the residuals, we find that there
is a somewhat strong correlation between ejecta velocity andf2535(r
= −0.63), but the lack of many high-velocity SNe prevents a robust conclusion about a physical connection.
3.3 Spectral model
Despite the strong correlations between light-curve shape and flux, there is additional spectral diversity that is not described by this single parameter. This is obvious when comparing SNe 2011by and 2011fe, which have similar light-curve shapes but different UV con-tinua (Foley & Kirshner2013; Graham et al.2015). To assess how much an individual spectrum deviates from a single parametriza-tion, we generated a data-driven model of the UV spectra. Here, we fit the smoothed flux for all spectra in our sample at each wavelength as a function ofm15(B) such that
Figure 3. Flux measurements (relative to 10 times the flux at 4000 Å) for 1970–2090 (f2030; bottom row), 2450–2620 (f2535; middle row), and 2900–3150 Å (f3025; top row) as a function ofm15(B) (left-hand column),v0Si II(middle column), and host-galaxy morphology (right-hand column). Symbols and colours correspond to objects as labelled in Fig.1. In the left-hand column, we show the best-fitting line betweenm15(B) and the flux values.
Table 2. UV spectral model parameters.
Wavelength f1.1,λ sλ
(Å)
1700 0.0080 0.098
1705 −0.0010 0.090
1710 0.0090 0.041
1715 0.0170 0.029
1720 0.0270 0.007
1725 0.0060 0.050
1730 0.0000 0.056
1735 0.0380 0.014
1740 0.0160 0.027
1745 0.0430 0.017
Note. Table2is published in its entirety in the electronic edition ofMonthly Notices of the Royal Astronomical Society. A portion is shown here for guidance regarding its form and content.
where f1.1,λ represents the spectrum of a nominal m15(B) =
1.1 mag SN Ia and sλ is the deviation from that spectrum for a hypotheticalm15(B)=2.1 mag SN Ia. We present these
parame-ters in Table2.
Fig.4displays model spectra for several values ofm15(B). The
model spectra appear similar to the data. Additionally, the general trends observed in the data (e.g. the correlation between light-curve shape and the flux at∼3000 Å) exist in the model. There are other obvious trends in the model that are harder to directly visualize in the spectra, such as increasing flux at∼2000 Å with increasing
m15(B) – however, these trends are present in the data (see Fig.3).
The models have a pivot point at∼2700 Å. This implies that all SNe Ia should have the same flux at∼2700 Å relative to their optical flux (and in particular the flux at∼4000 Å). Blueward of
Figure 4. Model near-maximum-light UV SN Ia spectra as described by equation (1). The purple, blue, green, gold, and red curves represent models withm15(B)=0.9, 1.1, 1.3, 1.5, and 1.7 mag, respectively.
2700 Å, faster decliners have relatively higher flux, while slower decliners have relatively more flux in the region∼2700–4000 Å.
The linear-m15(B) flux model also provides a reasonable
de-scription of the individual spectra in our sample. For example, we show three models withm15(B)=0.86, 1.12, and 1.58 mag,
re-spectively, in Fig.5. We compare these models to SN 2012cg, SN 2013dy, and ASASSN-14lp (m15(B)=0.86, 0.92, and 0.80 mag,
respectively); SN 2011by and SN 2011fe (m15(B) = 1.14 and
1.10 mag, respectively); and SN 1992A and SN 2011iv (m15(B)
=1.47 and 1.69 mag, respectively). In general, the spectra from SNe with similar light-curve shapes have similar spectra, and the model is also similar. In particular, SNe 1992A and 2011iv are remarkably similar even though they have the largestm15(B) difference of the
comparison SNe in any particular group. Alternatively, SNe 2011by and 2011fe are the most different of any two SNe in a group de-spite having the smallestm15(B) difference (and being consistent
Figure 5. Top panels: smoothed near-maximum-light UV spectra of several SNe Ia. The left-, middle, and right-hand panels present spectra of (respectively) SN 2012cg, SN 2013dy, and ASASSN-14lp; SNe 2011by and 2011fe; and SNe 1992A and 2011iv. The spectra are separated such that each panel has spectra of SNe having similar light-curve shapes, where eachm15(B) is labelled in parentheses. The spectrum from a given SN is coloured to match that presented in Fig.1. The gold curves represent the model spectra, given by equation (1), for a nominal SN with a light-curve shape that is similar to those of the SNe whose spectra are displayed in that panel:m15(B)=0.86, 1.12, and 1.58 mag for the left-, middle, and right-hand panels, respectively. Bottom panels: fractional flux differences from the model spectra presented in the panels above. By dividing by the model spectrum, one can directly compare differences between SNe.
We can therefore use the model spectra to determine how sim-ilar a particular spectrum is to a typical SN with its light-curve shape. For instance, we can conclude that SN 2011fe has an ex-cess of UV flux relative to the typicalm15(B) =1.1 mag SN,
similar to what one would expect from direct comparisons to SN 2011by (Foley & Kirshner2013; Graham et al. 2015). Perhaps more interesting in that particular case is that SN 2011by has a UV spectrum more similar to the typical SN Ia with its light-curve shape despite its possibly lower-than-typical luminosity (Foley & Kirshner2013).
Since the UV excess for SN 2011fe atλ <2500 Å has been inter-preted as a difference in progenitor metallicity (Foley & Kirshner 2013; Mazzali et al.2014), comparing a given SN Ia near-maximum-light UV spectrum to the model spectrum could be a useful tool for determining the progenitor metallicity for SNe Ia that have no op-tical ‘twin’ counterpart. While our current model will be biased by the progenitor metallicity distribution of the SN Ia UV sample, we can refit the model excluding any given SN, and then compare the excluded SN to the new model.
Removing a particular SN spectrum from the sample and pro-ducing a new model, we can examine the deviation of a particular spectrum from the expected spectrum given its light-curve shape. To find SNe with potentially abnormal progenitor metallicities, one can examine the deviation from the model spectra in the far-UV and the near-UV, where the Lentz et al. (2000) models suggest that spectra of SNe with only progenitor metallicity differences should and should not (respectively) differ from each other. Examining the regions 1700< λ < 2500 Å and 2700< λ < 4200 Å, we find two SNe that have a median absolute fractional difference of
>35 per cent for the former and<25 per cent for the latter: SN 2011fe and ASASSN-14lp.
SN 2011fe has a spectrum consistent with that of the model in the near-UV (median absolute fractional deviation of 8 per cent), but inconsistent in the far-UV (median absolute fractional deviation of 75 per cent), with the far-UV flux being above the model (see Fig.5). ASASSN-14lp is also consistent with the model in the near-UV (median absolute fractional deviation of 14 per cent), but has relatively low far-UV flux (median absolute fractional deviation of 40 per cent; see Fig.5). Given that the relatively high far-UV flux of SN 2011fe is interpreted as being caused by a subsolar progenitor metallicity (Foley & Kirshner 2013; Mazzali et al. 2014; Baron et al.2015), one may extrapolate to say that ASASSN-14lp has a high progenitor metallicity.
However, we caution that the conclusions regarding the progeni-tor metallicity of ASASSN-14lp rely on the other SNe in the sample with similar light-curve shapes (namely SNe 2012cg and 2013dy). Therefore, a stronger conclusion is that ASASSN-14lp had a higher progenitor metallicity than SNe 2012cg and 2013dy, without mak-ing comparisons to SNe havmak-ing significantly different light-curve shapes.
3.4 UV diversity
Theory suggests that the diversity in SN Ia UV spectra is indicative of varying progenitor properties and explosion mechanisms. Any complete theory of SN Ia explosions must explain both the general UV spectral propertiesand the variance. Similarly, knowing the UV variance is critical for determining the cosmological utility of rest-frame UV data for SN cosmology.
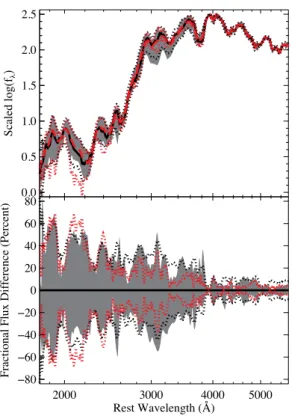
Figure 6. Top panel: mean (black solid curve) and median (red dashed curve) spectra for the near-maximum-light SN Ia spectral sample. The grey region represents the range of spectra for the middle 68.27 per cent of spectra generated from the sample using a bootstrap sampling (with replacement) method. Also plotted are the spectral ranges as determined by the standard deviation (black dotted curves) and MAD (red dotted curves). Bottom panel: fractional flux difference for the different spectral ranges relative to either the mean spectrum (for the bootstrap sampling and standard deviation) or the median spectrum (for the MAD).
and median absolute deviation (MAD) of the sample. Finally, we produce a sample of average spectra using a bootstrap sampling (with replacement) method (see Foley et al.2008a, and references therein). Because the spectra are normalized at∼4000 Å, the re-sultant spectra (and variances) are indicative of relative spectral features, including spectral slopes, but do not indicate differences in the overall luminosity. The resulting spectra are presented in Fig.6.
Importantly, the mean and median spectra are similar at all wave-lengths, indicating that no single spectrum dramatically alters the results. The spectra are normalized at∼4000 Å, and so the variance is naturally small there (3–8 per cent depending on method). This choice does not affect the results; notably, the variance is similarly small at∼5000 and∼6000 Å (again 3–8 per cent). However, the variance at∼3000 Å is significantly higher (16–32 per cent), indi-cating that the exact wavelength of normalization does not change our results.
In addition to the large increase in variance from the optical to the near-UV, the scatter continues to increase to the far-UV. In particular, the median variance in the range 2500–3000 Å is roughly 24 per cent, while the median variance at 1800–2300 Å is
∼45 per cent. The increase in variance with decreasing wavelength extends the trend seen in previous studies (Foley et al.2008a,2012a; Ellis et al.2008; Maguire et al.2012) further into the UV.
The majority of this variance cannot be caused by incorrect red-dening. A random error of 0.05 mag for each SN reddening cor-responds to a typical scatter of 8 and 21 per cent at 2500–3000
and 1800–2300 Å, respectively. This means that the majority of the scatter (23 and 40 per cent, respectively) should be intrinsic to the SNe.
Similarly, differences in UV attenuation curves cannot cause the majority of the diversity. First, we performed a Monte Carlo ex-periment, where we took a set of nine UV spectra, reddened them by the amounts corresponding to the measured host-galaxy redden-ing for our set of SNe – but usredden-ing different reddenredden-ing laws, and then dereddening them using the same method we employ for our full analysis. We chose between the Cardelli et al. (1989) law, the Fitzpatrick (1999) law, and two Large Magellanic Cloud reddening laws Fitzpatrick (1999). For this case, the median flux variance is 1 and 5 per cent for wavelength ranges of 2500–3000 and 1800– 2300 Å, respectively.
Secondly, for the subset of six SNe with small host-galaxy red-dening (E(B−V)host<0.05 mag), the median flux variance is 37
and 35 per cent for wavelength ranges of 2500–3000 and 1800– 2300 Å, respectively. These values are similar to the variance of the full sample, which includes moderate-reddening SNe. Combined, the UV diversity must be primarily driven by intrinsic diversity in the SNe.
4 D I S C U S S I O N A N D C O N C L U S I O N S
We have compiled and analysed the first sample of near-maximum-light UV SN Ia spectra. This sample spans most of the parameter space of all SNe Ia, but still lacks examples of the fastest decliners and those with the highest ejecta velocity.
With this sample, we examine trends between UV spectral be-haviour and optical light-curve shape, ejecta velocity, and host-galaxy morphology. We find that the UV spectral continuum is driven primarily by light-curve shape, detecting only secondary correlations with ejecta velocity or host-galaxy morphology. We note that the lack of high-velocity SNe Ia in our sample prevents a thorough investigation of its impact on spectra. None the less, the velocities of UV spectral features broadly correlate with those of optical features.
Motivated by our initial investigations, we generated a UV spec-tral model that depends only on light-curve shape. This model is generally effective at describing the behaviour of the spectra in our sample. There are, however, notable differences. In particular, we find that SN 2011fe has significant excess flux atλ <2500 Å, consis-tent with previous findings (Foley & Kirshner2013). We interpret this difference as being caused by a particularly low-metallicity progenitor star for SN 2011fe.
We also find that ASASSN-14lp has a deficit of flux at λ < 2500 Å, indicating that it had a high-metallicity progenitor (at least relative to the other SNe Ia in our sample having similar light-curve shapes). This is a particularly intriguing result since the host galaxy of ASASSN-14lp, NGC 4666, is a superwind galaxy (Dahlem et al. 1997) with a high star formation rate and likely high metallicity.
Using several techniques, we found that the near-maximum-light spectral variance increases with decreasing wavelength from
∼4000 Å to at least 1800 Å. In particular, we find an increase in the variance from ∼5 to ∼25 to ∼45 per cent at 4000 to 3000 to 2000 Å, respectively. This dramatic rise in diversity at shorter wavelengths indicates that UV observations will be of limited utility for cosmology unless further standardization is identified.
With these results, we are now capable of discerning what ‘ad-ditional’ physics contributes to the diversity of SNe Ia beyond the amount of56Ni generated in the explosion. Future UV spectroscopy
of SNe Ia withHSTand Swift, while such capabilities exist, will fulfil this long-term goal.
AC K N OW L E D G E M E N T S
Based on observations made with the NASA/ESAHST, obtained from the Data Archive at the Space Telescope Science Institute, which is operated by the Association of Universities for Research in Astronomy, Inc., under NASA contract NAS 5–26555. These ob-servations are associated with programmes GO–4016, GO–12298, GO–12582, GO–12592, GO–13286, and GO–13646. We thank the STScI staff for accommodating our target-of-opportunity pro-grammes. A. Armstrong, R. Bohlin, S. Holland, S. Meyett, D. Sah-now, P. Sonnentrucker, and D. Taylor were critical for the execution of these programmes.
Swift spectroscopic observations were performed under pro-gramme GI–5080130; we are very grateful to N. Gehrels and the Swiftteam for executing the programme quickly.
RJF gratefully acknowledges support from NASA grant 14-WPS14-0048, NSF grant AST-1518052, and the Alfred P. Sloan Foundation. GP is supported by the Ministry of Economy, De-velopment, and Tourism’s Millennium Science Initiative through grant IC12009, awarded to The Millennium Institute of Astro-physics, MAS. AVF is grateful for financial assistance from NSF grant AST-1211916, the TABASGO Foundation, and the Christopher R. Redlich Fund. MS acknowledges generous sup-port provided by the Danish Agency for Science and Technol-ogy and Innovation realized through a Sapere Aude Level 2 grant.
We thank the many amateur and professional astronomers who continue to discover nearby, incredibly scientifically useful SNeand publicly announce their discovery. This research has made use of the NASA/IPAC Extragalactic Database (NED) which is operated by the Jet Propulsion Laboratory, California Institute of Technology, under contract with NASA.
R E F E R E N C E S
Amanullah R. et al., 2015, MNRAS, 453, 3300
Baron E., Hauschildt P. H., Nugent P., Branch D., 1996, MNRAS, 283, 297
Baron E. et al., 2015, MNRAS, 454, 2549 Betoule M. et al., 2014, A&A, 568, A22 Blondin S. et al., 2006, AJ, 131, 1648 Branch D. et al., 2006, PASP, 118, 560 Brown P. J. et al., 2015, ApJ, 805, 74
Cardelli J. A., Clayton G. C., Mathis J. S., 1989, ApJ, 345, 245 Cooke J. et al., 2011, ApJ, 727, L35
Dahlem M., Petr M. G., Lehnert M. D., Heckman T. M., Ehle M., 1997, A&A, 320, 731
Ellis R. S. et al., 2008, ApJ, 674, 51 Filippenko A. V. et al., 1992a, AJ, 104, 1543
Filippenko A. V. et al., 1992b, ApJ, 384, L15 Fitzpatrick E. L., 1999, PASP, 111, 63 Foley R. J., 2013, MNRAS, 435, 273 Foley R. J., 2014, Astron. Telegram, 6815 Foley R. J., 2015, Astron. Telegram, 7220 Foley R. J., Kasen D., 2011, ApJ, 729, 55 Foley R. J. et al., 2014, MNRAS, 443, 2887 Fraser M. et al., 2015, Astron. Telegram, 7209 Goobar A. et al., 2014, ApJ, 784, L12 Graham M. L. et al., 2015, MNRAS, 446, 2073
Hamuy M., Trager S. C., Pinto P. A., Phillips M. M., Schommer R. A., Ivanov V., Suntzeff N. B., 2000, AJ, 120, 1479
Hillebrandt W., Niemeyer J. C., 2000, ARA&A, 38, 191 H¨oflich P., Wheeler J. C., Thielemann F.-K., 1998, ApJ, 495, 617 Holoien T. W.-S. et al., 2014, Astron. Telegram, 6795
Howell D. A., 2001, ApJ, 554, L193
Im M., Choi C., Yoon S.-C., Kim J.-W., Ehgamberdiev S. A., Monard L. A. G., Sung H.-I., 2015, ApJS, 221, 22
Kasen D., Woosley S. E., 2007, ApJ, 656, 661
Kelly P. L., Hicken M., Burke D. L., Mandel K. S., Kirshner R. P., 2010, ApJ, 715, 743
Kim A. G. et al., 2014, ApJ, 784, 51 Kirshner R. P. et al., 1993, ApJ, 415, 589 Lampeitl H. et al., 2010, ApJ, 722, 566 Leibundgut B. et al., 1993, AJ, 105, 301
Lentz E. J., Baron E., Branch D., Hauschildt P. H., Nugent P. E., 2000, ApJ, 530, 966
Lentz E. J., Baron E., Branch D., Hauschildt P. H., 2001, ApJ, 557, 266
Maguire K. et al., 2012, MNRAS, 426, 2359 Marion G. H. et al., 2016, ApJ, 820, 92
Mazzali P. A., Podsiadlowski P., 2006, MNRAS, 369, L19
Mazzali P. A., Nomoto K., Cappellaro E., Nakamura T., Umeda H., Iwamoto K., 2001, ApJ, 547, 988
Mazzali P. A. et al., 2014, MNRAS, 439, 1959
Monard L. A. G. et al., 2015, Cent. Bur. Electron. Telegrams, 4081 Nugent P., Phillips M., Baron E., Branch D., Hauschildt P., 1995, ApJ, 455,
L147
Nugent P., Kim A., Perlmutter S., 2002, PASP, 114, 803 Pan Y.-C. et al., 2015, MNRAS, 452, 4307
Pereira R. et al., 2013, A&A, 554, A27 Perlmutter S. et al., 1999, ApJ, 517, 565 Phillips M. M., 1993, ApJ, 413, L105 Phillips M. M. et al., 1987, PASP, 99, 592
Phillips M. M., Wells L. A., Suntzeff N. B., Hamuy M., Leibundgut B., Kirshner R. P., Foltz C. B., 1992, AJ, 103, 1632
Phillips M. M., Lira P., Suntzeff N. B., Schommer R. A., Hamuy M., Maza J., 1999, AJ, 118, 1766
Phillips M. M. et al., 2013, ApJ, 779, 38 Pinto P. A., Eastman R. G., 2000, ApJ, 530, 757
Podsiadlowski P., Mazzali P. A., Lesaffre P., Wolf C., Forster F., 2006, preprint (astro-ph/0608324)
Rest A. et al., 2014, ApJ, 795, 44 Riess A. G. et al., 1998, AJ, 116, 1009 Sauer D. N. et al., 2008, MNRAS, 391, 1605 Schlafly E. F., Finkbeiner D. P., 2011, ApJ, 737, 103
Schlegel D. J., Finkbeiner D. P., Davis M., 1998, ApJ, 500, 525 Shappee B. J. et al., 2015, preprint (arXiv:1507.04257) Silverman J. M. et al., 2012, ApJ, 756, L7
Sullivan M. et al., 2010, MNRAS, 406, 782 Thorstensen J. et al., 2014, Astron Telegram, 6801
Timmes F. X., Brown E. F., Truran J. W., 2003, ApJ, 590, L83 Wang X. et al., 2009, ApJ, 699, L139
Wang X. et al., 2012, ApJ, 749, 126
S U P P O RT I N G I N F O R M AT I O N
Additional Supporting Information may be found in the online ver-sion of this article:
Table2. UV spectral model parameters.
(http://www.mnras.oxfordjournals.org/lookup/suppl/doi:10.1093/ mnras/stw1440/-/DC1).
Please note: Oxford University Press is not responsible for the content or functionality of any supporting materials supplied by the authors. Any queries (other than missing material) should be directed to the corresponding author for this article.