TítuloNH Hotel Group and the challenges of the hotel sector in Spain: economic and financial analysis of the company and its major competitor in the sector
67
0
0
Texto completo
(2) NH Hotel Group and the challenges of the hotel sector in Spain. Abstract The numerous difficulties and challenges brought on by the economic and financial crisis for tourism in Spain, a key industry for the Spanish economy because of its great contribution to the GDP, makes it very interesting to examine what is the current environment and future perspectives of tourism in Spain and, more specifically, of the hotel sector due to its great relevance and economic impact. Once established this framework, the main objective of this graduate thesis is to conduct a review of the internal situation of NH Hotel Group, one of the two listed companies of the hotel sector in Spain. The methodology applied has been conducting an economic and financial analysis of the company by studying in depth its annual accounts along with the calculation and interpretation of relevant ratios, based on information obtained from the CNMV, the SABI database, and the consolidated financial statements of the company covering the period 2007-2014 (latest publication of its annual accounts at the starting date of this paper). After performing this analysis it can be concluded that the results of NH do not reflect the positive trend of the tourism industry in Spain, and that despite having improved its performance over the last two years, the future evolution of the company is unclear since it has been forced to slow down its international expansion projects and has not yet managed to reduce its very high costs which place a heavy burden on its results.. Key words: Financial statement analysis, Accounting quality, Earnings management, Tourism, Hotel sector, NH Hotel Group.. Laura Santaolalla Lorenzo. 2.
(3) NH Hotel Group and the challenges of the hotel sector in Spain. Resumen Las numerosas dificultades y retos a los que se ha tenido que enfrentar el sector turístico en España, una de las actividades clave de la economía española debido a su elevada aportación al PIB nacional, durante la crisis económica y financiera, hacen que resulte muy interesante estudiar en qué situación se encuentra y cuáles son las perspectivas de futuro del turismo en España y, más concretamente, del sector hotelero debido a su gran relevancia e impacto económico. Una vez establecido el marco, el objetivo principal de este trabajo de fin de grado es llevar a cabo una revisión de la situación interna del Grupo NH Hoteles, una de las dos sociedades cotizadas del sector hotelero en España. La metodología aplicada ha sido la realización de un análisis económico-financiero de la empresa mediante el estudio en profundidad de sus cuentas anuales junto con el cálculo e interpretación de ratios financieros relevantes, en base a la información obtenida de la CNMV, de la base de datos SABI y de los estados financieros consolidados de la compañía abarcando el período 20072014 (última publicación de sus cuentas anuales a la fecha de inicio de este trabajo). Después de realizar este análisis se puede concluir que los resultados de NH no reflejan la tendencia positiva de la industria del turismo en España y, a pesar de haber mejorado su resultado durante los dos últimos años, la evolución futura de la empresa es incierta ya que se ha visto obligada a frenar sus proyectos de expansión internacional y aun no ha conseguido reducir sus elevados costes, los cuales suponen una gran carga sobre sus resultados.. Palabras clave: Análisis de estados financieros, Calidad de la contabilidad, Manipulación de beneficios, Turismo, Sector hotelero, NH Hotel Group.. Laura Santaolalla Lorenzo. 3.
(4) NH Hotel Group and the challenges of the hotel sector in Spain. Index. Introduction ................................................................................................................. 8 1. Overview of the role of tourism and the hotel industry in Spain .................... 10. 2. The quality of accounting information ............................................................. 14. 3. Financial statement analysis ............................................................................ 20 3.1. Patrimonial analysis ....................................................................................... 20. 3.1.1. Economic structure ................................................................................ 20 3.1.1.1 Non-current assets ........................................................................ 22 3.1.1.2 Current assets ............................................................................... 25. 3.1.2. Financial structure ................................................................................. 26 3.1.2.1 Equity ............................................................................................ 28 3.1.2.2 Non-current liabilities ..................................................................... 30 3.1.2.3 Current liabilities ............................................................................ 30. 3.2. 3.2.1. Net turnover ........................................................................................... 31. 3.2.2. Personnel expenses .............................................................................. 32. 3.2.3. Other operating expenses...................................................................... 34. 3.2.4. Leases ................................................................................................... 35. 3.2.5. Depreciations......................................................................................... 36. 3.2.6. Impairment and disposal of fixed assets ................................................ 37. 3.2.7. Total operating expenses ...................................................................... 38. 3.2.8. EBIT ...................................................................................................... 38. 3.3. 4. Economic analysis ......................................................................................... 31. Financial analysis ........................................................................................... 40. 3.3.1. Liquidity and efficiency........................................................................... 40. 3.3.2. Solvency ................................................................................................ 45. 3.3.3. Profitability ............................................................................................. 49. Comparison between NH and the Spanish companies in the sector ............. 53. Conclusion ................................................................................................................ 57 Bibliography .............................................................................................................. 61 Annexes..................................................................................................................... 64. Laura Santaolalla Lorenzo. 4.
(5) NH Hotel Group and the challenges of the hotel sector in Spain. Index of figures. Figure 1.1 Annual rate of change of tourism GDP compared to the total GPD of the Spanish economy, 2006-2015 (%) .................................................................... 13 Figure 2.1 Net income of NH, 2007-2014 (€ thousand) .............................................. 16 Figure 2.2 Net turnover of NH, 2007-2014 (€ thousand)............................................. 16 Figure 2.3 Net gains and losses from asset impairment of NH, 2011-2014 (€ thousand) ............................................................................................................... 17 Figure 2.4 Net gains and losses on disposal of non-current assets, 2011-2014 (€ thousand) ............................................................................................................... 18 Figure 2.5 Variation in the provision for onerous agreements, 2011-2014 (€) ............ 18 Figure 3.1 Average structure of assets of NH and Meliá, 2007-2014 (%) ................... 20 Figure 3.2 Evolution of the total assets of NH and Meliá, 2007-2014 (€) .................... 21 Figure 3.3 Structure of assets of NH by year, 2007-2014 (%) .................................... 21 Figure 3.4 Evolution of the number of rooms of NH by country, 2007-2014................ 24 Figure 3.5 Average structure of equity and liabilities of NH and Meliá, 2007-2014 (%) ............................................................................................................ 26 Figure 3.6 Evolution of equity and liabilities in NH, 2007-2014 (€ thousand) .............. 27 Figure 3.7 Evolution of equity and liabilities in Meliá, 2007-2014 (€ thousand) ........... 27 Figure 3.8 Structure of equity and liabilities of NH by year, 2007-2014 (%) ................ 27 Figure 3.9 Evolution of net turnover of NH and Meliá, 2007-2014 (€ thousand).......... 32 Figure 3.10 Evolution of personnel expenses of NH and Meliá as a percentage of net turnover, 2007-2014 (%) ................................................................................... 33 Figure 3.11 Evolution of other operating expenses of NH and Meliá as a percentage of net turnover, 2007-2014 (%)................................................................. 34 Figure 3.12 Evolution of lease rental of NH and Meliá as a percentage of net turnover, 2007-2014 (%) ................................................................................... 35. Laura Santaolalla Lorenzo. 5.
(6) NH Hotel Group and the challenges of the hotel sector in Spain. Figure 3.13 Evolution of depreciations of NH and Meliá as a percentage of net turnover, 2007-2014 (%) ................................................................................... 36 Figure 3.14 Evolution of impairment and disposal of fixed assets of NH and Meliá, 2007-2014 (€ thousand).............................................................................................. 37 Figure 3.15 Evolution of total operating expenses of NH and Meliá as a percentage of net turnover, 2007-2014 (%) ................................................................................... 38 Figure 3.16 Evolution of EBIT of NH and Meliá, 2007-2014 (€ thousand)................... 39 Figure 3.17 Breakdown of current assets for NH and Meliá, 2007-2014 (%) .............. 42 Figure 3.18 Evolution of the times interest earned ratio of NH and Meliá, 2007-2014 ................................................................................................................. 47 Figure 3.19 Comparison between net cash flow from operating activities and repayment of debts with credit institutions in NH, 2007-2014 (€ thousand) ................. 48 Figure 3.20 Evolution of the profit margin ratio of NH and Meliá, 2007-2014 (%) ....... 50 Figure 4.1 Evolution of total assets of NH and the hotel sector in Spain, 2007-2014 (€ thousand).............................................................................................. 54 Figure 4.2 Evolution of the ROA of NH and the hotel sector in Spain, 2007-2014 .................................................................................................................. 55 Figure 4.3 Evolution of the total asset turnover ratio of NH and the hotel sector in Spain, 2007-2014 .................................................................................................... 55 Figure 4.4 Evolution of the profit margin ratio of NH and the hotel sector in Spain, 2007-2014 .................................................................................................................. 56. Laura Santaolalla Lorenzo. 6.
(7) NH Hotel Group and the challenges of the hotel sector in Spain. Index of tables. Table 3.1 Vertical percentages of the main items of the assets of NH, 2007-2014 (%) ............................................................................................................ 22 Table 3.2 Evolution of the number of hotels and rooms of NH, 2007-2014 ................. 23 Table 3.3 Vertical percentages of the main items of the equity and liabilities of NH, 2007-2014 (%) ............................................................................................................ 28 Table 3.4 Vertical percentages of the main items of the income statement of NH, 2007-2014 (%) ............................................................................................................ 31 Table 3.5 Average people employed in NH and Meliá and indemnifications (€ thousand), 2007-2014............................................................................................. 33 Table 3.6 Comparison of the results of NH without taking into account net gains on the disposal of non-current assets (€ thousand) ..................................................... 39 Table 3.7 Current ratio of NH and Meliá, 2007-2014 .................................................. 41 Table 3.8 Acid-test ratio of NH and Meliá, 2007-2014................................................. 43 Table 3.9 Receivables turnover ratio of NH and Meliá, 2007-2014 ............................. 43 Table 3.10 Payables turnover ratio of NH and Meliá, 2007-2014 ................................ 44 Table 3.11 Debt-to-equity ratio of NH and Meliá, 2007-2014 ...................................... 45 Table 3.12 Structure of the debt of NH and Meliá, 2007-2014 .................................... 46 Table 3.13 Times interest earned ratio of NH and Meliá, 2007-2014 .......................... 47 Table 3.14 Return on total assets of NH and Meliá, 2007-2014 (%) ........................... 49 Table 3.15 Profit margin ratio of NH and Meliá, 2007-2014 (%) .................................. 50 Table 3.16 Total asset turnover of NH and Meliá, 2007-2014 ..................................... 51 Table 3.17 Return on common stockholders’ equity of NH and Meliá, 2007-2014 (%) ............................................................................................................ 52. Laura Santaolalla Lorenzo. 7.
(8) NH Hotel Group and the challenges of the hotel sector in Spain. Introduction Tourism constitutes one of the basic pillars of the Spanish economy, accounting for 12% of the gross domestic product (GDP) in 2014 (World Tourism Organisation, 2014) and being Spain one of the most visited destinations worldwide. Hence, because of the great importance of tourism for the Spanish economy, it is very relevant to study the evolution of its most important industry, the hotel sector, especially after the global economic crisis has presented numerous challenges to it. The aim of this paper is, at first, to examine the current context and future trends of tourism in Spain, paying special attention to the hotel sector. Nevertheless, the main objective is to perform a thorough analysis of the economic and financial situation of NH Hotel Group, an emblematic firm in the hotel sector, in order to issue founded opinions about its situation and performance in the hotel sector in Spain. With these targets in mind, the paper is divided into four chapters that will be explained below. Chapter one performs a general view of the role of tourism and the hotel sector in Spain. On the one hand, data provided highlights that tourism and the hotel sector are key in the proper functioning of the Spanish economy. On the other hand, the chapter also discusses the difficult years that the hotel sector in Spain had to endure during the deep economic and financial crisis and how, until 2014, the sector failed to return to competitive standards. The second chapter focuses on the importance of high-quality accounting practices and how the quality of the accounting and financial information provided by companies in their financial statements can directly impact their performance. More precisely, after a theoretical background of the concept of earnings management, the annual accounts of NH Hotel Group for the period 2007-2014 are studied in detail to see whether the company has made use of result manipulation through misleading or incomplete financial information. The third chapter performs a review of the internal situation of NH through an exhaustive study of its annual accounts. The first section conducts a patrimonial analysis through the study of the items in the balance sheet of the company; the. Laura Santaolalla Lorenzo. 8.
(9) NH Hotel Group and the challenges of the hotel sector in Spain. second section executes an economic analysis based on its income statement; and the last section performs a financial analysis by computing several ratios of liquidity, solvency and profitability for questions regarding the profitability and risk of the company in order to provide a broader view of the business situation of NH. Data were obtained from the Spanish National Stock Market Commission (CNMV) and from the consolidated financial statements of the firm and information about Meliá Hotels International, its main competitor in the sector, is provided in order to be able to make comparisons. And finally, chapter four seeks to analyse the performance of NH Hotel Group regarding the 50 largest companies in the Spanish hotel sector in which the company operates. To this end, the most important magnitudes of the annual accounts of these 50 companies were downloaded from the Spanish database SABI, and simple statistical calculations were made in order to discuss the results obtained more easily.. Laura Santaolalla Lorenzo. 9.
(10) NH Hotel Group and the challenges of the hotel sector in Spain. 1 Overview of the role of tourism and the hotel industry in Spain Tourism is the mainstay of the Spanish economy. In 2015, more than 68.1 million foreign tourists visited Spain, the highest figure in history, representing an increase of 4.9% with respect to 2014 (Frontur, 2016). Additionally, a poll conducted by the World Tourism Organization (2015) revealed that in 2014 Spain ranked second in tourism revenues worldwide, only after the United States, generating a total turnover of 49,100 million euros (Bank of Spain, 2016) and ranked third in arrivals with 65 million overnight visitors, just behind France and the United States. Hence, as tourism has historically been and continues to be one of the main pillars of economic development in Spain, accounting for 12% of the national GDP in 2014 (WTO, 2015), it is therefore crucial to study the evolution of its major industry: the hotel sector. Among all sectors that constitute the Spanish tourism industry, the hotel sector has become one of the branches of the tertiary area of greater importance and economic impact (Dominguez, Fraiz and Alén, 2011). In 2014, the 500 largest companies and hotel groups in Spain reached a combined turnover of 20,856 million euros (Alimarket Hotels, 2015), exceeding by 7.5% the 19,403 million euros that these same firms obtained in 2013. Once deflated by the consumer price index of 1.2% registered in 2014 for hotel establishments, the real growth of this sector was 6.4% (Spanish National Institute of Statistics, 2016). Unfortunately, the economic and financial crisis that began in 2007 in the major world economies lead to a widespread international economic downturn that promptly spread to Spain, adversely affecting both consumption and travel spending of Spain’s major emitting countries as well as its own domestic market. Thus, due to the decline in demand, the oversupply of existing hotels and the general decrease in rates in order to maintain occupancy levels, between 2007 and 2009 both prices and occupation fell, negatively impacting on hotel revenues. Nevertheless, in 2010 the sector began to recover; a recovery that took place earlier in the hotel leisure segment as Spain has taken longer to emerge from the crisis and this segment is less reliant on the domestic economy than the urban segment. From 2014 onwards the sector has returned to. Laura Santaolalla Lorenzo. 10.
(11) NH Hotel Group and the challenges of the hotel sector in Spain. competitive standards. The increase in business trips and getaways to cities in line with the economic recovery has resulted in an increase of 6.6% of the revenue per available room, RevPAR, of city hotels. It is noteworthy that, as this urban segment is more dependent on the domestic economy, hoteliers have had to make efforts in order not to raise prices despite the large increase of VAT in this sector. Additionally, resort hotels also closed 2014 with a positive balance, with an increase of 7.2% of the RevPAR (Spanish National Institute of Statistics, 2016). Factors behind these improvements have been the political and social instability of competitive destinations, as for instance Egypt, the growth of the issuer Russian market and the improvement of the disposable income of families of the main tourist-sending countries such as the UK, Germany and France. Furthermore, over the past few years, the hotel map of Spain has gone through a process of adjustment regarding the category of hotels. A study carried out by the School of Tourism and Hospitality (2014) reveals that despite the fact that there have been changes in the distribution of hotels by regions, between 2007 and 2014 the total number of establishments has remained fairly constant registering an increase of only 0.2%, counting Spain at the end of 2014 with a total of 14,728 establishments. However, whilst the number of one-star hotels has been reduced by 15% during this period, 4-star and 5-star hotels have experienced an increase of 27.6% and 20.8%, respectively. The luxury segment has also undergone significant boost, a fact that indicates that the quality of tourism in Spain continues to rise. Approximately 63 % of tourists who visited Spain in 2014 stayed in hotels (Institute for Tourism Studies, 2016). Notwithstanding, a trend that has adversely affected the sector is that the percentage of foreign tourists staying in rental housing grew 17.2% in 2014, resulting in four years in which its growth has been higher than the increase of tourists staying at hotels, which only grew by 5.3% in 2014 (Exceltur, 2015). This results in a lower economic impact of these tourists as a survey conducted by the Institute for Tourism Studies (2016) estimates that, without taking into account transport, tourists staying in rented houses spend an average of 67 euros per day, while this figure rises to 114 euros for tourists staying at hotels. Hence, in a sector characterized by the oversupply of accommodation capacity, 60.8% of Spanish hotel establishments estimate that they have suffered a decline in results between 0 and 5%. Laura Santaolalla Lorenzo. 11.
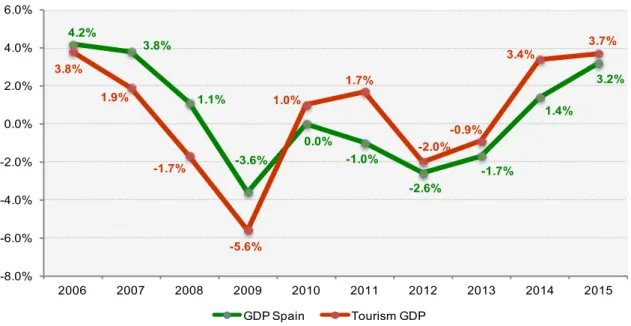
(12) NH Hotel Group and the challenges of the hotel sector in Spain. due to the exponential growth of the renting of unregulated holiday apartments (Exceltur, 2015). It is also believed that the hotel sector has played a significant role in ending the crisis (Gómez and González, 2014) as it has managed to resist to the severe economic recession. Data provided by the International Monetary Fund (2016) shows that in 2014 approximately 184,200 people directly worked in a hotel, and although this data reflects a decrease of almost 8% with respect to 2008, it represents an increase of almost 0.9% compared to 2013. Furthermore, direct employment generated by hotels amounts to 0.8% of the labour force, a figure that has remained practically unchanged since the outbreak of the economic crisis until today. To conclude, from a macroeconomic perspective, there are different opinions regarding the correlation and the importance of the evolution of tourism and the hotel sector on the Spanish economy. On the one hand, this mass tourism highly dependent on the economic trends of its main emitting countries, such as the UK, Germany, France and Italy, and concentrated during the summer months is said to lack competitiveness (Page, 2014). Even though the sector has contributed positively to the growth of the Spanish economy, data provided by the Spanish National Institute of Statistics (2016) reveals that the tourism GPD, and hence the hotel sector, has had a worse performance than the average of the national economy from 2006 to 2009, being 2009 particularly noteworthy since, as it is illustrated in Figure 1.1, the GDP of Spain fell 3.6% while its tourism GDP fell 5.6%. Even after 2010 the hotel sector has shown the evolution of a stagnant sector that has not been able to take full advantage of the improvement of the domestic economy because of its structural problems. Consequently, over the past decade the sector has experienced a significant decline in relative importance within the national GDP, a completely opposite trend that followed the tourist and hotel industry during the 1980s and 1990s, where tourism grew well above the rest of the economy (Exceltur, 2010).. Laura Santaolalla Lorenzo. 12.
(13) NH Hotel Group and the challenges of the hotel sector in Spain. Figure 1.1 Annual rate of change of tourism GDP compared to the total GPD of the Spanish economy, 2006-2015 (%) 6.0% 4.0%. 4.2%. 3.8%. 3.8% 2.0%. 3.2%. 1.7% 1.9%. 1.1%. 1.0%. 1.4%. 0.0% 0.0% -2.0%. -1.7%. -1.0%. -3.6%. -0.9% -2.0% -1.7% -2.6%. -4.0% -6.0% -8.0%. 3.7%. 3.4%. -5.6% 2006. 2007. 2008. 2009. 2010. GDP Spain. 2011. 2012. 2013. 2014. 2015. Tourism GDP. (Source: Own elaboration with data from Spain’s National Institute of Statistics, Exceltur and International Monetary Fund). On the other hand, from 2010 onwards tourism and the hotel sector have begun a path of growth, achieving real growth above the recorded by the Spanish economy. Whilst at the end of 2012 the weight of the tourism sector was only 10.9% of GDP, this reached 12% of the total Spanish GDP at the end of 2014. Additionally, the contribution of tourism to the GDP was valued at more than 112,000 million euros at the end of 2012 and, after two consecutive years on the rise, the value of tourism to the Spanish economy climbed to almost 116,500 million euros at the end of 2014. Finally, as the figures for 2015 are still provisional, if the industry were confirmed to have grown 3.2% during 2015, the contribution of tourism would amount to 120,000 million euros (Spanish National Institute of Statistics, 2016). All these arguments and data presented above highlight the fact that the hotel sector is of great strategic importance for the evolution of the Spanish economy and that therefore the industry has to become more profitable and competitive.. Laura Santaolalla Lorenzo. 13.
(14) NH Hotel Group and the challenges of the hotel sector in Spain. 2 The quality of accounting information In accordance with the International Accounting Standards or IAS (2007), the objective of financial statements is to provide information about the financial position, performance and changes in financial position of a firm that is useful to a wide range of users in making economic decisions. Additionally, in order to be helpful to readers, the information provided in financial statements must comply with the qualitative characteristics of relevance, reliability, understandability and comparability. More specifically, it is considered that financial information is relevant when it influences the economic decisions of users by helping them evaluate past, present and future and events; and that it is reliable when it is free from material error and represents faithfully, with neutrality, prudence and completeness, the financial statements of the firm (IAS, 2007). Therefore, as it has been demonstrated that generally investors do not entrust their funds to a company that provides inaccurate information; banks do not give credits unless they are provided with enough information about the likelihood of receiving interests and eventual repayment of the loan; suppliers may not wish to give credit to a firm which has a reputation for producing poor-quality information; and ultimately customers may distrust the company and choose to buy the products or services to the competition (Weetman, 2011), all these reasons evidence the great role that the quality of the financial statements of a company has in affecting its performance. One way to assess accounting quality is examining whether a company has made use of result manipulation through deceitful or incomplete financial reporting (Levitt, 1998), also referred to as earnings management. More concretely, earnings management occurs when managers use judgment in financial reporting and in structuring transactions to alter financial reports in order to mislead stakeholders about the real underlying economic performance of the company (Healy and Wahlen, 1999). However, the concept is not easily definable and, as Dechow and Skinner (2000) state, sometimes it is hard to distinguish certain forms of earnings management from appropriate accrual accounting choices. In particular, while financial-reporting choices that explicitly violate the International Financial Reporting Standards applicable to Spanish companies can clearly constitute both fraud and earnings management, it also. Laura Santaolalla Lorenzo. 14.
(15) NH Hotel Group and the challenges of the hotel sector in Spain. seems that systematic choices that are made within these regulations can constitute earnings management. Hence, it becomes very difficult to distinguish in practice earnings management from the legitimate exercise of accounting discretion. Shareholders of companies do not have the right of access to the records of the everyday activities of a business, and so they need someone to act on their behalf to ensure that managers are presenting a true and fair view of the company’s position and the profits generated during the financial year (Weetman, 2011). To achieve this certainty, shareholders appoint a firm of auditors to investigate the company’s financial statements and give an opinion on the truth and fairness of the financial information presented. In this manner, in all the years of the period being studied, from 2007 to 2014, the company that has audited the NH Hotel Group, Deloitte, has issued favourable audit reports in which the firm considered that the consolidated financial statements of NH presented fairly the financial position of the group. I agree with this opinion and consider that the financial statements of the company are reliable but, after having exhaustively studied both the consolidated financial statements and the corporate responsibility reports of the NH Hotel Group for all these years, I have found some evidence to suggest that the firm could have managed its results in 2012. Therefore, the following paragraphs present the different ways that a company has to disguise its financial statements and specifically discuss the technique that NH Hotels might have used in order to manipulate its financial results. One of the methods used to manage earnings is known as “income smoothing” and takes place when a company carefully times the recognition of its revenues and expenses to even out the amount of reported earnings in different years (Stice and Stice, 2014). This technique gives the company a sense of stability and reduced risk and can make it easier for the company to obtain loans as well as attract investors. This practice is closely linked to the technique known as “cookie jar reserves”, which consists on not declaring a portion of the proceeds during good years in order to save those profits for the bad years (Wild, Subramanyam and Halsey, 2007). When analysing the annual reports of the different periods, and as Figure 2.1 below shows, it can be observed the high volatility of the net income in each financial year, so that the idea of NH undertaking a strategy of “income smoothing” of its net income can be discarded.. Laura Santaolalla Lorenzo. 15.
(16) NH Hotel Group and the challenges of the hotel sector in Spain. Figure 2.1 Net income of NH, 2007-2014. Figure 2.2 Net turnover of NH, 2007-2014. (€ thousand) 150,000. (€ thousand) 1,750,000. 99,507. 1,500,000. 75,000 0. 10,501. 5,050 2007. 2008. 2009. 2010. 2011. 1,250,000 2012. -47,444. -75,000. 1,000,000 750,000. -115,110. -150,000. 2013 2014 -40,047 -10,440. 500,000. -225,000. 250,000. -300,000 -336,095. -375,000. 0. 2007. 2008. 2009. 2010. 2011. 2012. 2013. 2014. (Source: Own elaboration with data from the CNMV and NH Hotel Group consolidated financial statements). However, although it is true that the company has had a relatively flat net turnover throughout the period being studied, as it is reflected in Figure 2.2, no anomalies were found in the annual accounts with respect to revenue recognition and, consequently, this trend can be explained by a very similar rate of occupancy of its hotels in all these years. Notwithstanding, and although it can be a pure coincidence, there is evidence that indicates how in 2012 the company could have attempted to undertake the strategy that is known as “big bath”. The concept behind a big bath is that a company experiencing low earnings in a given year may take discretionary write-downs to further reduce earnings in the current period (Jordan and Clark, 2004), under the premise that the firm and its management team will not be punished proportionately more if the large losses of the company during a period become even larger. Thus, this technique is often implemented in a bad year to artificially enhance profits in the following years. One way to execute a big bath is through a large restructuring charge in which assets are written off and the expenses associated with future restructuring obligations are recognized immediately. Therefore, even though it is true that due to the deep economic downturn the year 2012 was by far the worst performance of the business, there are certain indicators that reveal how the group could have made these very bad results look even worse. For instance, every year NH assesses whether there is a loss of value that would oblige the company to reduce the carrying amounts of its tangible and intangible assets. In accordance with the accounting principles, a loss exists when the. Laura Santaolalla Lorenzo. 16.
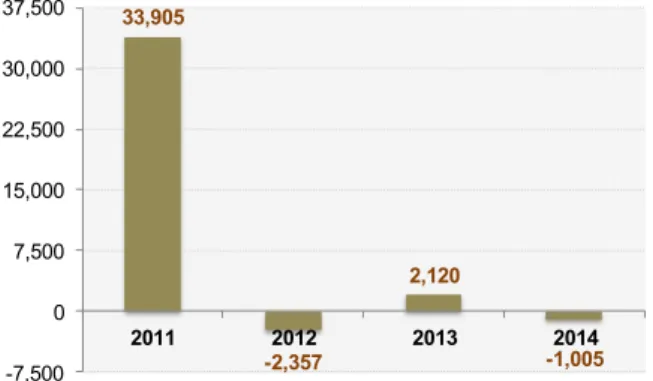
(17) NH Hotel Group and the challenges of the hotel sector in Spain. recoverable value of the asset, which is either the net sale value or the value in use, whichever is higher, is less than its carrying amount. Nevertheless, as illustrated in Figure 2.3, the amount of losses from asset impairment in NH during 2012 draws much attention. It could have been that in that year, since results were already terrible, the company strictly tested the recoverable amount of its owned hotels and, as the estimated recoverable amount of many of its hotels in Spain and Italy was lower than its carrying amount, NH adjusted the recoverable value of its assets by deciding to increase the asset impairment provision that the company had been recording up to a total of 268 million euros to avoid having to incur these costs in subsequent years. Consequently, instead of incurring in a net loss of 66.9 million euros in 2012, the group closed the year with a consolidated net loss of 337 million euros. However, in 2013 and 2014 certain of these impairment losses were subsequently reversed and as a result the carrying amount of these assets was increased, always with the limit of the original value at which these assets were recognized before the loss of value was recognised, and thereby becoming a revenue for the NH, making its results slightly better than what they should be. Figure 2.3 Net gains and losses from asset impairment of NH, 2011-2014 (€ thousand) 50,000 0. -50,000. 28,103 2011 -7,369. 2012. 2013. 12,810. 2014. -100,000 -150,000. -200,000. -199,366. -250,000. (Source: Own elaboration with data from the CNMV and NH Hotel Group consolidated financial statements). Moreover, during 2012 the group also de-recognised furnishing, facilities and equipment as a result of the withdrawal from unprofitable hotels and the cancellation of lease agreements. Therefore, even if the volume was not very high, as reflected in Figure 2.4, 2012 became the first year in which the company incurred material losses from the disposal of non-currents assets.. Laura Santaolalla Lorenzo. 17.
(18) NH Hotel Group and the challenges of the hotel sector in Spain. Figure 2.4 Net gains and losses on disposal of non-current assets, 2011-2014 (€ thousand) 37,500. 33,905. 30,000 22,500. 15,000 7,500. 0. 2,120 2011. -7,500. 2012 -2,357. 2013. 2014 -1,005. (Source: Own elaboration with data from the CNMV and NH Hotel Group consolidated financial statements). Furthermore, NH considers onerous agreements as those in which the inevitable costs of fulfilling the obligations these entail exceed the economic benefits that are expected from them. These provisions are measured at the best estimate, including risks and uncertainties, of the differences arising between the costs and benefits of the contracts or the compensations expected for the abandonment of these contracts, and during 2012 provisions for liabilities and charges in NH grew inordinately, recording the group an expense of 57 million euros. The company recorded provisions for a number of hotel lease agreements, to which it is committed between 2013 and 2030, and on which the group makes an operating loss, as onerous, as the cancellation of these agreements could force the company to make full payment of rent for the outstanding years of the lease. However, these forecasts could have again been exaggerated as these provisions were partially reversed in 2013 and 2014. Figure 2.5. Variation in the provision for onerous agreements, 2011-2014 (€) 30,000 15,000. 0 -15,000. 8,167 2011. 6,642 2012. 2013. 14,721. 2014. -30,000. -45,000 -60,000. -57,546. -75,000. (Source: Own elaboration with data from the CNMV and NH Hotel Group consolidated financial statements). Laura Santaolalla Lorenzo. 18.
(19) NH Hotel Group and the challenges of the hotel sector in Spain. In this way, during 2013 and 2014 NH incurred losses of 40 and 10.4 million euros respectively but if the company had not conducted this strategy similar to a big bath these losses would have been much higher in comparison to those suffered in 2012. Lastly, new CEOs sometimes use the big bath so they can blame the poor performance of the company on the previous CEO and take credit for the improvements in the following years. This is further evidence as Mariano Pérez Claver had been the CEO of NH Hotel Group during 2010 and 2011 and, in 2012, Rodrigo Echenique Gordillo took his place, a position he has held for 2013 and 2014. Besides, shortly after Rodrigo Echenique Gordillo occupied the post, the hotel chain announced a change of its corporate name and renamed itself as it is known nowadays, NH Hotel Group, with the aim of cutting ties with the past and start from clean slate. All these evidences above described that indicate a possible big bath strategy in 2012 have implications for the economic and financial analysis of the financial statements of the group that it is going to be performed in the following chapter. More specifically, the accounting information for the years 2013 and 2014 should be carefully studied insomuch as the apparent recovery of NH during 2013 and 2014, which will be explained below, can be partially attributed to the overestimation of impairment losses in 2012.. Laura Santaolalla Lorenzo. 19.
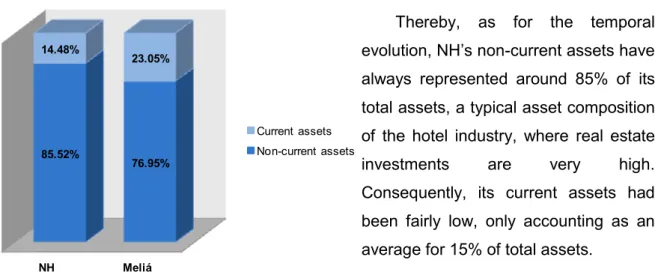
(20) NH Hotel Group and the challenges of the hotel sector in Spain. 3 Financial statement analysis This chapter conducts a review of the internal situation of NH Hotels by studying in depth its annual accounts and by comparing them, when appropriate, with those of its major competitor in Spain, Meliá Hotels. The data has been obtained from the CNMV, which is the regulatory body of the Spanish Stock Market, and from the consolidated financial statements of both firms. The first section performs a patrimonial analysis by discussing both the economic structure of the company through the analysis of its assets and the financial structure, this is, the different sources of funding used by the company: shareholders’ equity and liabilities. The second section performs an economic analysis by examining the main components of the income statement of NH. Finally, the third section carries out the calculation and interpretation of relevant ratios to provide additional information.. 3.1 Patrimonial analysis 3.1.1 Economic structure To begin with, when conducting the percentage analysis of the economic structure of NH Hotels and its main competitor in Spain, Meliá Hotels, in order to be able to make comparisons, it can be seen the great weight that on a recurrent basis noncurrent assets have had in each of the companies, which is depicted in the figure below. Figure 3.1. Average structure of assets of NH and Meliá, 2007-2014 (%). Thereby, 14.48%. as. for. the. temporal. evolution, NH’s non-current assets have. 23.05%. always represented around 85% of its total assets, a typical asset composition Current assets 85.52%. 76.95%. Non-current assets. of the hotel industry, where real estate investments. are. very. high.. Consequently, its current assets had been fairly low, only accounting as an NH. Meliá. average for 15% of total assets.. (Source: Own elaboration with data from the CNMV and NH and Meliá consolidated financial statements). Laura Santaolalla Lorenzo. 20.
(21) NH Hotel Group and the challenges of the hotel sector in Spain. As evidenced in Figure 3.2, the highest value of total assets for NH was reached in 2009, but from that year onwards the effects of the economic downturn forced the company to get rid of its non-strategic assets that were reporting the lowest benefits, as it will be discussed next, and consequently NH closed the year 2014 with a total level of assets nearly 25% lower than in 2009. On the contrary, the asset structure of its competitor Meliá Hotels for the period 2007-2014 is stronger and reflects steady growth, primarily because of its greater seniority in the sector. Thus, despite the fact that Meliá has experienced some financial fluctuations over recent years, the company has managed to increase the value of its assets by 12.22% in these past 8 years. Figure 3.2 Evolution of the total assets of NH and Meliá, 2007-2014 (€) 4,000,000 3,500,000 3,000,000 2,500,000. 2,000,000 1,500,000. 2007. 2008. 2009. 2010 NH. 2011. 2012. 2013. 2014. Meliá. (Source: Own elaboration with data from the CNMV and NH Hotel Group consolidated financial statements). However, it is noteworthy that non-current assets have had a greater weight in NH than in its competitor and, despite having fallen by almost 5% in 2014 with respect to 2013, as can be seen in Figure 3.3, they still accounted for 80.19% of total assets in comparison to 74.37% in Meliá. Figure 3.3 Structure of assets of NH by year, 2007-2014 (%) 12.62%. 10.66%. 87.38%. 89.34%. 2007. 2008. 15.99%. 15.33%. 13.42%. 12.86%. 15.13%. 84.01%. 84.67%. 86.58%. 87.14%. 84.87%. 2009. 2010. 2011. 2012. 2013. Non-current assets. 19.81%. 80.19%. 2014. Current assets. (Source: Own elaboration with data from the CNMV and NH Hotel Group consolidated financial statements). Laura Santaolalla Lorenzo. 21.
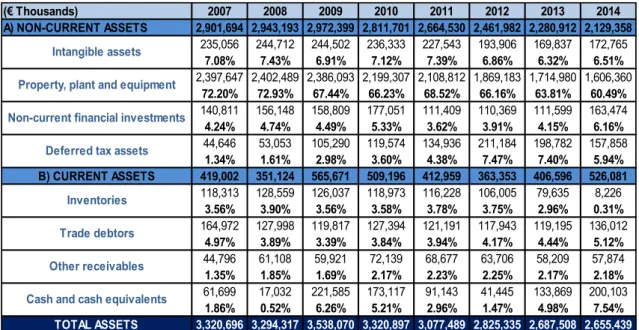
(22) NH Hotel Group and the challenges of the hotel sector in Spain. It is conducted in the following table a vertical analysis of the key items comprising NH’s assets, as this technique emphasizes the relative weight of each of these items and helps reveal significant changes in the materiality and relative importance of them. These percentages are calculated by dividing the items under analysis by a base amount, in order to avoid differences that may be owed to the different size of companies, and which in this case is the total amount of assets. The table reports only some of the main elements of the assets of NH and the full balance sheet can be found in the Table 1 of Annex 1. Table 3.1 Vertical percentages of the main items of the assets of NH, 2007-2014 (%) (€ Thousands) A) NON-CURRENT ASSETS. 2007 2008 2009 2010 2011 2012 2013 2014 2,901,694 2,943,193 2,972,399 2,811,701 2,664,530 2,461,982 2,280,912 2,129,358 235,056 244,712 244,502 236,333 227,543 193,906 169,837 172,765 Intangible assets 7.08% 7.43% 6.91% 7.12% 7.39% 6.86% 6.32% 6.51% 2,397,647 2,402,489 2,386,093 2,199,307 2,108,812 1,869,183 1,714,980 1,606,360 Property, plant and equipment 72.20% 72.93% 67.44% 66.23% 68.52% 66.16% 63.81% 60.49% 140,811 156,148 158,809 177,051 111,409 110,369 111,599 163,474 Non-current financial investments 4.24% 4.74% 4.49% 5.33% 3.62% 3.91% 4.15% 6.16% 44,646 53,053 105,290 119,574 134,936 211,184 198,782 157,858 Deferred tax assets 1.34% 1.61% 2.98% 3.60% 4.38% 7.47% 7.40% 5.94% B) CURRENT ASSETS 419,002 351,124 565,671 509,196 412,959 363,353 406,596 526,081 118,313 128,559 126,037 118,973 116,228 106,005 79,635 8,226 Inventories 3.56% 3.90% 3.56% 3.58% 3.78% 3.75% 2.96% 0.31% 164,972 127,998 119,817 127,394 121,191 117,943 119,195 136,012 Trade debtors 4.97% 3.89% 3.39% 3.84% 3.94% 4.17% 4.44% 5.12% 44,796 61,108 59,921 72,139 68,677 63,706 58,209 57,874 Other receivables 1.35% 1.85% 1.69% 2.17% 2.23% 2.25% 2.17% 2.18% 61,699 17,032 221,585 173,117 91,143 41,445 133,869 200,103 Cash and cash equivalents 1.86% 0.52% 6.26% 5.21% 2.96% 1.47% 4.98% 7.54% TOTAL ASSETS 3,320,696 3,294,317 3,538,070 3,320,897 3,077,489 2,825,335 2,687,508 2,655,439 (Source: Own elaboration with data from the CNMV and NH Hotel Group consolidated financial statements). Next, it is going to be analysed in greater detail the main headings that comprise the assets of NH Hotels.. 3.1.1.1 Non-current assets Starting with NH’s non-current assets, they can be briefly defined as those assets and rights controlled by the company that are expected to contribute to its activities over a long period of time. In this section it is remarkable the heading of property, plant and equipment, since it represents on average 67.23% of total assets. This is consistent with the type of business NH is, as the firm has a large hotel plant. Laura Santaolalla Lorenzo. 22.
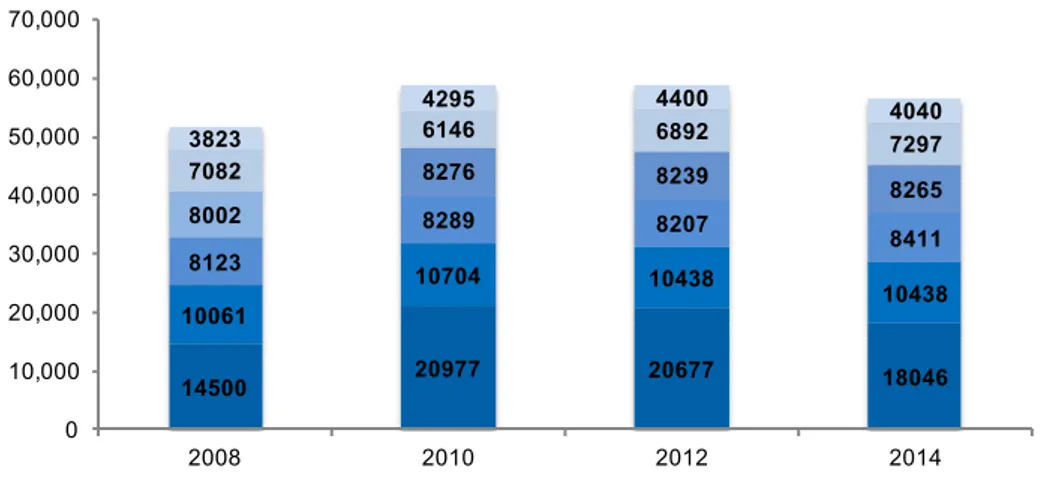
(23) NH Hotel Group and the challenges of the hotel sector in Spain. distributed throughout the world that was enlarged very significantly in 2009 when NH began the process of integration with Hesperia. As illustrated in Table 3.2, this merger added a large number of hotels to NH’s portfolio. Table 3.2 Evolution of the number of hotels and rooms of NH, 2007-2014 2007. 2008. 2009. 2010. 2011. 2012. 2013. Number of hotels. 341. 345. 401. 397. 397. 391. 379. 2014 363. Number of rooms. 49,677. 51,591. 61,311. 58,687. 59,052. 58,853. 58,195. 57,127. (Source: Own elaboration with data from NH Hotel Group consolidated financial statements). However, as evidenced by the vertical percentages in Table 3.1, the trend shows a drop in its weight relative to total assets, primarily because of the strategic initiative that involved better asset management and hence the exit of establishments during the economic crisis that were failing to meet the expectations of the group. As a result, the value of these tangible assets was in 2014 32.68% lower than in 2007, while for Meliá the trend was quite the opposite: property, plant and equipment was worth in 2014 21.73% more than in 2007. The streamlining of NH’s portfolio, as reflected in the chart below, began in 2012 when the chain exited 10 establishments in Spain, Italy, Germany, UK and Czech Republic. In the same way, in 2013 the company continued lessening its hotel portfolio by reducing its number of establishments by fourteen, mainly in Spain and Italy, as it is reflected in Figure 3.4, since the economic recession hit these two countries more severely, and twelve projects, which had already been signed, were cancelled. Lastly, in 2014 numerous actions were carried out in this context as NH reduced its number of establishments by 20 in 15 cities in Spain, representing a total of 1,859 rooms; sold one of its hotels with more historical significance in the company, the Grand Krasnapolsky in Amsterdam; signed a pre-contract with the US real estate group HPT for the sale of five hotels in Latin America by 70 million euros; and finally, sold 97% of Sotogrande S.A. for 225 million euros, a measure that allowed NH to keep other strategic assets for the firm and at the same time obtain funding for the new Strategic Plan of the company, which will be conducted between 2014 and 2018.. Laura Santaolalla Lorenzo. 23.
(24) NH Hotel Group and the challenges of the hotel sector in Spain. Figure 3.4 Evolution of the number of rooms of NH by country, 2007-2014 70,000 60,000 50,000. 4400 6892. 8276. 8239. 8289. 8207. 10704. 10438. 20977. 20677. 18046. 2010. 2012. 2014. Belgium, Netherlands, Luxembourg. Italy. 3823 7082. 40,000. 8002. 30,000. 8123. 20,000. 10061. 10,000. 14500. 0. Spain. 4295 6146. 2008 Germany. 4040 7297 8265 8411 10438. Latin America. Rest of world. (Source: Own elaboration with data from NH Hotel Group consolidated financial statements). In short, the total outflows of these operations were primarily invested in renovating numerous hotels, with the addition of only a few new ones to its portfolio. For instance, and only because the financial equilibrium had been restored and the group had been taking steps in order to return to growth, in 2014 NH added nine hotels to its portfolio, four new openings and five agreements that had already been signed. Nevertheless, these openings were still far from the levels that were achieved in the years 2008 and 2009 and, as a result, NH has reduced in 4,184 its number of rooms available since 2009, which has resulted in its total level of assets in 2014 to stand at levels prior to 2007, more precisely similar to those of 2006, amounting to 2,700 million euros. Besides, and unsurprisingly, all these divestments have had a direct impact on sales, as will be seen in greater detail below in the third section when the net turnover is assessed, with a drop of almost 60 million euros in 2012 and 54 million euros in 2013. Due to the uncertainty that still runs through NH, at present the company continues with a policy of operating its hotels under less capital-intensive forms. Thus, NH has completely cancelled direct acquisitions and has modified existing leases by virtue of other less expensive methods such as franchises. Finally, and with the objective of narrowing the gap that has been created between the company and its direct competitors in Spain, particularly with Meliá, the group has announced that among the main measures of its Strategic Plan are continuing with the sale of nonstrategic assets alongside with hotel refurbishment, new technologies for online sales and a renewed brand structure. Laura Santaolalla Lorenzo. 24.
(25) NH Hotel Group and the challenges of the hotel sector in Spain. 3.1.1.2 Current assets Continuing with the current assets of NH, they are those assets that are expected to be consumed or converted into cash within the company’s normal operating cycle. Current assets in NH have experienced a rising trend, going from weighting 12.62% of total assets in NH in 2007 to 19.81% in 2014. However, Meliá has experienced a similar but even more pronounced tendency because during these last eight years its level of current assets has grown by 10%. The main items comprising the current assets of NH are inventories, cash and cash equivalents and trade debtors, the latter being those that have the greatest weight under the heading of current assets despite being its weight small when compared to total assets. Beginning with inventories, they have a reduced weight in NH given that companies in the hospitality industry do not have large stocks. Basically, in these companies inventory is composed of bed linen, towels and toiletries, among others. However, it is noteworthy that NH had real estate stocks classified as inventory that consisted of buildings under construction and complete, developed land, undeveloped land and ancillary materials owing to its real estate operations through Sotogrande S.A. Therefore, as already discussed earlier, after the sale of Sotogrande S.A. which took place in 2014, NH no longer holds inventories of this nature and this is why, as depicted in Table 3.1, the weight of NH’s inventories with respect to its total assets has gone from 3.58% as an average for the period 2007-2013 to only 0.31% in 2014. Treasury, which consist of cash, demand deposits and other short-term and highly liquid investments that can be realised in cash quickly, is the item that has experienced the largest variation under this heading throughout the period being studied, and is the main raison why current assets of NH have less weight over total assets than Meliá’s: while the average percentage for the past eight years of cash and cash equivalents over total assets has been 11.73% for Meliá, it has only been less than half in NH, hovering around 3.85%. The money NH has had in its bank accounts was already scarce since the beginning of the period being studied, a policy which, as will be discussed in the following sections, resulted in a high financial leverage. Cash was particularly scarce during 2007, 2008 and in 2012 and thus, as NH did not have large cash flows to cover new investments, the company had no choice but to sell, as it was. Laura Santaolalla Lorenzo. 25.
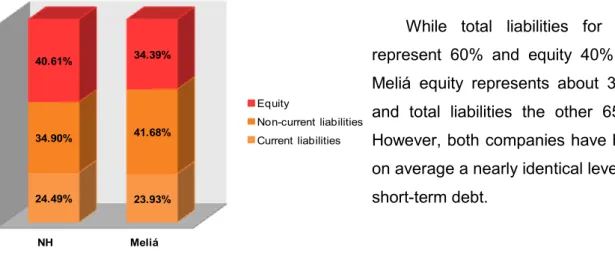
(26) NH Hotel Group and the challenges of the hotel sector in Spain. previously explained above, its less profitable assets in order to obtain some liquidity. Fortunately, these measures appear to have functioned as, since 2013 and 2014, NH’s immediate liquidity position has started to improve. Likewise, the financial support that the company has obtained after successfully refinancing its debt, which will be discussed in the next section when analysing the financial structure of the company, has served to increase its available cash. Finally, it must be mentioned that NH maintains a fairly steady rate of its accounts receivable in the short-term, always oscillating along the entire period between 117 and 164 million euros. When compared with those of its competitor Meliá, although they are quite superior in Meliá if looking merely to figures, both companies exhibit a similar tendency with regard to its weight on total assets, hovering around 4% as an average in both companies. This proves that in this industry trade debtors do not have a large weight overall because customers usually pay in cash.. 3.1.2 Financial structure This section analyses the financial structure of NH, which is composed of equity and both non-current and current liabilities. Whilst the economic structure exhibit certain similarities at a general level between NH and its competitor Meliá, on the funding side, as reflected in Figure 3.5, certain differences can be appreciated. Figure 3.5 Average structure of equity and liabilities of NH and Meliá, 2007-2014 (%). While total liabilities for NH 40.61%. represent 60% and equity 40%, in. 34.39%. Meliá equity represents about 35% Equity 34.90%. 41.68%. Non-current liabilities Current liabilities. and total liabilities the other 65%. However, both companies have had on average a nearly identical level of. 24.49%. NH. 23.93%. short-term debt.. Meliá. (Source: Own elaboration with data from the CNMV and NH and Meliá consolidated financial statements). Laura Santaolalla Lorenzo. 26.
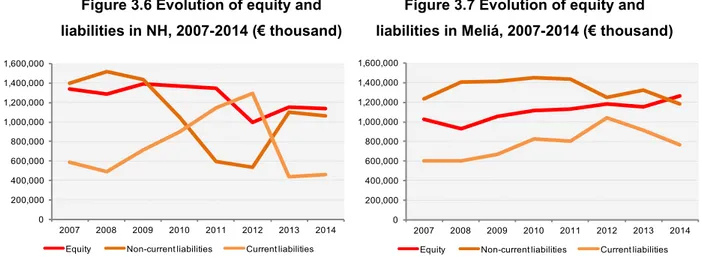
(27) NH Hotel Group and the challenges of the hotel sector in Spain. Analysing these past eight years it can be seen that overall Meliá has increased its current liabilities to the detriment of its non-current liabilities and equity has remained fairly constant, slightly increasing its weight as compared to 2007.. Figure 3.6 Evolution of equity and. Figure 3.7 Evolution of equity and. liabilities in NH, 2007-2014 (€ thousand). liabilities in Meliá, 2007-2014 (€ thousand). 1,600,000. 1,600,000. 1,400,000. 1,400,000. 1,200,000. 1,200,000. 1,000,000. 1,000,000. 800,000. 800,000. 600,000. 600,000. 400,000. 400,000. 200,000. 200,000. 0. 2007 Equity. 2008. 2009. 2010. 2011. Non-current liabilities. 2012. 2013. 0. 2014. Current liabilities. 2007. 2008. Equity. 2009. 2010. 2011. 2012. Non-current liabilities. 2013. 2014. Current liabilities. (Source: Own elaboration with data from the CNMV and NH and Meliá consolidated financial statements). However, in the case of NH, the behaviour of both its equity and liabilities cannot be briefly described at first, as it has not followed a clear and distinct trend, as it is shown in Figure 3.7. Thus, on the one hand, it can be stated that own resources are widely used as a source of funding in NH since equity has always represented a fairly high percentage, although it varies from 43.67% in 2012 to 35.39% in 2012, as depicted below. Figure 3.8 Structure of equity and liabilities of NH by year, 2007-2014 (%). 40.35%. 39.19%. 39.31%. 41.22%. 43.67%. 35.39%. 42.92%. 42.81%. 40.91%. 39.95%. 16.17%. 17.24%. 2013. 2014. 18.88%. 42.07%. 46.05%. 17.58%. 14.76%. 2007. 2008. 40.53%. 20.16%. 2009. 31.60%. 27.18%. 2010. Current liabilities. 19.21%. 37.12%. 2011. 45.73%. 2012. Non-current liabilities. Equity. (Source: Own elaboration with data from the CNMV and NH and Meliá consolidated financial statements). Laura Santaolalla Lorenzo. 27.
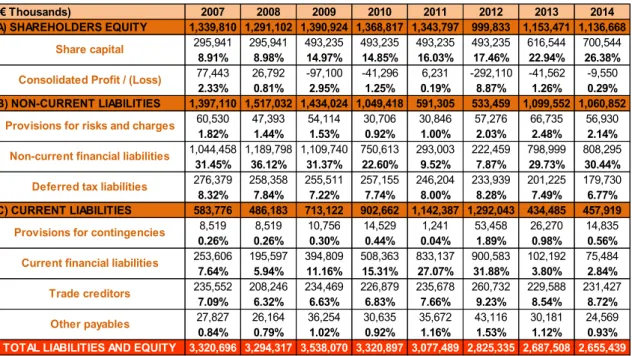
(28) NH Hotel Group and the challenges of the hotel sector in Spain. On the other hand, it is going to be explained next why there have been such fluctuations and sudden changes throughout the period being studied in the weight of both its short-term debt and long-term debt, especially between 20011 and 2013. In any case, it can be affirmed that overall NH finances itself with far more long-term debt than short-term debt. Now, and using the vertical percentages calculated in Table 3.3, the main elements that compose this heading are going to be analysed in greater detail. Again, the table presents only some of the key elements of the shareholders’ equity and liabilities of NH, and a complete balance sheet that discloses all elements can be found in the Table 2 of Annex 1. Table 3.3 Vertical percentages of the main items of the equity and liabilities of NH, 2007-2014 (%) (€ Thousands) A) SHAREHOLDERS EQUITY Share capital Consolidated Profit / (Loss) B) NON-CURRENT LIABILITIES Provisions for risks and charges Non-current financial liabilities Deferred tax liabilities C) CURRENT LIABILITIES Provisions for contingencies Current financial liabilities Trade creditors Other payables TOTAL LIABILITIES AND EQUITY. 2007 1,339,810 295,941 8.91% 77,443 2.33% 1,397,110 60,530 1.82% 1,044,458 31.45% 276,379 8.32% 583,776 8,519 0.26% 253,606 7.64% 235,552 7.09% 27,827 0.84% 3,320,696. 2008 1,291,102 295,941 8.98% 26,792 0.81% 1,517,032 47,393 1.44% 1,189,798 36.12% 258,358 7.84% 486,183 8,519 0.26% 195,597 5.94% 208,246 6.32% 26,164 0.79% 3,294,317. 2009 2010 2011 2012 2013 2014 1,390,924 1,368,817 1,343,797 999,833 1,153,471 1,136,668 493,235 493,235 493,235 493,235 616,544 700,544 14.97% 14.85% 16.03% 17.46% 22.94% 26.38% -97,100 -41,296 6,231 -292,110 -41,562 -9,550 2.95% 1.25% 0.19% 8.87% 1.26% 0.29% 1,434,024 1,049,418 591,305 533,459 1,099,552 1,060,852 54,114 30,706 30,846 57,276 66,735 56,930 1.53% 0.92% 1.00% 2.03% 2.48% 2.14% 1,109,740 750,613 293,003 222,459 798,999 808,295 31.37% 22.60% 9.52% 7.87% 29.73% 30.44% 255,511 257,155 246,204 233,939 201,225 179,730 7.22% 7.74% 8.00% 8.28% 7.49% 6.77% 713,122 902,662 1,142,387 1,292,043 434,485 457,919 10,756 14,529 1,241 53,458 26,270 14,835 0.30% 0.44% 0.04% 1.89% 0.98% 0.56% 394,809 508,363 833,137 900,583 102,192 75,484 11.16% 15.31% 27.07% 31.88% 3.80% 2.84% 234,469 226,879 235,678 260,732 229,588 231,427 6.63% 6.83% 7.66% 9.23% 8.54% 8.72% 36,254 30,635 35,672 43,116 30,181 24,569 1.02% 0.92% 1.16% 1.53% 1.12% 0.93% 3,538,070 3,320,897 3,077,489 2,825,335 2,687,508 2,655,439. (Source: Own elaboration with data from the CNMV and NH Hotel Group consolidated financial statements). 3.1.2.1 Equity Starting with equity, an outstanding element in this heading is share capital, as it has experienced significant growth during 2013 and 2014, arriving to reach during the last year 26.38% of total equity and liabilities as compared to just 8.91% in 2007. NH’s share capital has been rising driven by the increasing number of shares held by the Laura Santaolalla Lorenzo. 28.
(29) NH Hotel Group and the challenges of the hotel sector in Spain. group, given that during the period being analysed, the General Meeting of Shareholders of the parent company approved three capital increases. The first one was held in 2009, through the issuance of over 98 million new shares. Then again, in order to get external financing, NH announced a second capital increase in 2013, with the issuance of more than 300 million new shares that were fully subscribed and paid by the Chinese group HNA. Thanks to this operation NH got liquidity amounting to 234 million euros, in exchange for ceding to HNA a 20% of its share capital. However, and due to the difficult financial situation that the company was facing and the fact that NH had not distributed dividends since 2008, at the end of 2013 and start of 2014, all financial institutions that had participation in the shareholding of NH, such as Bankia, Ibercaja and Nova Galicia, among others, sold their shares (El País, 2013). Thus finally, the last capital increase in 2014 involved the issuance of 42 million new ordinary shares. In this way, at 31 December 2014, the Parent Company’s share capital after the capital increase was represented by more than 350 million fully subscribed and paid up bearer shares with a nominal value of 2 euros each. Recently, on January 28 2014, HNA has purchased an extra 12.5 million shares of NH owned by Pontegadea, so that the Chinese group currently controls 24.06% of the Spanish hotel chain. On the contrary, it draws attention in a negative manner the loss for the year 2012 as, after having shown profits of 6.2 million euros in 2011, the company incurred in a loss of -292.1 million euros. As already explained in the chapter of accounting quality, from NH they maintain that given the poor economic situation of the market mainly in Spain and Italy, the main countries where NH conducts its business, the company had to greatly increase the provision for impairment of assets. In 2013 the final loss for the financial year decreased to -41.5 million euros, an 85.7% lower than the previous year, as the company did not longer had to record provisions for impairment of its assets and part of these were reversed, artificially inflating the result for 2013 and 2014 as without these reversions of the impairment provision the loss would be higher. Besides, the loss was lower thanks partly to the rise of recurring revenues to 1,265.1 million euros, 12.5 million euros more than the previous year, and the increased net capital gains of non-recurring activities.. Laura Santaolalla Lorenzo. 29.
(30) NH Hotel Group and the challenges of the hotel sector in Spain. 3.1.2.2 Non-current liabilities Following with the company’s non-current liabilities, they are formed up by deferred tax liabilities, provisions for risk and charges but mainly by non-current financial liabilities. Taking a look at both Figure 3.8 and Table 3.3, it can be observed that NH’S non-current financial liabilities greatly decreased during 2011 and 2012, given that in those years NH failed to comply with debt covenants and debts matured because of this failure. Nevertheless, during the last quarter of 2013, and consistent with the low liquidity that the firm had had the previous years, the company negotiated with its creditors and managed to reclassify its short-term debt to long-term debt by fully refinancing its debt through various loans, for a total of 775 million euros, thereby improving the quality of its debt. These loans obtained were divided into convertible bonds, covered bonds, a syndicated loan and two subordinated loans. Therefore, this is the reason why from 2012 to 2013 NH’s non-current liabilities increased 106.12% and its current liabilities decreased 66.37%. In this way, NH managed to lengthen the maturity of its debt in different periods, of which more than half mature from 2018 onwards.. 3.1.2.3 Current liabilities Lastly, to end with the financial structure, current liabilities in NH had a growing and very high evolution until 2012, when they reached 45.73% of total liabilities and shareholders’ equity, against the 17.58% of 2007. They consist mainly of current financial liabilities and trade creditors, and whereas the weight of NH’s trade creditors has remained steady between 6 and 9% of total shareholders’ equity and liabilities, the burden of the current financial debt has presented many oscillations, as already discussed above. In this manner, it is noteworthy that between 2009 and 2012 financial debts had a greater weight than commercial debts and particular attention is drawn to the high amounts owed to credit institutions during 2011 and 2012, accounting for 27.07% and 31.88% of total equity and liabilities respectively, that became 3.80% in 2013, reversing the trend of previous years. Finally, the most prominent element in 2014 was trade creditors, accounting for 8.72% of total equity and liabilities, not exceeding 3% any other heading.. Laura Santaolalla Lorenzo. 30.
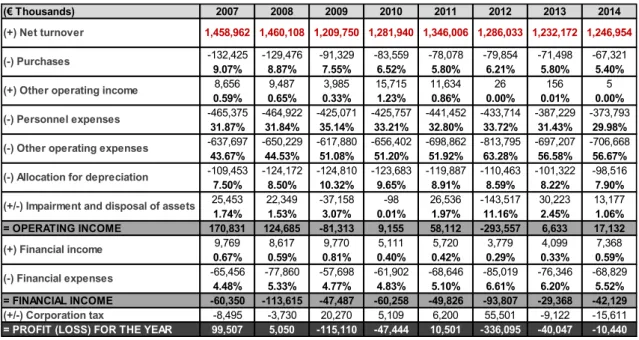
(31) NH Hotel Group and the challenges of the hotel sector in Spain. 3.2 Economic analysis Analysis also benefits from the use of a common-size income statement, and therefore Table 3.4 presents the vertical percentages of the main revenues and expenses that constitute the income statement of NH. As this table presents only the major revenues and expenses, the comprehensive profit and loss statement can be found in the Table 3 of Annex 1.The net turnover figure has been used as the base amount, and hence each item appears as a percentage of NH’s revenue for the year. Table 3.4 Vertical percentages of the main items of the income statement of NH, 2007-2014 (%) (€ Thousands). 2007. (+) Net turnover. 2008. 2009. 2010. 2011. 2012. 2013. 2014. 1,458,962 1,460,108 1,209,750 1,281,940 1,346,006 1,286,033 1,232,172 1,246,954. (-) Purchases (+) Other operating income (-) Personnel expenses (-) Other operating expenses (-) Allocation for depreciation (+/-) Impairment and disposal of assets = OPERATING INCOME (+) Financial income (-) Financial expenses = FINANCIAL INCOME (+/-) Corporation tax = PROFIT (LOSS) FOR THE YEAR. -132,425 9.07% 8,656 0.59% -465,375 31.87% -637,697 43.67% -109,453 7.50% 25,453 1.74% 170,831 9,769 0.67% -65,456 4.48% -60,350 -8,495 99,507. -129,476 8.87% 9,487 0.65% -464,922 31.84% -650,229 44.53% -124,172 8.50% 22,349 1.53% 124,685 8,617 0.59% -77,860 5.33% -113,615 -3,730 5,050. -91,329 7.55% 3,985 0.33% -425,071 35.14% -617,880 51.08% -124,810 10.32% -37,158 3.07% -81,313 9,770 0.81% -57,698 4.77% -47,487 20,270 -115,110. -83,559 6.52% 15,715 1.23% -425,757 33.21% -656,402 51.20% -123,683 9.65% -98 0.01% 9,155 5,111 0.40% -61,902 4.83% -60,258 5,109 -47,444. -78,078 5.80% 11,634 0.86% -441,452 32.80% -698,862 51.92% -119,887 8.91% 26,536 1.97% 58,112 5,720 0.42% -68,646 5.10% -49,826 6,200 10,501. -79,854 6.21% 26 0.00% -433,714 33.72% -813,795 63.28% -110,463 8.59% -143,517 11.16% -293,557 3,779 0.29% -85,019 6.61% -93,807 55,501 -336,095. -71,498 5.80% 156 0.01% -387,229 31.43% -697,207 56.58% -101,322 8.22% 30,223 2.45% 6,633 4,099 0.33% -76,346 6.20% -29,368 -9,122 -40,047. -67,321 5.40% 5 0.00% -373,793 29.98% -706,668 56.67% -98,516 7.90% 13,177 1.06% 17,132 7,368 0.59% -68,829 5.52% -42,129 -15,611 -10,440. (Source: Own elaboration with data from the CNMV and NH consolidated financial statements). 3.2.1 Net turnover Starting with the operating revenues of NH, they consist primarily of the revenue from its hotel rooms along with other sources of additional operating income such as the revenue from its restaurants and other catering services, the rental of meeting rooms and real estate sales which the company had until 2014, year in which Sotogrande S.A. was sold.. Laura Santaolalla Lorenzo. 31.
(32) NH Hotel Group and the challenges of the hotel sector in Spain. From the very beginning, the company based its sales strategy on increasing its net turnover by expanding its hotel portfolio. Thereby, through a large expansion, NH achieved from 2007 to 2011 a net turnover figure slightly higher than its competitor Meliá, as it is illustrated in Figure 3.9. Figure 3.9 Evolution of net turnover of NH and Meliá, 2007-2014 (€ thousand) 1,500,000 1,400,000. 1,458,962. 1,464,284. 1,460,108. 1,350,726. 1,346,006. 1,281,940. 1,300,000 1,279,041. 1,368,677 1,362,396 1,286,033 1,246,954. 1,250,741. 1,200,000. 1,232,172. 1,209,750 1,148,653. 1,100,000 1,000,000. 1,335,322. 2007. 2008. 2009. 2010 NH. 2011. 2012. 2013. 2014. Meliá. (Source: Own elaboration with data from the CNMV NH and Meliá consolidated financial statements). However, the effects of the economic crisis forced the company to slow down its expansion plans and even sell some of its hotels, as it was already mentioned above. Unsurprisingly, this situation led to a significant drop in sales from which the company still has not recovered and hence nowadays, despite the fact that NH still has high turnover figures around 1,200 million euros, the leading position in the Spanish hotel industry regarding net turnover is currently held by its competitor Meliá.. 3.2.2 Personnel expenses. Personnel costs are one of the largest expenses that a company that operates in the hotel industry has to face given the large volume of employees needed to maintain the proper functioning of a hotel, making these expenses be seen as fixed costs and rather inflexible. As the graph displays, personnel expenses of NH have remained stable at around 30% of its sales, showing Meliá a very similar trend, although the relative weight of personnel expenses is higher in NH than in Meliá.. Laura Santaolalla Lorenzo. 32.
(33) NH Hotel Group and the challenges of the hotel sector in Spain. Figure 3.10 Evolution of personnel expenses of NH and Meliá as a percentage of net turnover, 2007-2014 (%) 40%. 38% 35.1%. 35% 33%. 31.9% 29.9%. 30%. 33.2%. 32.4%. 33.7%. 32.8%. 34.0%. 31.4%. 30.8%. 31.7%. 31.8%. 30.0% 28.8%. 28.4%. 29.3%. 28% 25%. 2007. 2008. 2009. 2010. 2011. NH. Meliá. 2012. 2013. 2014. (Source: Own elaboration with data from the CNMV NH and Meliá consolidated financial statements). However, despite this fixed cost structure, the recessionary period forced a change in the management of human resources in order to make them more flexible and adapt the workforce of the company to the current occupancy levels. Consequently, in 2011 and 2012 NH started to announce the dismissal employees and thus personnel expenses increased significantly because of the additional costs of redundancy payments that are depicted in the table below. Additionally, the reduction in the average number of employees is also due to a strategic decision made by the group that consists on tailoring the level of employment to the level of activity, again primarily in Spain and Italy, and accordingly NH has decided to make use of a higher volume of services provided by external companies in order to adapt its workforce to the specific demand of the moment. Table 3.5 Average people employed in NH and Meliá and indemnifications (€ thousand), 2007-2014 2007. 2008. 2009. 2010. 2011. 2012. 2013. 2014. People employed. 15,158. 15,174. 13,907. 14,711. 14,689. 13,795. 13,144. 12,709. Indemnifications. 5,541. 8,758. 4,414. 5,638. 18,263. 25,266. 5,838. 9,043. (Source: Own elaboration with data from NH Hotel Group consolidated financial statements). Fortunately, thanks to these tough decisions, NH has managed to reduce the percentage of staff expenditure over net turnover in 2013 and 2014 in spite of having higher occupancy rates, spending on 2014 around 374 million euros, the lowest figure during the entire period. However, taking a closer look, it must be stated that even. Laura Santaolalla Lorenzo. 33.
(34) NH Hotel Group and the challenges of the hotel sector in Spain. though in both companies these expenditures accounted for 30% of net turnover in NH and 29.32% in Meliá during 2014, nearly identical rates, this outcome is more favourable for Meliá since net turnover in NH has increased by just 1.2% whilst in Meliá 6.9%.. 3.2.3 Other operating expenses Along with personnel expenses, this heading has the greatest weight in the total operating expenses of NH and is primarily composed of lease rentals, external services and provisions for risks and expenses. Figure 3.11 Evolution of other operating expenses of NH and Meliá as a percentage of net turnover, 2007-2014 (%) 70% 63.3%. 60% 50% 40%. 30% 20%. 51.1% 43.7%. 51.2%. 51.9%. 56.6%. 56.7%. 41.6%. 42.5%. 44.5%. 35.5%. 36.4%. 37.8%. 39.1%. 40.8%. 32.1%. 2007. 2008. 2009. 2010. 2011. NH. Meliá. 2012. 2013. 2014. (Source: Own elaboration with data from the CNMV and NH and Meliá consolidated financial statements). The graph shows in greater detail the percentages for each year, depicting a rising trend in both chains, with an average spending in the eight years of study of 52.37% for NH, compared with 38.22% in Meliá. This large difference is due to the fact that Meliá spending on rentals is much lower and the company does not outsource as many services as NH does. Breaking down this expense in NH, the biggest expenditure is external services, which most likely includes payments to the staff and services provided by external companies, as it has been explained in the preceding section, and expenditures such as transport, maintenance and repairs, or advertising, but in which only appears broken down the fees for auditing and other services provided by the auditor of the group’s. Laura Santaolalla Lorenzo. 34.
(35) NH Hotel Group and the challenges of the hotel sector in Spain. consolidated annual accounts, Deloitte. Lease rentals are next with also a significant weight, therefore making it interesting to briefly analyse the evolution of this spending.. 3.2.4 Leases It is common practice in the hotel sector to rent the establishments to carry out the activity. In particular, NH makes extensive use of leasing, which translates in a high percentage of sales, with an average for the eight-year period of 20.91% as compared to 7.09% of Meliá. Thus, as an illustrative example, during 2014 NH had 54% of its hotels on a rental basis, compared with 32% who came to register its competitor. Figure 3.12 Evolution of lease rental of NH and Meliá as a percentage of net turnover, 2007-2014 (%) 25%. 22.5%. 20% 15%. 16.6%. 23.2%. 21.0%. 21.6%. 6.9%. 7.3%. 7.4%. 7.6%. 2009. 2010. 2011. 2012. NH. Meliá. 22.3%. 21.8%. 18.2%. 10% 5% 5.1%. 0%. 2007. 6.0%. 2008. 7.7%. 2013. 8.6%. 2014. (Source: Own elaboration with data from the CNMV and NH and Meliá consolidated financial statements). However, since 2013, but especially in 2014, NH has managed to reduce rental costs back to the levels of 2009, hovering around 270 million euros, by renegotiating contracts, primarily in Spain and Italy, by abandoning those contracts that had negative contribution, and by offsetting the increases resulting from the negotiations of previous years as well as consumer price index revisions. Therefore, as a result of these measures, NH was able to reduce in 2014 its total lease expenses by 2.1%, resulting in annual savings of 10.7 million euros.. Laura Santaolalla Lorenzo. 35.
Figure
+7

Documento similar
