FACTBOOK
2007 - 2008
Office of Institutional Planning, Assessment, Research and Testing Page i
Table of Contents
Page Number
Introduction 1
Students – Admissions Overall Admissions Profile
Relative Importance of Academic and Non-Academic Factors in Admissions Decisions 3 First-time, First-year (Freshman) Students by Gender (2005 – 2007) 4
Student Selectivity Annual Trends (Year 02/03 - Year 06/07) 5
Student Yield Annual Trends (Year 02/03 - Year 06/07) 5
SAT Scores
First-Time, First-Year (Freshman) Degree-Seeking Students Enrolled in Fall 2007 Who Submitted SAT Scores
6
25
th, 75
thPercentile for SAT Scores (2005 – 2006) 6
Percent of First-Time, First-Year (Freshman) Students Enrolled in Fall 2007 with Scores in Each Range
6
Average Test Scores for all First-Time, First-Year (Freshman) Students Enrolled in Fall (2005-2007)
6
All New Undergraduate Students Attributes
All New Undergraduate Students Fall 07 by Admit Type 7
All New Undergraduate Students Fall 07 by Gender and Certificates 7 All New Undergraduate Students Fall 07 by Gender and Nationality 9 All New Graduate Students Attributes
All New Undergraduate Students Fall 07 by Gender and Nationality 11 Students – Enrollment
Fall 2007 Overall Enrollment Profile
Enrollment by Full-Time/Part-Time, Gender and Career (2007) 13
Student Credit Hours (2007) 13
Overall Enrollment Trends (2003-2007)
All Students in Fall Semesters (2003 – 2007) 14
Degree Seeking Students Attributes Trends (1993 - 2007) 14
Student Enrollment by Citizenship Trends (2003 – 2007) 15
Student Retention Rates Trends (2001 – 2006) 15
Undergraduate Students Enrollment Trends (2003-2007)
Undergraduate Students Enrollment Trends by School (2003 – 2007) 16 School of Business, Economics and Communication Undergraduate Enrollment Trends
(2003-2007)
16
School of Sciences and Engineering Enrollment Trends (2003-2007) 17 School of Humanities and Social Sciences Enrollment Trends (2003-2007) 18 Graduate Students Enrollment Trends
Graduate Student Enrollment Trends by School (2003-2007) 19
School of Business, Economics and Communications Graduate Enrollment Trends (2003-2007)
19
School of Science and Engineering Graduate Enrollment Trends (2003-2007) 20 School of Humanities and Social Sciences Graduate Enrollment Trends (2003-2007) 20
Students - Graduation
Office of Institutional Planning, Assessment, Research and Testing Page ii
Annual Graduation Patterns
Annual Graduation Patterns Trends (1989-2007) 21
Student Completion Rates Trends (1995 – 2001) 22
Graduate Attributes Trends
Graduation Patterns by Citizenship 23
Graduation Patterns by Gender 25
Financial Aid/Scholarship
Undergraduate Students on Achievement Scholarship and Financial Aid (2002– 2006) 26 Graduate Students on Achievement Scholarship and Financial Aid (2002 – 2006) 26
Students on Other Scholarship Programs (2006) 27
Total Students on Financial Aid/Scholarship (2006) 27
Alumni
Alumni Participation (Year 02/03 - Year 05/06) 28
Alumni Association Listings (Year 02/03 - Year 06/07) 28
Faculty
Full-Time Faculty
Full-Time Faculty by Citizenship (Fall 2007) 29
Full-Time Faculty by Terminal Degree (Fall 2007) 29
Full-Time Faculty by Rank (Fall 2007) 29
Full-Time Faculty by Tenure Status (Fall 2007) 29
Full-Time Faculty Profile by School and Department (Fall 2007) 30 Part-Time Faculty
Part-Time Faculty Profile by School and Department (Fall 2007) 31 Teaching Faculty FTE
Full-Time and Part-Time Teaching Faculty by Headcount and FTE (Fall 2007) 32
Financial
AUC Operating Budget (2001 – 2007) 33
Office of Institutional Planning, Assessment, Research and Testing Page 1
Introduction
Mission
The Office of Institutional Planning, Assessment, Research and Testing (IPART) partners with university officials to support effective decision making that advances AUC’s mission. IPART provides timely, accurate and relevant information and analysis to external and internal constituencies.”
IPART is committed to:
A process of transparency, a culture of evidence and open communication in which information is made widely available to the campus community;
Supporting strategic planning and decision making through the analysis, presentation, and distribution of relevant and timely information;
Assisting all AUC units in their assessment efforts;
Proactively generating institutional analyses that enhance the academic planning process;
Facilitating the flow of information between the central administration and campus units;
Serving the university as a repository of information and maintaining databases of AUC’s institutional data;
Responding to internal and external requests for information about the institutional characteristics of AUC;
Providing diagnostic tests for current and prospective students.
Office of Institutional Planning, Assessment, Research and Testing Page 2
Office of Institutional Planning, Assessment, Research and Testing (IPART) Team Members:
Ahmed Abouelkheir Mohamed Nagib Abou Zeid
Manager of Institutional Testing Professor and IPART Distinguished
tel: 2797-5083 Consulting Administrator
e-mail: [email protected] tel: 2797-5981
e-mail: [email protected]
Ann Boudinot-Amin
Director of Assessment Ola Abdel Hamid Anwar
tel: 2797-5982 Survey Administrative Officer and
e-mail: [email protected] Assistant to the Executive Director
tel: 2797-5984
Gina Cinali e-mail: [email protected]
IPART Executive Director
tel: 2797-5941 Rasha Sadek Radwan
e-mail: [email protected] Manager of Institutional Research
tel: 2797-5986
Heba Ahmed Amer e-mail: [email protected]
Planning and Research Officer
tel: 2797-5952 Sherif Dimitri
e-mail: [email protected] Senior Testing and Evaluation
Services Specialist
Kelsey Norman tel: 2797-5367
Intern e-mail: [email protected]
tel: 2797-5983
e-mail: [email protected]
Office of Institutional Planning, Assessment, Research and Testing Page 3
Students – Admissions
OVERALL ADMISSIONS PROFILE
Table A.1: Relative Importance of Academic and Non-Academic Factors in Admissions Decisions
Very Important Important Considered Not Considered
Academic
Rigor of secondary school record √
Class rank √
Academic GPA √
Recommendation(s) √
Standardized test scores √
Application essay √
Nonacademic
Interview √
Extracurricular activities √
Talent/ability √
Character/personal qualities √
First generation √
Alumni/ relation √
Geographical residence √
State residency √
Religious affiliation/commitment √
Racial/ethnic status √
Volunteer work √
Work experience √
Level of applicant's interest √
Office of Institutional Planning, Assessment, Research and Testing Page 4 Table A.2: First-time, First-year (freshman) Students by Gender
Fall 2005 Fall 2006 Fall 2007 Total first-time, first-year (freshman) males applied 1,037 1,034 1,188
Total first-time, first-year (freshman) females applied 936 978 1,135
Total first-time, first-year (freshman) applications 1,973 2,012 2,323
Total first-time, first-year (freshman) males admitted 572 581 636
Total first-time, first-year (freshman) females admitted 614 649 749
Total first-time, first-year (freshman) males and females admitted 1,186 1,230 1,385 Total full-time, first-time, first-year (freshman) males enrolled 311 334 350 Total part-time, first-time, first-year (freshman) males enrolled 97 92 122 Total full-time, first-time, first-year (freshman) females enrolled 374 387 435 Total part-time, first-time, first-year (freshman) females enrolled 94 88 139 Total first-time, first-year enrolled, males and females, full- and part- time 876 901 1046
Office of Institutional Planning, Assessment, Research and Testing Page 5 Table A.3: Student Selectivity Annual Trends (Year 02/03 - Year 06/07)
The annual selectivity rate is the percentage of undergraduate applicants who were not accepted
Year 02/ 03 03/ 04 04/ 05 05/ 06 06/ 07
Selectivity 37.00% 39.90% 38.80% 37.60% 37.70%
Table A.4: Student Yield Annual Trends (Year 02/03 - Year 06/07)
The annual yield rate is the percentage of accepted undergraduates who registered
Year 02/ 03 03/ 04 04/ 05 05/ 06 06/ 07
Percent 75.60% 68.60% 76.70% 71.03% 76.90%
Office of Institutional Planning, Assessment, Research and Testing Page 6
SAT SCORES
Table A.5: Number and Percent of First-Time, First-Year (Freshman) Degree-Seeking Students Enrolled in Fall 2007 and Submitted SAT Scores
Number Percent
437 42%
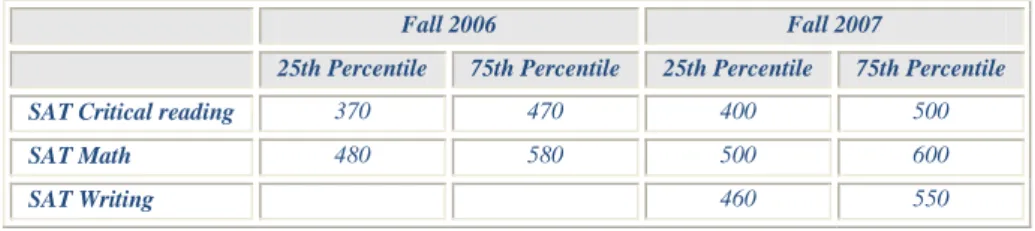
Table A.6: 25th, 75th Percentile for SAT Scores (2006 – 2007)
Fall 2006 Fall 2007
25th Percentile 75th Percentile 25th Percentile 75th Percentile
SAT Critical reading 370 470 400 500
SAT Math 480 580 500 600
SAT Writing 460 550
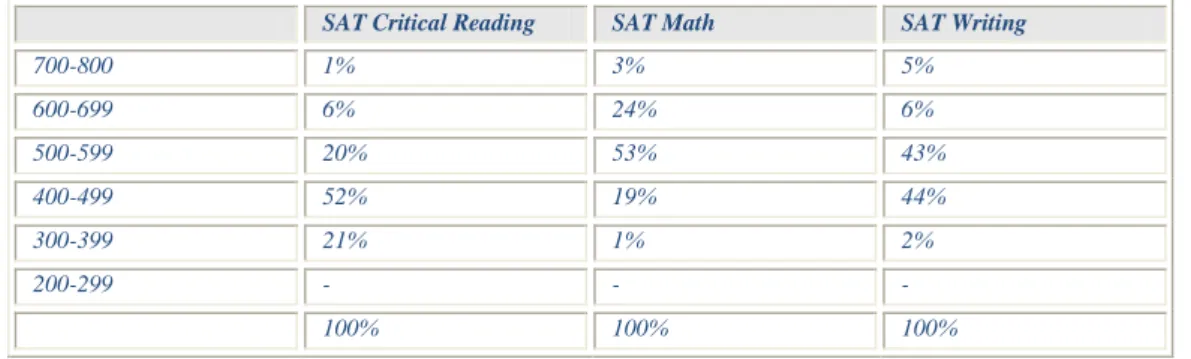
Table A.7: Percent of First-Time, First-Year (Freshman) Students Enrolled in Fall 2007 with Scores in Each Range
SAT Critical Reading SAT Math SAT Writing
700-800 1% 3% 5%
600-699 6% 24% 6%
500-599 20% 53% 43%
400-499 52% 19% 44%
300-399 21% 1% 2%
200-299 - - -
100% 100% 100%
Table A.8 Average Test Scores for All First-Time, First-Year (Freshman) Students Enrolling in Fall 2007
Average Test Scores SAT Critical Reading SAT Math SAT Writing
2007 enrolled freshmen 460 553 524
Office of Institutional Planning, Assessment, Research and Testing Page 7
ALL NEW UNDERGRADUATE STUDENTS
Table A.9: All New Undergraduate Students Fall 07 by Admit Type
Regular Transfer Readmits Total
1046 21 13 1080
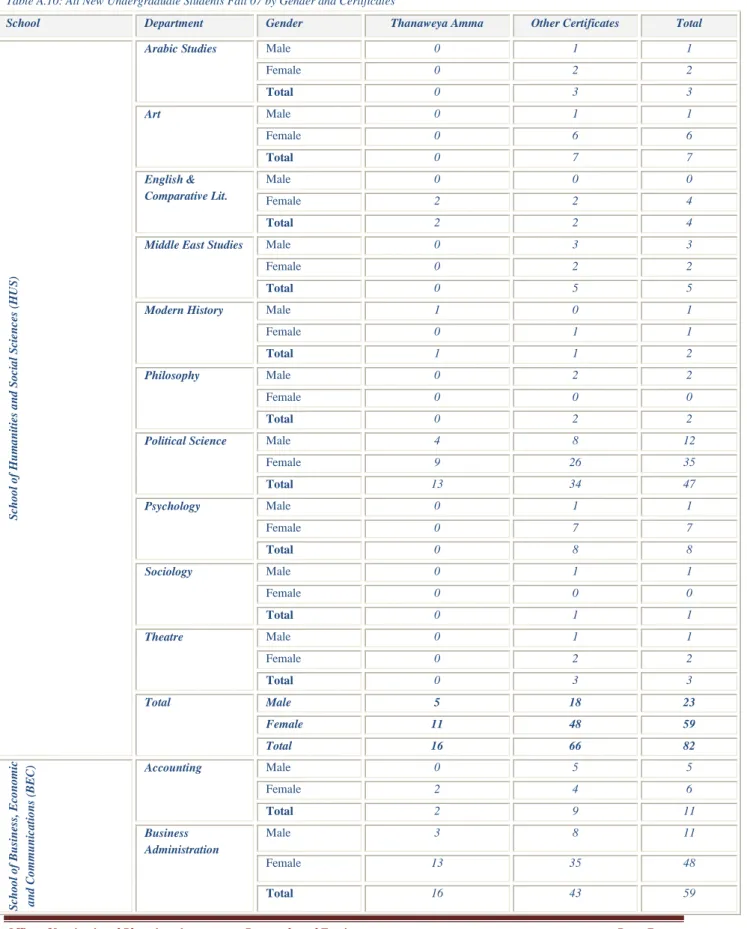
Table A.10: All New Undergraduate Students Fall 07 by Gender and Certificates
School Department Gender Thanaweya Amma Other Certificates Total
School of Humanities and Social Sciences (HUS)
Arabic Studies Male 0 1 1
Female 0 2 2
Total 0 3 3
Art Male 0 1 1
Female 0 6 6
Total 0 7 7
English &
Comparative Lit.
Male 0 0 0
Female 2 2 4
Total 2 2 4
Middle East Studies Male 0 3 3
Female 0 2 2
Total 0 5 5
Modern History Male 1 0 1
Female 0 1 1
Total 1 1 2
Philosophy Male 0 2 2
Female 0 0 0
Total 0 2 2
Political Science Male 4 8 12
Female 9 26 35
Total 13 34 47
Psychology Male 0 1 1
Female 0 7 7
Total 0 8 8
Sociology Male 0 1 1
Female 0 0 0
Total 0 1 1
Theatre Male 0 1 1
Female 0 2 2
Total 0 3 3
Total Male 5 18 23
Female 11 48 59
Total 16 66 82
School of Business, Economic and Communications (BEC) Accounting Male 0 5 5
Female 2 4 6
Total 2 9 11
Business Administration
Male 3 8 11
Female 13 35 48
Total 16 43 59
Office of Institutional Planning, Assessment, Research and Testing Page 8
Economics Male 0 4 4
Female 4 13 17
Total 4 17 21
Journalism & Mass Com.
Male 1 2 3
Female 16 45 61
Total 17 47 64
Total Male 4 19 23
Female 35 97 132
Total 39 116 155
Actuarial Sciences Male 1 0 1
Female 0 2 2
Total 1 2 3
School of Sciences and Engineering (SCE)
Architectural Engineering
Male 2 5 7
Female 0 16 16
Total 2 21 23
Biology Male 0 5 5
Female 3 3 6
Total 3 8 11
Chemistry Male 0 1 1
Female 0 1 1
Total 0 2 2
Computer Engineering
Male 4 3 7
Female 3 6 9
Total 7 9 16
Computer Science Male 8 4 12
Female 10 2 12
Total 18 6 24
Construction Engineering
Male 8 19 27
Female 1 4 5
Total 9 23 32
Electronics Engineering
Male 12 7 19
Female 3 5 8
Total 15 12 27
Engineering (Undeclared Specialty)
Male 9 7 16
Female 1 2 3
Total 10 9 19
Math Male 0 0 0
Female 0 1 1
Total 0 1 1
Mechanical Engineering
Male 9 28 37
Female 3 3 6
Total 12 31 43
Petroleum Engineering
Male 2 1 3
Female 0 0 0
Total 2 1 3
Total Male 55 80 135
Female 24 45 69
Total 79 125 204
Office of Institutional Planning, Assessment, Research and Testing Page 9
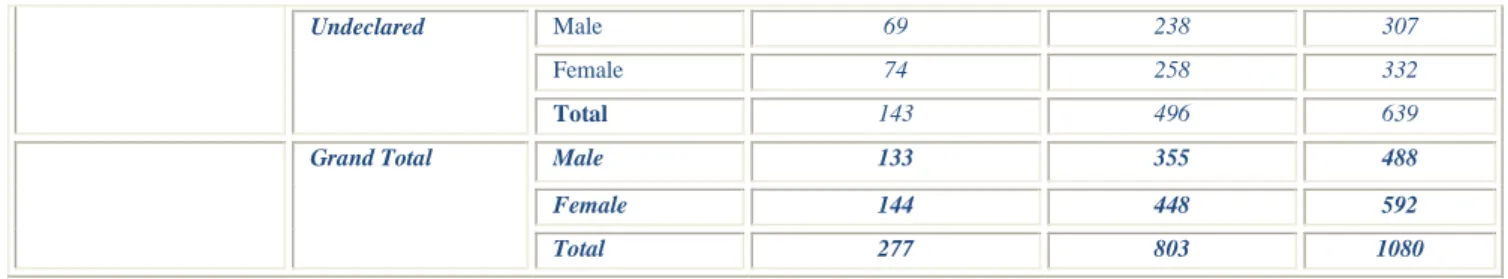
Undeclared Male 69 238 307
Female 74 258 332
Total 143 496 639
Grand Total Male 133 355 488
Female 144 448 592
Total 277 803 1080
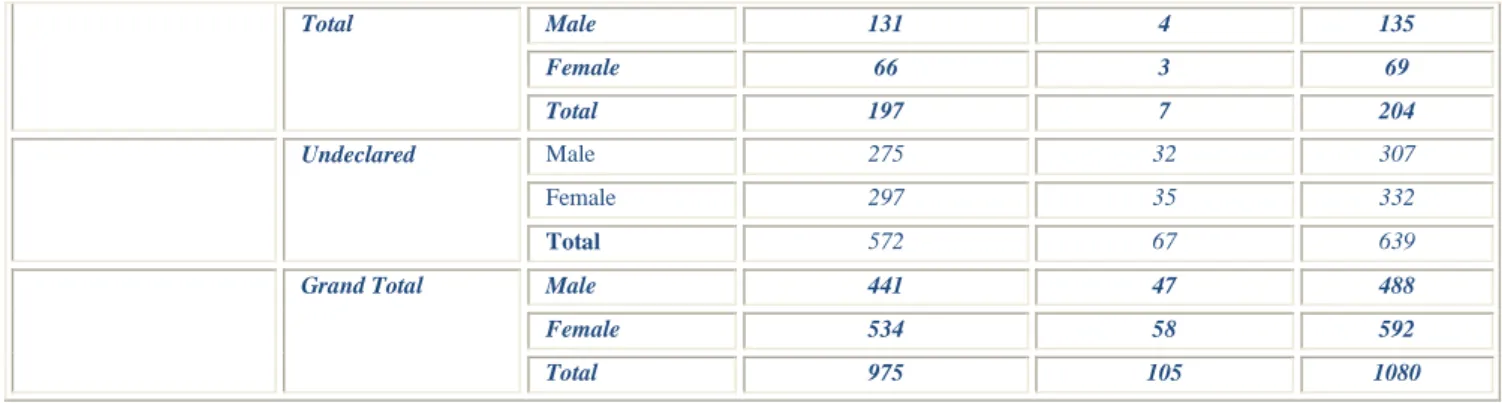
Table A.11: All New Undergraduate Students Fall 07 by Gender and Nationality
School Department Gender Egyptian Non-Egyptian Total
School of Humanities and Social Sciences (HUS)
Arabic Studies Male 0 1 1
Female 0 2 2
Total 0 3 3
Art Male 0 1 1
Female 5 1 6
Total 5 2 7
English &
Comparative Lit.
Male 0 0 0
Female 3 1 4
Total 3 1 4
Middle East Studies Male 0 3 3
Female 0 2 2
Total 0 5 5
Modern History Male 1 0 1
Female 1 0 1
Total 2 0 2
Philosophy Male 2 0 2
Female 0 0 0
Total 2 0 2
Political Science Male 9 3 12
Female 30 5 35
Total 39 8 47
Psychology Male 0 1 1
Female 6 1 7
Total 6 2 8
Sociology Male 1 0 1
Female 0 0 0
Total 1 0 1
Theatre Male 1 0 1
Female 2 0 2
Total 3 0 3
Total Male 14 9 23
Female 47 12 59
Total 61 21 82
School of Business, Economics and Communications (BEC) Accounting Male 5 0 5
Female 6 0 6
Total 11 0 11
Office of Institutional Planning, Assessment, Research and Testing Page 10 Business
Administration
Male 10 1 11
Female 46 2 48
Total 56 3 59
Economics Male 3 1 4
Female 17 0 17
Total 20 1 21
Journalism & Mass Com.
Male 3 0 3
Female 55 6 61
Total 58 6 64
Total Male 21 2 23
Female 124 8 132
Total 145 10 155
School of Sciences and Engineering (SCE)
Actuarial Sciences Male 1 0 1
Female 2 0 2
Total 3 0 3
Architectural Engineering
Male 6 1 7
Female 16 0 16
Total 22 1 23
Biology Male 4 1 5
Female 3 3 6
Total 7 4 11
Chemistry Male 1 0 1
Female 1 0 1
Total 2 0 2
Computer Engineering
Male 7 0 7
Female 9 0 9
Total 16 0 16
Computer Science Male 12 0 12
Female 12 0 12
Total 24 0 24
Construction Engineering
Male 25 2 27
Female 5 0 5
Total 30 2 32
Electronics Engineering
Male 19 0 19
Female 8 0 8
Total 27 0 27
Engineering (Undeclared Specialty)
Male 16 0 16
Female 3 0 3
Total 19 0 19
Math Male 0 0 0
Female 1 0 1
Total 1 0 1
Mechanical Engineering
Male 37 0 37
Female 6 0 6
Total 43 0 43
Petroleum Engineering
Male 3 0 3
Female 0 0 0
Total 3 0 3
Office of Institutional Planning, Assessment, Research and Testing Page 11
Total Male 131 4 135
Female 66 3 69
Total 197 7 204
Undeclared Male 275 32 307
Female 297 35 332
Total 572 67 639
Grand Total Male 441 47 488
Female 534 58 592
Total 975 105 1080
ALL NEW GRADUATE STUDENTS
Table A.12: All New Graduate Students Fall 07 by Gender and Nationality
School Program Gender Egyptian Non-Egyptian Total
School of Humanities and Social Sciences (HUS)
Arabic Studies Male 11 3 14
Female 20 13 33
Total 31 16 47
English & Comparative Lit.
Male 1 1 2
Female 12 1 13
Total 13 2 15
Gender and Women’s Studies
Male 0 0 0
Female 8 5 13
Total 8 5 13
International and Human Rights Law
Male 7 10 17
Female 17 13 30
Total 24 23 47
Law Male 27 3 30
Female 19 3 22
Total 46 6 52
Middle East Studies Male 4 22 26
Female 18 28 46
Total 22 50 72
Political Science Male 21 17 38
Female 69 18 87
Total 90 35 125
Sociology and Anthropology
Male 2 8 10
Female 14 12 26
Total 16 20 36
Teaching Arabic as a Foreign Language
Male 12 2 14
Female 29 4 33
Total 41 6 47
Teaching English as a Foreign Language
Male 7 3 10
Female 33 4 37
Total 40 7 47
Total Male 92 69 161
Female 239 101 340
Total 331 170 501
Office of Institutional Planning, Assessment, Research and Testing Page 12
School of Business, Economics and Communications (BEC)
Business Administration Male 126 4 14
Female 67 3 14
Total 193 7 200
Economics Male 12 1 13
Female 27 1 28
Total 39 2 41
Economics – International Development
Male 8 5 13
Female 32 3 35
Total 40 8 48
Mass Communication Male 11 5 16
Female 55 7 62
Total 66 12 78
Public Administration Male 4 1 4
Female 6 0 7
Total 10 1 11
Public Policy and administration
Male 5 4 9
Female 7 1 8
Total 12 5 17
Total Male 166 20 186
Female 194 15 209
Total 360 35 395
School of Sciences and Engineering (SCE)
Biotechnology Male 6 1 7
Female 12 0 12
Total 18 1 19
Construction Engineering
Male 19 1 20
Female 9 0 9
Total 28 1 29
Computer Science Male 51 1 52
Female 27 0 27
Total 78 1 79
Engineering Male 14 3 17
Female 4 0 4
Total 18 3 21
Environmental Engineering
Male 3 0 3
Female 5 0 5
Total 8 0 8
Mechanical Engineering Male 19 0 19
Female 4 0 4
Total 23 0 23
Physics Male 13 1 14
Female 4 0 4
Total 17 1 18
Total Male 125 7 132
Female 65 0 65
Total 190 7 197
Grand Total Male 383 96 479
Female 498 116 614
Total 881 212 1093
Office of Institutional Planning, Assessment, Research and Testing Page 13
Students – Enrollment
FALL 2007 OVERALL ENROLLMENT PROFILE
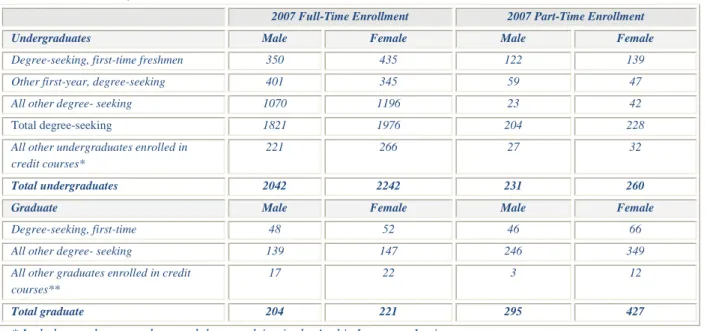
Table E.1: Enrollment by Full-Time/Part Time, Gender and Career
2007 Full-Time Enrollment 2007 Part-Time Enrollment
Undergraduates Male Female Male Female
Degree-seeking, first-time freshmen 350 435 122 139
Other first-year, degree-seeking 401 345 59 47
All other degree- seeking 1070 1196 23 42
Total degree-seeking 1821 1976 204 228
All other undergraduates enrolled in credit courses*
221 266 27 32
Total undergraduates 2042 2242 231 260
Graduate Male Female Male Female
Degree-seeking, first-time 48 52 46 66
All other degree- seeking 139 147 246 349
All other graduates enrolled in credit courses**
17 22 3 12
Total graduate 204 221 295 427
* Include non-degree students and those studying in the Arabic Language Institute
** Include graduate diplomas students and those studying in the Center for Arabic Studies Abroad (CASA)
Table E.2: Student Credit Hours
Fall 2007
Undergraduate Graduate
Total credit hours of all part-time students 3000 2646
Number of credit hours for the credit load of a full-time student
12 9
Office of Institutional Planning, Assessment, Research and Testing Page 14
OVERALL ENROLLMENT TRENDS
Table E.3 All Students in Fall Semesters (2003 – 2007)
2003 2004 2005 2006 2007
Undergraduate Program Enrollment 3963 3940 3890 4023 4229
Master's Program Enrollment 867 928 1013 1049 1093
Not Seeking a Degree Enrollment 316 426 465 529 600
All Academic Student Enrollment 5146 5294 5368 5601 5922
Table E.4 Degree Seeking Student Attributes Trends (1993 – 2007)
Year
Gender Citizenship Total
Students
Male Female Egyptian Other
1993 50.00% 50.00% 80.00% 20.00% 3,982
1994 48.80% 51.20% 82.90% 17.10% 3,988
1995 48.10% 51.90% 84.70% 15.30% 4,176
1996 49.00% 51.00% 85.10% 14.90% 4,171
1997 48.60% 51.40% 86.80% 13.20% 4,279
1998 47.10% 52.90% 87.20% 12.80% 4,272
1999 46.80% 53.20% 87.80% 12.20% 4,329
2000 46.00% 54.00% 88.50% 11.50% 4,646
2001 45.00% 55.00% 89.70% 10.30% 4,731
2002 47.70% 52.30% 89.80% 10.20% 5,002
2003 46.00% 54.00% 89.30% 10.70% 4,830
2004 47.00% 53.00% 89.40% 10.60% 4,868
2005 47.30% 52.70% 90.00% 10.00% 4,903
2006 46.80% 53.20% 89.50% 10.50% 5,072
2007 47% 53% 89.1% 10.9% 5,322
Office of Institutional Planning, Assessment, Research and Testing Page 15 Table E.5 Student Enrollment by Citizenship Trends (2003 – 2007)
Year Egyptian US Other Arab Countries
All Other Countries
Total
2003 4,771 332 288 241 5,632
2004 4,398 416 257 223 5,294
2005 4,466 416 248 238 5,368
200 6
4,589 527 249 236 5,601
2007 4,794 649 231 248 5,922
Table E.6 Student Retention Rates Trends (2001 – 2006)
The retention rate is the percentage of first-time, degree seeking freshman who enrolled in the Fall and returned back the following Fall.
Fall 2001 Fall 2002 Fall 2003 Fall 2004 Fall 2005 Fall 2006
92% 91% 91% 92% 93% 93%
Office of Institutional Planning, Assessment, Research and Testing Page 16
UNDERGRADUATE STUDENTS ENROLLMENT TRENDS (2003 – 2007)
Table E.7 Undergraduate Students Enrollment Trends by School (2003 – 2007)
2003 2004 2005 2006 2007
School of Business, Economics and Communication 1,069 1,131 1,109 1,147 1,198
School of Science and Engineering 1,155 1,160 1,049 1,111 1,112
School of Humanities and Social Science 538 547 497 499 525
Undeclared (includes English Language Institute) 1,201 1,102 1,235 1,266 1,394
Undergraduate Degree Totals 3,963 3,940 3,890 4,023 4,229
E.8 School of Business, Economics and Communications Enrollment Trends (2003-2007)
Major 2003 2004 2005 2006 2007
Accounting 119 119 138 113 118
Business Administration
312 355 340 413 466
Economics 237 176 191 157 143
Journalism &
Mass
Communication
401 481 440 464 471
Total 1069 1131 1109 1147 1198
Office of Institutional Planning, Assessment, Research and Testing Page 17 E.9 School of Sciences and Engineering Enrollment Trends (2003-2007)
Major 2003 2004 2005 2006 2007
Actuarial Science NA 6 14 25 21
Architectural Engineering NA NA NA NA 37
Biology 52 51 54 61 48
Chemistry 21 31 36 23 25
Computer Engineering NA NA NA NA 25
Computer Science 293 306 239 225 179
Construction Engineering 123 154 191 226 236
Electronics Engineering 87 145 155 204 203
Engineering (Specialty undeclared) 270 133 21 2 19
Mathematics 27 12 9 10 11
Mechanical Engineering 241 289 308 317 286
Petroleum and Energy Engineering NA NA NA NA 3
Physics 41 33 22 18 19
Total 1155 1160 1049 1111 1112
Office of Institutional Planning, Assessment, Research and Testing Page 18 E.10 School of Humanities and Social Sciences Enrollment Trends (2003–2007)
Major 2003 2004 2005 2006 2007
Anthropology 17 18 12 13 13
Arabic Studies 3 3 2 1 4
Art 26 44 51 59 60
Egyptology 8 13 15 10 12
English & Comparative Literature 18 26 30 21 25
Middle Eastern History 2 0 0 0 0
Middle East Studies 9 11 8 5 13
Modern History 6 15 28 28 30
Philosophy 16 22 17 13 13
Political Science 300 262 222 245 261
Psychology 94 93 69 65 58
Sociology 20 19 21 20 18
Theatre 19 21 22 19 18
Total 538 547 497 499 525
Office of Institutional Planning, Assessment, Research and Testing Page 19
GRADUATE STUDENTS ENROLLMENT TRENDS (2003 – 2007)
Table E.11 Graduate Student Enrollment by School Trends (2003 – 2007)
Masters Degree Programs 2003 2004 2005 2006 2007
School of Business, Economics and Communication 319 351 419 428 395
School of Science and Engineering 180 159 172 174 197
School of Humanities and Social Science 368 418 422 447 501
Totals 867 928 1013 1049 1039
Table E.12 School of Business, Economics and Communication Graduate Enrollment Trends (2003–2007)
Major 2003 2004 2005 2006 2007
Business Administration 150 155 186 211 200
Public Administration 50 49 50 32 11
Public Policy and Administration NA NA NA 6 17
Economics 60 60 66 51 41
Economics/International Development NA 25 45 45 48
Mass Communication 59 62 72 83 78
Total 319 351 419 428 395
Office of Institutional Planning, Assessment, Research and Testing Page 20 Table E.13 School of Sciences and Engineering Graduate Enrollment Trends (2003–2007)
Major 2003 2004 2005 2006 2007
Biotechnology NA NA NA NA 19
Computer Science 77 66 67 81 79
Construction Engineering NA NA NA NA 29
Engineering (Specialty undeclared) 85 77 87 73 21
Environmental Engineering NA NA NA NA 8
Mechanical Engineering NA NA NA NA 23
Physics 18 16 18 20 18
Total 180 159 172 174 197
Table E.14 School of Humanities and Social Sciences Graduate Enrollment Trends (2003–2007)
Major 2003 2004 2005 2006 2007
Arabic Studies 32 36 25 34 47
English & Comparative Literature 23 19 16 14 15
Gender and Women’s Studies NA NA NA 3 13
Law (LL.M.) NA 25 44 57 52
International & Human Rights Law NA NA 8 35 47
Middle East Studies 40 43 45 60 72
Political Science 148 161 144 101 125
Sociology and Anthropology 47 49 39 38 36
Teaching Arabic as a Foreign Language 29 29 37 46 47
Teaching English as a Foreign Language 49 56 64 59 47
Total 368 418 422 447 501
Office of Institutional Planning, Assessment, Research and Testing Page 21
Students – Graduation
ANNUAL GRADUATION PATTERNS
Table G.1 Annual Graduation Patterns Trends (1989-2007)
Count Percent
Year Undergraduate Students
Graduate Students
Annual Totals
Undergraduate Students %
Graduate Students %
1989 435 100 535 81.3% 18.7%
1990 444 125 569 78.0% 22.0%
1991 383 136 519 73.8% 26.2%
1992 516 113 629 82.0% 18.0%
1993 607 95 702 86.5% 13.5%
1994 626 149 775 80.8% 19.2%
1995 541 129 670 80.7% 19.3%
1996 655 137 792 82.7% 17.3%
1997 698 159 857 81.4% 18.6%
1998 713 174 887 80.4% 19.6%
1999 692 149 841 82.3% 17.7%
2000 759 153 912 83.2% 16.8%
2001 635 161 796 79.8% 20.2%
2002 688 196 884 77.8% 22.2%
2003 762 157 919 82.9% 17.1%
2004 876 186 1062 82.5% 17.5%
2005 889 209 1098 81.0% 19.0%
2006 769 249 1018 75.5% 24.5%
2007 833 249 1082 77.0% 23.0%
Office of Institutional Planning, Assessment, Research and Testing Page 22 Table G.2 Student Completion Rates Trend (1995 – 2001)
The completion rate is the percentage of degree seeking freshman (not including transfers and readmits) who were enrolled for the first time in the Fall and completed requirements and graduated within 6 years period.
Fall 95 Fall 96 Fall 97 Fall 98 Fall 99 Fall 2000 Fall 2001
82% 81% 80% 82% 85% 85% 83%
Office of Institutional Planning, Assessment, Research and Testing Page 23
GRADUATES ATTRIBUTES TRENDS
Table G.3 Graduation Patterns by Citizenship
Percentage Count
Graduation Dates Egyptian Other Arab U.S. Others Egyptian Other Arab U.S. Others Total
Feb-97 82.9% 13.0% 1.2% 2.9% 286 45 4 10 345
Jun-97 85.4% 10.7% 1.7% 2.3% 304 38 6 8 356
Feb-98 87.9% 9.4% 0.8% 1.9% 328 35 3 7 373
Jun-98 87.1% 10.0% 0.9% 2.1% 296 34 3 7 340
Feb-99 90.1% 5.9% 0.9% 3.1% 319 21 3 11 354
Jun-99 88.5% 6.8% 0.9% 3.9% 299 23 3 13 338
Feb-00 84.7% 10.7% 0.6% 4.1% 309 39 2 15 365
Jun-00 86.6% 9.4% 1.8% 2.3% 341 37 7 9 394
Feb-01 86.5% 8.5% 0.9% 4.1% 275 27 3 13 318
Jun-01 87.7% 7.9% 1.3% 3.2% 278 25 4 10 317
Feb-02 90.1% 6.6% 0.3% 3.0% 272 20 1 9 302
Jun-02 89.4% 6.0% 1.0% 3.6% 345 23 4 14 386
Feb-03 90.7% 4.2% 1.0% 4.2% 372 17 4 17 410
Jun-03 85.8% 7.1% 2.8% 4.3% 302 25 10 15 352
Feb-04 91.3% 6.3% 0.5% 2.0% 408 28 2 9 447
Jun-04 92.1% 5.1% 1.4% 1.4% 395 22 6 6 429
Feb-05 91.9% 5.8% 1.5% 0.9% 429 27 7 4 467
Jun-05 91.9% 5.0% 1.0% 2.1% 388 21 4 9 422
Feb-06 93.60% 3.32% 1.18% 1.9% 395 14 5 8 422
Jun-06 90.78% 5.48% 1.73% 2.0% 315 19 6 7 347
Feb-07 90.2% 5.6% 1.3% 2.9% 404 25 6 13 448
Jun-07 90.9% 6.5% 0.8% 1.8% 350 25 3 7 385
Office of Institutional Planning, Assessment, Research and Testing Page 24
Office of Institutional Planning, Assessment, Research and Testing Page 25 Table G.4 Graduation Patterns by Gender
Percent Count
Graduation Dates Male% Female% Male Female Total
Feb-97 48.4% 51.6% 167 178 345
Jun-97 45.2% 54.8% 161 195 356
Feb-98 49.9% 50.1% 186 187 373
Jun-98 45.3% 54.7% 154 186 340
Feb-99 42.7% 57.3% 151 203 354
Jun-99 47.6% 52.4% 161 177 338
Feb-00 48.5% 51.5% 177 188 365
Jun-00 43.7% 56.4% 172 222 394
Feb-01 55.0% 45.0% 175 143 318
Jun-01 43.5% 56.5% 138 179 317
Feb-02 41.4% 58.6% 125 177 302
Jun-02 39.4% 60.6% 152 234 386
Feb-03 44.2% 55.9% 181 229 410
Jun-03 43.0% 57.0% 152 200 352
Feb-04 42.1% 57.9% 188 259 447
Jun-04 38.5% 61.5% 165 264 429
Feb-05 45.0% 55.0% 210 257 467
Jun-05 42.2% 57.8% 178 244 422
Feb-06 46.4% 63.0% 196 226 422
Jun-06 48.1% 51.9% 167 180 347
Feb-07 42.9% 57.1% 192 256 448
Jun-07 43.9% 56.1% 169 216 385
Office of Institutional Planning, Assessment, Research and Testing Page 26
Financial Aid/Scholarship
Table S.1 Undergraduate Students on Achievement Scholarship and Financial Aid (2002-2006)
Description Academic Year (Fall Term)
2002 2003 2004 2005 2006
Total enrollment 4207 3974 3949 3902 4036
Total students on achievement scholarship 2558 2260 1462 1254 1206
% of total enrollment 60.80% 56.90% 37.00% 32.10% 29.90%
Total students on financial aid 2394 2243 2149 2019 1970
% of total enrollment 56.90% 56.40% 54.40% 51.70% 48.80%
Total students receiving achievement scholarship and Financial Aid 1535 1345 1070 760 661
% of total enrollment 36.50% 33.80% 27.10% 19.50% 16.40%
Total students not receiving achievement scholarship or financial aid 790 816 1408 1389 1521
% of total enrollment 18.80% 20.50% 35.70% 35.60% 37.70%
Table S.2 Graduate Students on Achievement Scholarship and Financial Aid (2002 – 2006)
Description Academic Year (Fall Term)
2002 2003 2004 2005 2006
Total enrollment 833 897 967 1003 1087
Total students on achievement scholarship 729 767 799 839 853
% of total enrollment 87.50% 85.50% 82.60% 83.65% 78.50%
Total students on financial aid 121 146 201 203 240
% of total enrollment 14.50% 16.30% 20.80% 20.24% 22.10%
Total students receiving achievement scholarship & Financial Aid 114 136 195 188 218
% of total enrollment 13.70% 15.16% 20.20% 18.70% 20.10%
Total students not receiving achievement scholarship or financial aid 97 120 162 149 212
% of total enrollment 11.60% 13.36% 16.80% 14.90% 19.50%
Office of Institutional Planning, Assessment, Research and Testing Page 27 Table S.3 Statistics of Students on Other Scholarship Programs (2006)
Description Academic
Year (Fall Term) 2006
Total enrollment 5123
Total students on Lead Program 51
% of total enrollment 1.00%
Total students on Staff/Faculty Scholarship 362
% of total enrollment 7.07%
Total students on PSSF Scholarship 74
% of total enrollment 1.44%
Total students on Sports Scholarship 58
% of total enrollment 1.13%
Total students on Presidential Scholarship 28
% of total enrollment 0.55%
Total students on Cultural Scholarship 9
% of total enrollment 0.18%
Total students on Named Scholarship 22
% of total enrollment 0.43%
Total students on Named Scholarship 604
% of total enrollment 11.79%
Table S.4 Statistics of Total Students on Financial Aid/Scholarship (2006)
Description Academic
Year (Fall Term) 2006
Total enrollment 5123
Total students on Financial Aid 2210
% of total enrollment 43.14%
Total students on Achievement Scholarship 2059
% of total enrollment 40.19%
Total Students on Other Scholarships 604
% of total enrollment 11.79%
Office of Institutional Planning, Assessment, Research and Testing Page 28
Alumni
Table L.1Alumni Participation (Year 02/03 - Year 06/07)
Description Academic Year
2002 2003 2004 2005 2006
Total Participation $3,391,320 $2,349,927 $2,075,893 $1,022,061 $2,177,035
Donor Count 888 779 1146 1198 1574
Table L.2Alumni Association Listings (Year 02/03 - Year 07/08)
Description Academic Year (Fall Term)
2002 2003 2004 2005 2006 2007
Alumni Number 19,124 19,645 21,103 23,276 24,704 25,667
Office of Institutional Planning, Assessment, Research and Testing Page 29
Faculty
FULL-TIME FACULTY (Fall 2007
Table F.1 Full-Time Faculty by Citizenship (Fall 2007)
Nationality 2007
Egyptian 246
US 126
Other Nationalities 41
Total 413
Table F.2 Full-Time Faculty by Terminal Degree (Fall 2007)
Terminal Degree 2007
PhD 274
Master 137
Bachelor 2
Total 413
Table F.3 Full-Time Faculty by Rank (Fall 2007)
Table F.4 Full-Time Faculty by Tenure Status (Fall 2007)
Tenure Status 2007
Tenured 101
Non-tenured 289
Permanent 23
Total 413
Fall 2007 student to faculty ratio is 12.3 to 1.
Rank 2007
Full Professor 88
Associate Professor 62
Assistant Professor 89
Instructor 134
Administrators with Faculty Position 8
Others with Faculty Position 32
Total 413
A UC F a c ult y by N a t io na lit y
Eg yp t ian 59 % Ot her
Nat io nalit ies 10 %
US 3 1%
A UC F a c ult y by T e rm ina l D e gre e
PhD 6 7%
M as t er 3 3 %
Bachelo r 0 %
A UC F a c ult y by T e nure S t a t us
No n-t enured 70 %
Permanent 6 % Tenured
2 4 %
A UC F a c ult y by R a nk
Ins tructo r 3 2 %
As s is tant Pro fes s o r
2 2 %
As s o ciate Pro fes s o r
15%
Full Pro fes s o r
2 1%
Others with Faculty Po s itio n 8 % Ad minis tarto rs
with Faculty Po s itio n
2 %