THE IMPACT OF SCALE EFFECTS ON THE PREVAILING INTERNET-BASED BANKING MODEL IN THE US
ALEXANDRE MOMPARLERA FRANCISCO J. CLIMENTB
JOSÉ M. BALLESTERB
FUNDACIÓN DE LAS CAJAS DE AHORROS DOCUMENTO DE TRABAJO
Nº 630/2011
De conformidad con la base quinta de la convocatoria del Programa de Estímulo a la Investigación, este trabajo ha sido sometido a eva- luación externa anónima de especialistas cualificados a fin de con- trastar su nivel técnico.
ISSN: 1988-8767
La serie DOCUMENTOS DE TRABAJO incluye avances y resultados de investigaciones dentro de los pro- gramas de la Fundación de las Cajas de Ahorros.
Las opiniones son responsabilidad de los autores.
1
The impact of scale effects on the prevailing internet-based
banking model in the US
Alexandre Momparlera Francisco J. Climentb
José M. Ballesterb
Abstract
Internet-based banks use a technology-intensive production process that may benefit from scale effects as they grow larger. This paper analyzes whether the predominant Internet-primary bank in the USA generates technology-based economies of scale.
There is evidence of both favorable and adverse technology-based scale effects. As the leading Internet-primary bank gets larger, the financial performance gap with traditional banks shrinks while some of its critical competitive advantages wear down.
The results suggest that unless the prevailing Internet-primary bank preserves the distinctive advantages of the Internet-based business model as it improves financial performance, it might end up converging with its branching competitors.
Key words: Banking, financial services, Internet, Panel data.
JEL classification: G21, G24, C23.
Corresponding author: Francisco J. Climent, Dept. Financial Economics, Faculty of Economics, University of Valencia, Valencia (46022), Spain. E-mail: [email protected]
a Dept. of Corporate Finance, University of Valencia.
b Dept. of Financial Economics, University of Valencia.
Acknowledgments
Financial support from the Ministry of Science and Technology of Spain (research project ECO2009- 14457-C04-04) is gratefully acknowledged.
2
1. Introduction
The barriers to nationwide branch banking, have made the impact of Internet banking more pronounced in the USA than in Japan and the European Union, where branching is generally allowed. As Internet has lowered the geographic barriers that hinder free competition of banks, rivalry within the banking industry has become more intense in the USA. The ability to boost profitability is no longer ensured by the small number of nearby competitors (Moore, 1998).
Branching banks have implemented full-service Internet banking, largely, as a long- term defensive survival strategy (Pyun, 2002). In the beginning, many bankers did not find their website operations reducing their cost of serving their customers.
Rackley (2000) claims that as much as 30 percent of Internet banks report that their website and related Internet operations are unprofitable. The most important driving force in support of full-service Internet banking has been the need to create powerful barriers to customer defection (Schechunoff, 2000). The strategy was to tie the bank’s customers to its own website; as stated by Pyun (2002), once a customer becomes used to a bank’s website, the likelihood that the customer will take the time and effort to move to another financial institution significantly decreases.
All in all, Internet has already become an important distribution channel to the US banking industry. For the most part, US financial institutions follow a multi-channel distribution model, in which Internet complements the traditional channels (mainly branches and ATMs). Only a small number of banks deliver banking services primarily over the Internet. Although most Internet-primary banks operating in the US are already profitable, they still have a long way to overcome the financial performance gap that keeps their profitability—in terms of both ROA and ROE—far below the branching banks’.
In his study for the period 1997-1999, De Young (2001) compares financial
performance of both Internet-primary and branching banks in the USA. He concludes
that the average Internet-primary bank is significantly less profitable than the average
branching bank. The results of the study also bring to light two fallacies about the
Internet-primary business model: overall overhead expenses are not necessarily
3
lower, and overall deposit interest rates are not necessarily higher, compared with branching banks. In addition, the results of the paper indicate that Internet-primary banks tend to grow faster than traditional branching banks. Even though these results cast doubt on the future viability of a high-growth low-profitability business model, De Young points out that the data sets analyzed are not sufficient by themselves to support such strong conclusions. The author suggests that the new business model is very young and the financial performance of Internet-primary banks may improve as they mature.
A more recent paper by De Young (2005) investigates—through empirical tests—the existence of technology-based experience effects and technology-based scale effects that may benefit more those banks that make a more intensive use of technology—Internet primary banks—than branching banks. The econometric analysis performed for the period 1997-2000, finds strong evidence of technology- based scale effects but not of technology-based experience effects. Furthermore, the results of the study suggest that Internet-primary banking success depends on attaining sufficient scale and strong management practices.
From a different standpoint, a report by Furst et al. (2002) presents the Internet banking background in the USA banking system. The authors also investigate whether offering Internet banking affects banks’ profitability, evaluating financial performance of Internet banks versus non-Internet banks. In addition, they establish the key factors explaining profitability in the third quarter of 1999. This report also examines banks’ plans for offering Internet banking and the impact of Internet banking on the banking industry’s structure.
Other recent papers in the fields of banking and management that have inspired and motivated our research are grouped in accordance with their focus: efficiency and productivity (Chen, 2009; Figueira and Nellis, 2009; and Sufian, 2009); client satisfaction and service quality, customer equity and brand equity (Liu and Wu, 2009;
Nadiri
et al., 2009; Proença and de Castro, 2007; Roofthooft, 2010; Wang et al.,2009); small business banking (Locke and Boulanaour, 2009); economies of scale
and internal firm organization (Peris-Ortiz and Rueda-Armengot, 2010); and
perceived risk and trust for Internet banking (Yousafzai et al., 2009).
4
In this study the financial performance of the leading US Internet-primary bank is compared with a branching bank benchmark. In addition, the existence of technology-based scale effects is investigated through panel data analysis as these effects may enhance more the performance of the foremost Internet-primary bank than that of the branching bank benchmark. Panel data analysis is a method of studying a particular subject within multiple sites, periodically observed over a defined time frame. As Internet-primary banking is a young business model that emerged in the USA in 1995, the use of data for 2002-2008 is likely to be more significant than any previous research performed over earlier and shorter time frames. Another important premise is the clear distinction between Internet-primary banking and Internet traditional banking, which is a requirement to identify and evaluate the different business models in the banking industry. Moreover, we have noticed that the main studies on Internet-primary banking in the US have omitted the leading Internet-primary financial institution: ING Bank. In our analysis, we focus entirely on this financial institution (the largest Internet-primary bank operating in the US) because of its overwhelmingly superior asset size and peculiar business model.
We understand that within the US Internet-primary segment, ING Bank is in a class of its own.
The remainder of the study proceeds as follows. First, under the last heading of this introduction the current structure of the Internet-primary banking segment is portrayed. Then, an initial analysis of the data is provided. Next, we present the statistical model used in the empirical analysis. After that, we present the main results of the empirical analysis. And finally, we put forward the main conclusions of the study.
The Internet-primary banking segment
In the last update of May 2005, FDIC’s Internet-primary list includes fifteen
institutions. Three institutions, out of these fifteen, have been left out of our study
because banking is not their principal activity but an auxiliary activity. Four more
institutions have been excluded because of mergers or acquisitions with branching
banks, which resulted in loss of independence and abandonment of the Internet-
5
primary strategy. In this way, we are left with eight financial institutions which comprise our Internet-primary sample.
Table 1
Basic data as of December 31, 2008
Total Assets
($ thousands)
Deposits ($ thousands)
Net Income ($ thousands)
Employees Branches
ING Bank, fsb 82.416.721 71.769.528 -1.111.401 2.328 1 Lydian Private Bank 2.116.737 1.278.515 -12.440 144 1 Principal Bank 2.326.856 2.142.709 15.598 129 1 The Bancorp Bank 1.790.156 1.539.617 -41.156 305 1 Nexity Bank 1.057.240 678.368 -11.381 107 1 Bank of Internet 1.218.939 633.870 5.493 51 1 First Internet Bank 542.235 440.329 1.748 44 2
Ebank 153.000 136.669 -7.123 18 1
Source: FDIC database.
Table 1 presents basic financial data on the Internet-primary institutions. The data clearly shows the overwhelming leverage of ING Bank in the US Internet-primary banking segment. ING Bank’s total assets and deposits account for 89.95% and 91.29% respectively of aggregate figures for the Internet-primary segment considered.
2. Initial analysis of the data
The source of the data is the FDIC database. We analyze the data with the help of descriptive statistics. We also perform Levene’s test of homogeneity of variance and an ANOVA analysis with SPSS 15.0 software in order to find out whether there are statistically significant differences between the means of the different groups of banks. ANOVA analysis is an analysis of variance that tests the hypotheses that a difference between the means of two independent samples is attributable to chance.
The results of Levene’s test (p<0,05) show that in terms of ROA and ROE there is homogeneity of variance between the two samples of banks (online and branching).
However, the results of the ANOVA (p<0,05) indicate that, for both ROA and ROE,
there are statistically significant differences between the means of online bank and
the branching bank samples. These findings provide evidence that the branching
bank sample and the online bank sample perform differently in terms of ROA and
ROE.
6
To begin the analysis of the two samples, Table 2 exhibits the means and standard deviations for the variables used in the regression tests, based on quarterly data from 2002:Q1 through 2008:Q3. The 18 rows contain financial performance ratios used as endogenous variables in the regressions. The statistics displayed in column 1 (“Benchmark Banks”) describe the population of similar size branching banks and thrifts (with 2002:Q1 assets within a range defined by ING Bank’s assets ± 10%) that operate with more than one branch in the U.S. markets during the sample period.
1Significant differences between the means of the benchmark banks and ING Bank provide evidence of a performance gap between the main Internet-only bank and comparable size branching banks.
Table 2: Performance ratios
Benchmark Banks ING Bank FSB (N= 480;K= 21) (N= 27; K= 1) Performance ratios Mean Std Dev Mean Std Dev ROA 0,01130 0,01063 0,00421 0,00176 ROE 0,13217 0,16357 0,05192 0,03159 Spread 0,04096 0,01188 0,01421 0,00620 LOANRATE 0,06219 0,01048 0,04442 0,00561 DEPRATE 0,02123 0,01097 0,03021 0,00919 LOANS 0,59579 0,19107 0,27114 0,04926 DEPOSITS 0,66941 0,14932 0,77755 0,04003 FEES 0,01245 0,01598 0,00045 0,00045 NIEXP 0,02526 0,01549 0,00752 0,00292 LABOREXP 0,01232 0,00794 0,00262 0,00087 FTES 0,00021 0,00011 0,00003 0,00001 WAGE ($1.000) 59,43 23,05 84,67 8,27 PREMEXP 0,00442 0,00280 0,00112 0,00053 OTHEREXP 0,00898 0,00955 0,00378 0,00165 OVERHEAD 0,01309 0,00833 0,00162 0,00052 EQUITY 0,08500 0,02153 0,08901 0,02635 GROWTH 0,09480 0,29465 0,53000 0,70626 BADLOANS 0,00698 0,00528 0,00069 0,00039
Source: FDIC
1 We chose a ±10% range because the resulting sample includes a nearly balanced number of greater (10) and smaller (9) banks than ING Bank. Had we chosen an either narrower or wider range (e.g. 5% or 15%), the resulting sample would be clearly uneven.
7
Profitability at the Internet-only leading bank was much lower than the higher profitability at the typical branching bank in the benchmark. On average, ROA and ROE were about 70 and 800 basis points lower respectively. However, a closer look at the components of profitability indicates that ING Bank has successfully applied many elements of the Internet-primary business model, such as low interest margins, low fees, low labor expense, high wages, low overhead ratios, and fast asset growth.
For the period analyzed, average asset growth rates reveal that ING Bank’s growth is in accordance with the high growth generally associated with the Internet-primary banking business model. ING Bank’s average growth rate is about 5.6 times that of the branching bank benchmark. Nevertheless, in light of the historical trends (see Figure 1), ING Bank’s growth rates have declined over time whereas branching bank’s have been fairly stable, which suggests that the extremely high growth ING Bank experienced in the beginning of its operations in the US is not sustainable in the long run. As a result, ING Bank’s growth rates are much more homogeneous to the benchmark’s towards the end of the time path than at the outset.
Figure 1
Concerning ROA historical trends (see Figure 2), although ING Bank’s is somewhat
erratic, there is a gradual closing of the profitability gap mostly attributable to the
remarkable fall of the benchmark’s over the sampling period.
8
Figure 2
Figure 3
The ROE time path (see Figure 3) follows a similar pattern as that of ROA, that is,
there is a narrowing gap between ING Bank and the comparable branching bans up
to the 24
thquarter (December, 2007), when ING Bank’s ROE beats that the
9
benchmark. The subsequent quarters show increasingly volatile records that may be related with the financial crises that started by September 2007.
The profitability gaps can be explained by the different trends in the two main sources of income (interest margins and fees) for each, the benchmark and the Internet-only bank. The benchmark’s interest margin (SPREAD) averaged 267 basis point higher that ING Bank’s. The spread time path shows that ING Bank has always operated with both lower loan rates and higher deposits rates than the average branching bank in the benchmark. Even though there is some convergence over the last two years (see Figure 4), a significant spread gap still remains, showing that the prevailing Internet-primary banking model in the US keeps operating with a much slimmer interest margin than comparable branching banks.
Figure 4
Despite offering more attractive prices, ING Bank generated fewer loans (LOANS
was about 32 percentage points lower). However, the Internet-only bank was more
successful than the average branching bank at attracting deposits (DEPOSITS was
nearly 11 percentage points higher). On the one hand, the low level of loan
generation is consistent with the low-involvement nature of banking without branch
offices.
10
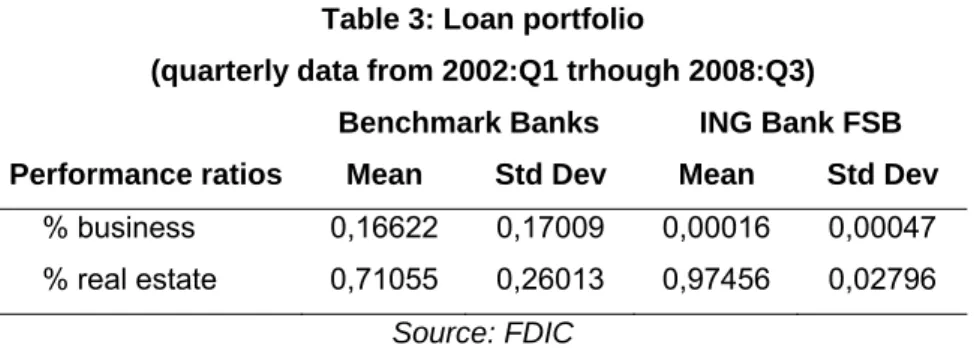
Table 3: Loan portfolio
(quarterly data from 2002:Q1 trhough 2008:Q3) Benchmark Banks ING Bank FSB Performance ratios Mean Std Dev Mean Std Dev % business 0,16622 0,17009 0,00016 0,00047 % real estate 0,71055 0,26013 0,97456 0,02796
Source: FDIC
Mortgages, auto loans, credit cards, and other transaction loans can be underwritten using underwriting automated techniques easily deployed over the Internet, but relationship lending to small businesses requires person-to-person contact. The loan portfolio data presented in Table 3 shows that while commercial and industrial loans make up 16.6% of branching banks’ total loans they are virtually nil for ING Bank. On the other hand, the higher level of deposit generation by ING Bank could be due to higher interest rates and to the simple nature of this kind of transaction.
Figure 5
In relation to the fees historical records (see Figure 5), benchmark banks’ trend indicates a slow deterioration of this source of income during the studied period.
Although fee income is a negligible source of income to ING Bank (0.04%), it
provides benchmark banks with a source of income (1.24%) that complements
11
interest margin income. Low or no fees is one of the distinct characteristics of the Internet-primary business model which is confirmed by ING Bank’s records. It is very likely that the emergence of the Internet-primary banking model has had an impact on branching bank’s declining fee income.
Benchmark banks’ total non-interest expense ratio is 177 basis points higher than ING Bank’s, which may indicate lower “labor expense” and reduced “premises and equipment expense” typical of the Internet-primary model. Indeed, this is confirmed by the much lower average labor expense ratio (see Table 1). The labor expense historical trends clearly illustrate that this remains a major difference between the two banking models. The time paths for both ING Bank and the benchmark (see Figure 6) have been fairly parallel over the 27-quarter period and the large existing gap did not shrink in any way. In addition, ING Bank has achieved a significantly lower labor expense while paying salaries that exceeded by 25,240$, on average, those paid by branching banks (see Table 1).
Consistent with lower labor expense as a distinctive trait of the Internet-primary
model, the full-time employees divided by total assets ratio (FTES in Table 1) is, on
average, about seven times higher for benchmark banks. If we invert this ratio to
obtain the “assets managed by employee” historical trends (see Figure 7), it is
noteworthy that ING Bank’s grows continuously until the 17
thquarter (March, 2006) of
our sampling period and starts declining thereafter. Although branching banks have
experienced steady growth in assets managed by employee, ING Bank’s higher
efficiency in the use of human resources sets apart these two ways of banking.
12
Figure 6
Figure 7
13
3. Methodology
Panel data analysis is a method of studying a particular subject within multiple sites, periodically observed over a defined time frame. Within the social sciences, panel analysis has enabled researchers to undertake longitudinal analyses in a wide variety of fields. In economics, panel data analysis is used to study the behavior of firms over time. With repeated observations of enough cross-sections, panel analysis permits the researcher to study the dynamics of change with short time series. The combination of time series with cross-sections can enhance the quality and quantity of data in ways that would be impossible using only one of these two dimensions (Gujarati, 2003).
Panel data analysis endows regression analysis with both a spatial and temporal dimension. The spatial dimension pertains to a set of cross-sectional units of observation. These could be countries, states, firms, commodities, groups of people, or even individuals. The temporal dimension pertains to periodic observations of a set of variables characterizing these cross-sectional units over a particular time span.
Pooled-data model
This model assumes that the intercept and the slope of the individuals are constant and consistent for all of them, i.e. are treated as a single data-point cloud.
The model in the multivariate case has the following specification:
Yit Xkit kuit
Where:
Nt t t
it
Y Y Y
Y
2 1
,
knt nt
nt
t k t
t
t k t
t
kit
X X
X
X X
X
X X
X X
2 1
2 22
12
1 21
11
,
Nt t t
it
2 1
,
Nt t t
it
u u u
u
2 1
,is a vector
containing the random perturbations of each individual.
It is assumed that E (u
it) = 0 with constant variance σ
2uand that the variable X
kitis
uncorrelated with the random disturbance u
it. Furthermore the homoscedasticity and
14
not autocorrelation between each of the groups’ disturbances, nor temporarily.
Therefore, OLS estimators are consistent and efficient.
Sometimes the pooled-data model does not provide a realistic representation of the data because it takes the data as a point cloud over which econometric regression is performed.
2Yet, at times, although each bank has a different starting point, they all behave in a similar way over time. And this is why there are both fixed effects and random effects models which study each institution individually.
3Regression model
The regression model used for research is as follows:
PERFORMANCEI,T 1ONLINEi2lnASSETSi,t3ONLINEilnASSETSi,t
4%BUSSINESSi,t5%REALSTATEi,t6LOANSi,t7ALLOWANCEi,t
8UNEMPLOYMENTt9YEARt10QUARTERti,t
Where PERFORMANCE can be one of the 18 financial performance ratios previously calculated. The subscript i indicates the name of the bank observed, and the subscript t stands for time in quarters. ONLINE is a dummy variable that takes the value 1 when we refer to ING Bank and 0 otherwise, and β1 indicates the difference of being an online bank to be a traditional bank, where β1 is statistically significant.
The lnASSETS controls for the effects of operating scale on bank performance.
ONLINE*lnASSETS captures possible economies of scale resulting from the technology used (Internet). The terms %REALSTATE and %BUSSINESS are included to control the effects of loan portfolio structure on banks’ earnings and the growth rates. LOANS and ALLOWANCE are standard measures of bank riskiness.
UNEMPLOYMENT is included to control the economic conditions during the study period. QUARTER and YEAR are dummy variables that controls the cyclical and seasonal influences on bank performance not captured by the other control variables.
2 For a recent review see Hsiao (2007).
3 For further reference, see Arellano (2003) and Baltagi (2001).
15
4. Empirical analysis results
Appendix 3 displays the estimated values of β from the regression of the equation.
The signs of the estimated β values are largely consistent with the performance gaps inferred by the difference of means tests in Table 2. However, the performance gaps inferred by the regression are more statistically significant and have different magnitudes because they are conditioned on the exogenous regression variables.
In terms of Return On Assets, there are technology-based scale effects that enhance the profitability of ING Bank. The adverse generic scale effects affecting the spread are due to the fact that as banks grow larger they are able to operate with thinner interest spreads. However, the favorable technology-based scale effects are shrinking the spread gap between ING Bank and branching banks. On the one hand, the adverse generic scale effects on loan rates have to do with the ability of larger banks to lend at lower rates than smaller banks. On the other hand, there are technology-based scale effects that suggest an increasing ability of ING to lend at higher rates as it grows larger. Also, there are generic scale effects which suggest that the larger the bank the lower the interest rates paid on deposits which suggests that size has an impact on clients confidence: the larger the bank the greater the clients’ confidence. And this is why clients are willing to accept lower deposit rates from larger banks. In terms of the amount of assets invested in loans, we may say that the higher the asset volume the lower the percentage of loans to total assets.
Similarly, banks with higher asset volume are less dependent on client deposits as a source of funds than smaller banks. Concerning fee income to total assets, we find generic scale effects indicating that larger banks generally obtain lower fees to total assets ratios, which suggests that larger banks are able to operate with lower fee income than smaller banks.
Regarding non-interest expense we find both favorable generic scale effects and
adverse technology-based scale effects. These findings suggest that although ING
still operates with lower non-interest expense than branching banks, it is not being
successful at restraining non-interest expense as it grows, which indicates an erosion
of ING’s competitive advantage. Again, with regard to labor expense we find both
favorable generic scale effects and adverse technology-based scale effects that
16
reduce ING’s initial advantage in labor expense. This is a critical difference between the two business models and challenges the idea that online banks are able to grow without significant labor expense increases. As to the number of full-time employees over total assets, the data indicates that there are generic scale effects, meaning that as banks grow larger, the average employee is able to manage higher assets volume. However, we also observe the existence of adverse technological scale effects that signals an increasing loss of efficiency in human resources management as ING grows. We also find noteworthy the existence of favorable generic scale effects in terms of expense on premises and equipment. While there are favorable generic scale effects on other non-interest expenses (non-labor and non-premises), ING does not obtain any significant technology-based scale effects.
Quite surprisingly, the results for overhead indicate that thanks to favorable generic scale effects larger banks operate with lower physical assets to total assets while there are no significant technology-based scale effects. In terms of equity, technology-based scale effects indicate that as ING gets bigger it can operate with a lower level of capitalization. Although the results show favorable generic scale effects on growth, meaning that larger banks grow at higher rate, there are unfavorable technology-based scale effects indicating that ING growth rates are slowing down as it gets bigger. Finally, in reference to bad loans, on the one hand, we observe that there are favorable generic scale effects, that is, banks are able to reduce bad loans as they grow. On the other hand there are adverse technology-based scale effects suggesting that ING ratio of bad loans gets worse as it gets larger.
5. Conclusions
As the Internet expands, traditional branching banks in the USA have entered the Internet banking business as a defensive move. In fact, most of them adopted Internet banking as a component of a multichannel distribution strategy. There are only a few banks which have implemented an Internet-primary business model.
The structure of the Internet-primary banking sample is characterized by the
overwhelming predominance of a single large institution (larger than all the other
Internet-primary institutions combined) with a distinct business model which deserves
17
individual consideration. Thus, we have chosen to match ING Bank with a branching bank benchmark.
A potential source of value in Internet-primary banks comes from automation and increased scale. Since automated processes typically require large fixed investments but reduce variable costs, e-commerce applications may substantially reduce per-unit costs or increase the optimal size of the firm.
This study attempts to identify and estimate the implications of scale at the leading Internet-primary bank throughout the 2002-2008 period. The framework used to address scale effects allows increased size to improve performance in two different ways: through general scale effects, which are available to all banks regardless of their business model, and technology-based scale effects, which are available only to Internet-primary banks.
An empirical analysis tests for the existence of these scale effects for the leading Internet-only bank in the US, using 21 similar-size branching banks as a performance benchmark. On the one hand, there is evidence of favorable technology-based scale effects that yield a differentially greater improvement of ING Bank’s financial performance relative to branching bank’s in terms of return on assets and spread. On the other hand, there is evidence that adverse technology-based scale effects are narrowing down the performance gap between ING Bank and branching banks in terms of non interest expense, labor expense, and efficiency in human resources management, which may entail the eventual loss of ING Bank’s distinctive competitive advantages. In addition, while there is evidence that generic scale effects help reduce the bad loans ratio, adverse technology-based effects show increasing bad loans ratio for ING Bank.
Regarding the level of capitalization, there is evidence that technology-based effects
allow for lower levels of capitalization as ING Bank grows. This is consistent with
reports that initially capital regulations were applied more strictly to Internet-primary
banks. As regulators have gained experience and become more comfortable with this
business model, the superior capital requirements have been relaxed, making the
model more attractive to investors.
18
Finally, although there is evidence of favorable generic scale effects on growth, there are also technology-based scale effects that diminish ING Bank growth rates, suggesting that ING Bank cannot sustain past sky-scraping growth rates as it gets larger.
Nevertheless, the obtained results should be considered with caution. As this case study focuses on a financial institution with unique characteristics, our findings cannot be generalized to other Internet-primary financial institutions.
The mixed picture we obtain from our analysis, whereby ING Bank is improving
financial performance while losing some distinctive competitive advantages, is
pointing towards a gradual convergence between the leading Internet-primary bank
and comparable branching banks in the USA.
19
6. References
Arellano M (2003) Panel data econometrics. Oxford University Press, Oxford.
Baltagi B.H. (2001) Econometric analysis of panel data, 2nd edn. Wiley, New York.
Chen SH (2009) Establishment of a performance-evaluation model for service quality in the banking industry. The Service Industries Journal 29 (2), 235-247.
De Young R (2001) The financial performance of pure play Internet banks. Economic Perspectives 25 (1), first quarter, Bank of Chicago.
De Young R (2005) The performance of Internet-based business models: evidence from the banking industry. Journal of Business, University of Chicago 78 (3), 893- 947.
Figueira C, Nellis, J (2009) Bank merger and acquisitions activity in the EU: much ado about nothing?. The Service Industries Journal, 29 (7), 875-886.
Furst K, Lang W, Nolle D (2002) Internet banking: developments and prospects.
Program on Information Resources Policy. Center for Information Policy Research & Harvard University, Cambridge.
Gujarati D (2003) Basic Econometrics. 4th ed. New York: McGraw Hill.
Hausman JA (1978) Specification tests in econometrics. Econometrica 46: 1251–
1271.
Hsiao C (2007) Panel data analysis—advantages and challenges. Test 16 (1): 1-22.
Liu TC, Wu LW (2009) Cross-buying evaluations in the retail banking industry. The Service Industries Journal 29 (9): 903-922.
Locke S, Boulanaour Z (2009) Cost of small business banking: a New Zealand study.
Service Business 3 (3): 211-227.
Moore RR (1998) Concentration, technology and market power in banking: Is distance dead?. Financial Industry Studies, Federal Reserve of Dallas, December, 1-24.
Nadiri H, Kandampully J, Hussain K (2009) Zone of tolerance for Banks: a diagnostic model of service quality. The Service Industries Journal 29 (11), 1547-1564.
Peris-Ortiz M, Rueda-Armengot C (2010) Organisational capabilities and transaction
costs in the analysis of activities and their externalisation: implications for the
service industry. Service Business, vol. 4 (2): 105-122.
20
Proença JF, de Castro LM (2007) The business-to-business relationship dimensions
in financial services markets. Service Business 1 (1): 63-78.
Pyun CS (2002) Internet banking in the U.S., Japan and Europe. Multinational Business Review, Fall: 73-81.
Rackley T (2000) Planning is key to cyberbanking success. Bank system and technology 37 (2).
Roofthooft W (2010) Customer equity: a creative tool for SMEs in the services industry. How small and medium enterprises can win the battle for innovation.
Service Business 4 (1): 37-48.
Sheshunoff A (2000) Internet banking—an update from the frontlines. ABA Banking Journal, January: 51-52.
Sufian F (2009) Sources of TFP growth in the Malaysian Islamic banking sector. The Service Industries Journal 29 (9): 1273-1291.
Wang CH, Hsu LC, Fang SR (2009) Constructing a relationship-based brand equity model. Service Business 3 (3): 275-292.
Yousafzai S, Pallister J, Foxall G (2009) Multi-dimensional role of trust in Internet
banking adoption. The Service Industries Journal 29 (5): 591-605.
21 APPENDIX 1
FINANCIAL PERFORMANCE RATIO DEFINITIONS
1. ROA: return on assets (annualized).
2. ROE: return on book equity (annualized).
3. SPREAD: LOANRATE minus DEPRATE.
4. LOANRATE: interest and fees received on loans divided by total loans (annualized).
5. DEPRATE: interest paid on deposits divided by total deposits (annualized).
6. LOANS: total loans divided by total assets.
7. DEPOSITS: total deposits divided by total assets.
8. FEES: non-interest income divided by total assets (annualized).
9. NIEXP: total non-interest expense divided by total assets (annualized).
10. LABOREXP: salary and benefits expense divided by total assets (annualized).
11. FTES: number of full-time-equivalent employees divided by total assets.
12. WAGE: salary and benefits expense divided by FTES (annualized).
13. PREMEXP: expense on premises and equipment divided by total assets (annualized).
14. OTHEREXP: all “other” (i.e., non-labor and non-premises) non-interest expenses divided by total assets (annualized).
15. OVERHEAD: book value of physical assets divided by total assets.
16. EQUITY: book value of equity divided by total assets.
17. GROWTH: asset growth rate (annualized).
18. BADLOANS: nonperforming loans divided by total assets.
22 APPENDIX 2
Exogenous Variables
%BUSSINESS: commercial and industrial loans divided by total loans.
%REALSTATE: real estate loans divided by total loans.
LOANS: total loans.
LOAN LOSS ALLOWANCE: allowance for loan and lease losses.
UNEMPLOYMENT: US rate of unemployment.
QUARTER: seasonal dummy variable
23 APPENDIX 3
Panel Data Results
PERFOMANCE Effects Intercept ONLINE LNASSETS
ONLINE·
LNASSETS % BUSINESS % REALSTATE LOANS
LOAN LOSS
ALLOWANCE UNEMPLOYMENT quarter 2 quarter 3 quarter 4 ROA Fixed 0,018395 n/a -0.000779 0.004751 ** -0.016492 0.009464 -2.97E-11 -1.45E-07 *** 0.001141 ** 0.000798 0.000424 -0.000488 ROE Fixed -0.269529 n/a 0.019200 0.021314 -0.294062 0.133409 5.83E-09 * -3.07E-06 *** 0.033413 *** 0.017165 0.011218 -0.001944
SPREAD Fixed 0.165638
*** n/a -0.009765 *** 0.004059 ** 0.018566 * 0.032959 *** -1.00E-12 -8.93E-09 0.000165 0.000471 0.000741 0.000870 LOAN RATE Fixed 0.292317
***
n/a -0.014527 *** 0.004762 * 0.029149 ** 0.040913 *** 6.63E-10 *** 3.77E-08 *** -0.007948 *** -0.000214 0.000647 0.000225 DEPOSIT RATE Rando
m
0.115328
***
0.008483 -0.004621 *** 2.37E-05 0.009367 0.018301 *** 7.19E-10 *** 3.98E-08 *** -0.007862 *** -0.000643 -0.000103 -0.000659
LOANS Fixed 3.344359
***
n/a -0.179521 *** -0.006106 0.042368 0.186874 *** 1.89E-08 *** -5.03E-08 -0.023271 *** -0.007203 0.000920 -0.007534 DEPOSITS Rando
m
2.028811
***
0.277316 -0.092121 *** -0.000284 0.482920 ** 0.066989 6.25E-09 *** 6.20E-07 *** -0.016966 *** 0.002009 0.002893 0.004800
FEES Fixed 0.096180
***
n/a -0.005005 *** 0.000290 -0.024291 ** 0.002284 6.21E-10 *** -6.05E-08 *** 0.000281 -0.000162 0.000543 -0.000330 NON INTEREST
EXPENSE
Fixed 0.224897
***
n/a -0.012777 *** 0.004970 *** -0.000248 -0.000493 3.17E-10 * 3.36E-08 *** -0.000497 -0.000960 -0.000252 -0.000605 LABOR
EXPENSE
Fixed 0.105070
***
n/a -0.005917 *** 0.003382 *** 0.010529 * -0.002330 1.08E-10 1.01E-08 ** -0.000410 -0.000203 8.32E-05 -0.000543
FTES Fixed 0.002095
*** n/a -0.000122 *** 8.78E-05 *** 0.000147 *** -0.000100*** 2.80E-12 *** -1.23E-10 *** 6.16E-06 ** -1.12E-06 5.32E-07 -3.06E-07 WAGE Fixed -6.417116 n/a 5.143238 -2.607622 36.28795 10.72090 -4.68E-08 -2.20E-05 -4.778836 *** 0.730180 1.535704 -0.684193 PREMEXP Rando
m 0.027823
*** -0.009328 -0.001701 *** 0.000514 0.006477 *** 0.002101 * 3.35E-11 7.91E-09 *** 8.80E-05 0.0000137 0.000161 9.25E-05 OTHEREXP Fixed 0.095230
***
n/a -0.005297 *** 0.001005 -0.024784 *** 0.002004 1.87E-10 1.49E-08 *** -0.000269 -0.000763
*
-0.000559 -0.000146 OVERHEAD Rando
m
0.028011
**
-0.017845 -0.001260 * 0.000795 0.018629 *** -0.004211 * -1.51E-11 1.81E-08 *** 0.000606 *** 0.000140 -2.48E-06 8.37E-05
EQUITY Fixed 0.138134
** n/a -0.001148 -0.030804 *** 0.009985 0.012652 2.25E-10 -5.09E-08 *** -0.002668 ** -0.000488 -4.14E-05 -0.001272 GROWTH Fixed -3.216166
*
n/a 0.240254 ** -0.727315 *** -0.379213 0.142374 0.142374 -1.67E-06 *** 0.045584 0.020441 -0.014676 -0.024711 BAD LOANS Fixed 0.064691
***
n/a -0.004002 *** 0.003609 *** 0.003609 0.000450 -6.02E-11 ** 4.56E-08 *** 4.56E-08 5.20E-05 -8.71E-06 -0.000124 P-value: (*) Significant at 10%, (**) Significant at 5% and (***) Significant at 1
F
UNDACIÓN DE LASC
AJAS DEA
HORROS DOCUMENTOS DE TRABAJOÚltimos números publicados
159/2000 Participación privada en la construcción y explotación de carreteras de peaje Ginés de Rus, Manuel Romero y Lourdes Trujillo
160/2000 Errores y posibles soluciones en la aplicación del Value at Risk Mariano González Sánchez
161/2000 Tax neutrality on saving assets. The spahish case before and after the tax reform Cristina Ruza y de Paz-Curbera
162/2000 Private rates of return to human capital in Spain: new evidence F. Barceinas, J. Oliver-Alonso, J.L. Raymond y J.L. Roig-Sabaté 163/2000 El control interno del riesgo. Una propuesta de sistema de límites
riesgo neutral
Mariano González Sánchez
164/2001 La evolución de las políticas de gasto de las Administraciones Públicas en los años 90 Alfonso Utrilla de la Hoz y Carmen Pérez Esparrells
165/2001 Bank cost efficiency and output specification Emili Tortosa-Ausina
166/2001 Recent trends in Spanish income distribution: A robust picture of falling income inequality Josep Oliver-Alonso, Xavier Ramos y José Luis Raymond-Bara
167/2001 Efectos redistributivos y sobre el bienestar social del tratamiento de las cargas familiares en el nuevo IRPF
Nuria Badenes Plá, Julio López Laborda, Jorge Onrubia Fernández
168/2001 The Effects of Bank Debt on Financial Structure of Small and Medium Firms in some Euro- pean Countries
Mónica Melle-Hernández
169/2001 La política de cohesión de la UE ampliada: la perspectiva de España Ismael Sanz Labrador
170/2002 Riesgo de liquidez de Mercado Mariano González Sánchez
171/2002 Los costes de administración para el afiliado en los sistemas de pensiones basados en cuentas de capitalización individual: medida y comparación internacional.
José Enrique Devesa Carpio, Rosa Rodríguez Barrera, Carlos Vidal Meliá
172/2002 La encuesta continua de presupuestos familiares (1985-1996): descripción, representatividad y propuestas de metodología para la explotación de la información de los ingresos y el gasto.
Llorenc Pou, Joaquín Alegre
173/2002 Modelos paramétricos y no paramétricos en problemas de concesión de tarjetas de credito.
Rosa Puertas, María Bonilla, Ignacio Olmeda
174/2002 Mercado único, comercio intra-industrial y costes de ajuste en las manufacturas españolas.
José Vicente Blanes Cristóbal
175/2003 La Administración tributaria en España. Un análisis de la gestión a través de los ingresos y de los gastos.
Juan de Dios Jiménez Aguilera, Pedro Enrique Barrilao González 176/2003 The Falling Share of Cash Payments in Spain.
Santiago Carbó Valverde, Rafael López del Paso, David B. Humphrey Publicado en “Moneda y Crédito” nº 217, pags. 167-189.
177/2003 Effects of ATMs and Electronic Payments on Banking Costs: The Spanish Case.
Santiago Carbó Valverde, Rafael López del Paso, David B. Humphrey
178/2003 Factors explaining the interest margin in the banking sectors of the European Union.
Joaquín Maudos y Juan Fernández Guevara
179/2003 Los planes de stock options para directivos y consejeros y su valoración por el mercado de valores en España.
Mónica Melle Hernández
180/2003 Ownership and Performance in Europe and US Banking – A comparison of Commercial, Co- operative & Savings Banks.
Yener Altunbas, Santiago Carbó y Phil Molyneux
181/2003 The Euro effect on the integration of the European stock markets.
Mónica Melle Hernández
182/2004 In search of complementarity in the innovation strategy: international R&D and external knowledge acquisition.
Bruno Cassiman, Reinhilde Veugelers
183/2004 Fijación de precios en el sector público: una aplicación para el servicio municipal de sumi- nistro de agua.
Mª Ángeles García Valiñas
184/2004 Estimación de la economía sumergida es España: un modelo estructural de variables latentes.
Ángel Alañón Pardo, Miguel Gómez de Antonio
185/2004 Causas políticas y consecuencias sociales de la corrupción.
Joan Oriol Prats Cabrera
186/2004 Loan bankers’ decisions and sensitivity to the audit report using the belief revision model.
Andrés Guiral Contreras and José A. Gonzalo Angulo
187/2004 El modelo de Black, Derman y Toy en la práctica. Aplicación al mercado español.
Marta Tolentino García-Abadillo y Antonio Díaz Pérez 188/2004 Does market competition make banks perform well?.
Mónica Melle
189/2004 Efficiency differences among banks: external, technical, internal, and managerial Santiago Carbó Valverde, David B. Humphrey y Rafael López del Paso
190/2004 Una aproximación al análisis de los costes de la esquizofrenia en españa: los modelos jerár- quicos bayesianos
F. J. Vázquez-Polo, M. A. Negrín, J. M. Cavasés, E. Sánchez y grupo RIRAG 191/2004 Environmental proactivity and business performance: an empirical analysis
Javier González-Benito y Óscar González-Benito
192/2004 Economic risk to beneficiaries in notional defined contribution accounts (NDCs) Carlos Vidal-Meliá, Inmaculada Domínguez-Fabian y José Enrique Devesa-Carpio
193/2004 Sources of efficiency gains in port reform: non parametric malmquist decomposition tfp in- dex for Mexico
Antonio Estache, Beatriz Tovar de la Fé y Lourdes Trujillo 194/2004 Persistencia de resultados en los fondos de inversión españoles
Alfredo Ciriaco Fernández y Rafael Santamaría Aquilué
195/2005 El modelo de revisión de creencias como aproximación psicológica a la formación del juicio del auditor sobre la gestión continuada
Andrés Guiral Contreras y Francisco Esteso Sánchez
196/2005 La nueva financiación sanitaria en España: descentralización y prospectiva David Cantarero Prieto
197/2005 A cointegration analysis of the Long-Run supply response of Spanish agriculture to the common agricultural policy
José A. Mendez, Ricardo Mora y Carlos San Juan
198/2005 ¿Refleja la estructura temporal de los tipos de interés del mercado español preferencia por la li- quidez?
Magdalena Massot Perelló y Juan M. Nave
199/2005 Análisis de impacto de los Fondos Estructurales Europeos recibidos por una economía regional:
Un enfoque a través de Matrices de Contabilidad Social M. Carmen Lima y M. Alejandro Cardenete
200/2005 Does the development of non-cash payments affect monetary policy transmission?
Santiago Carbó Valverde y Rafael López del Paso
201/2005 Firm and time varying technical and allocative efficiency: an application for port cargo han- dling firms
Ana Rodríguez-Álvarez, Beatriz Tovar de la Fe y Lourdes Trujillo 202/2005 Contractual complexity in strategic alliances
Jeffrey J. Reuer y Africa Ariño
203/2005 Factores determinantes de la evolución del empleo en las empresas adquiridas por opa Nuria Alcalde Fradejas y Inés Pérez-Soba Aguilar
204/2005 Nonlinear Forecasting in Economics: a comparison between Comprehension Approach versus Learning Approach. An Application to Spanish Time Series
Elena Olmedo, Juan M. Valderas, Ricardo Gimeno and Lorenzo Escot
205/2005 Precio de la tierra con presión urbana: un modelo para España Esther Decimavilla, Carlos San Juan y Stefan Sperlich
206/2005 Interregional migration in Spain: a semiparametric analysis Adolfo Maza y José Villaverde
207/2005 Productivity growth in European banking
Carmen Murillo-Melchor, José Manuel Pastor y Emili Tortosa-Ausina
208/2005 Explaining Bank Cost Efficiency in Europe: Environmental and Productivity Influences.
Santiago Carbó Valverde, David B. Humphrey y Rafael López del Paso
209/2005 La elasticidad de sustitución intertemporal con preferencias no separables intratemporalmente: los casos de Alemania, España y Francia.
Elena Márquez de la Cruz, Ana R. Martínez Cañete y Inés Pérez-Soba Aguilar
210/2005 Contribución de los efectos tamaño, book-to-market y momentum a la valoración de activos: el caso español.
Begoña Font-Belaire y Alfredo Juan Grau-Grau
211/2005 Permanent income, convergence and inequality among countries José M. Pastor and Lorenzo Serrano
212/2005 The Latin Model of Welfare: Do ‘Insertion Contracts’ Reduce Long-Term Dependence?
Luis Ayala and Magdalena Rodríguez
213/2005 The effect of geographic expansion on the productivity of Spanish savings banks Manuel Illueca, José M. Pastor and Emili Tortosa-Ausina
214/2005 Dynamic network interconnection under consumer switching costs Ángel Luis López Rodríguez
215/2005 La influencia del entorno socioeconómico en la realización de estudios universitarios: una apro- ximación al caso español en la década de los noventa
Marta Rahona López
216/2005 The valuation of spanish ipos: efficiency analysis Susana Álvarez Otero
217/2005 On the generation of a regular multi-input multi-output technology using parametric output dis- tance functions
Sergio Perelman and Daniel Santin
218/2005 La gobernanza de los procesos parlamentarios: la organización industrial del congreso de los diputados en España
Gonzalo Caballero Miguez
219/2005 Determinants of bank market structure: Efficiency and political economy variables Francisco González
220/2005 Agresividad de las órdenes introducidas en el mercado español: estrategias, determinantes y me- didas de performance
David Abad Díaz
221/2005 Tendencia post-anuncio de resultados contables: evidencia para el mercado español Carlos Forner Rodríguez, Joaquín Marhuenda Fructuoso y Sonia Sanabria García 222/2005 Human capital accumulation and geography: empirical evidence in the European Union
Jesús López-Rodríguez, J. Andrés Faíña y Jose Lopez Rodríguez
223/2005 Auditors' Forecasting in Going Concern Decisions: Framing, Confidence and Information Pro- cessing
Waymond Rodgers and Andrés Guiral
224/2005 The effect of Structural Fund spending on the Galician region: an assessment of the 1994-1999 and 2000-2006 Galician CSFs
José Ramón Cancelo de la Torre, J. Andrés Faíña and Jesús López-Rodríguez
225/2005 The effects of ownership structure and board composition on the audit committee activity: Span- ish evidence
Carlos Fernández Méndez and Rubén Arrondo García
226/2005 Cross-country determinants of bank income smoothing by managing loan loss provisions Ana Rosa Fonseca and Francisco González
227/2005 Incumplimiento fiscal en el irpf (1993-2000): un análisis de sus factores determinantes Alejandro Estellér Moré
228/2005 Region versus Industry effects: volatility transmission Pilar Soriano Felipe and Francisco J. Climent Diranzo
229/2005 Concurrent Engineering: The Moderating Effect Of Uncertainty On New Product Development Success
Daniel Vázquez-Bustelo and Sandra Valle
230/2005 On zero lower bound traps: a framework for the analysis of monetary policy in the ‘age’ of cen- tral banks
Alfonso Palacio-Vera
231/2005 Reconciling Sustainability and Discounting in Cost Benefit Analysis: a methodological proposal M. Carmen Almansa Sáez and Javier Calatrava Requena
232/2005 Can The Excess Of Liquidity Affect The Effectiveness Of The European Monetary Policy?
Santiago Carbó Valverde and Rafael López del Paso
233/2005 Inheritance Taxes In The Eu Fiscal Systems: The Present Situation And Future Perspectives.
Miguel Angel Barberán Lahuerta
234/2006 Bank Ownership And Informativeness Of Earnings.
Víctor M. González
235/2006 Developing A Predictive Method: A Comparative Study Of The Partial Least Squares Vs Maxi- mum Likelihood Techniques.
Waymond Rodgers, Paul Pavlou and Andres Guiral.
236/2006 Using Compromise Programming for Macroeconomic Policy Making in a General Equilibrium Framework: Theory and Application to the Spanish Economy.
Francisco J. André, M. Alejandro Cardenete y Carlos Romero.
237/2006 Bank Market Power And Sme Financing Constraints.
Santiago Carbó-Valverde, Francisco Rodríguez-Fernández y Gregory F. Udell.
238/2006 Trade Effects Of Monetary Agreements: Evidence For Oecd Countries.
Salvador Gil-Pareja, Rafael Llorca-Vivero y José Antonio Martínez-Serrano.
239/2006 The Quality Of Institutions: A Genetic Programming Approach.
Marcos Álvarez-Díaz y Gonzalo Caballero Miguez.
240/2006 La interacción entre el éxito competitivo y las condiciones del mercado doméstico como deter- minantes de la decisión de exportación en las Pymes.
Francisco García Pérez.
241/2006 Una estimación de la depreciación del capital humano por sectores, por ocupación y en el tiempo.
Inés P. Murillo.
242/2006 Consumption And Leisure Externalities, Economic Growth And Equilibrium Efficiency.
Manuel A. Gómez.
243/2006 Measuring efficiency in education: an analysis of different approaches for incorporating non-discretionary inputs.
Jose Manuel Cordero-Ferrera, Francisco Pedraja-Chaparro y Javier Salinas-Jiménez
244/2006 Did The European Exchange-Rate Mechanism Contribute To The Integration Of Peripheral Countries?.
Salvador Gil-Pareja, Rafael Llorca-Vivero y José Antonio Martínez-Serrano 245/2006 Intergenerational Health Mobility: An Empirical Approach Based On The Echp.
Marta Pascual and David Cantarero
246/2006 Measurement and analysis of the Spanish Stock Exchange using the Lyapunov exponent with digital technology.
Salvador Rojí Ferrari and Ana Gonzalez Marcos
247/2006 Testing For Structural Breaks In Variance Withadditive Outliers And Measurement Errors.
Paulo M.M. Rodrigues and Antonio Rubia
248/2006 The Cost Of Market Power In Banking: Social Welfare Loss Vs. Cost Inefficiency.
Joaquín Maudos and Juan Fernández de Guevara
249/2006 Elasticidades de largo plazo de la demanda de vivienda: evidencia para España (1885-2000).
Desiderio Romero Jordán, José Félix Sanz Sanz y César Pérez López 250/2006 Regional Income Disparities in Europe: What role for location?.
Jesús López-Rodríguez and J. Andrés Faíña
251/2006 Funciones abreviadas de bienestar social: Una forma sencilla de simultanear la medición de la eficiencia y la equidad de las políticas de gasto público.
Nuria Badenes Plá y Daniel Santín González
252/2006 “The momentum effect in the Spanish stock market: Omitted risk factors or investor behaviour?”.
Luis Muga and Rafael Santamaría
253/2006 Dinámica de precios en el mercado español de gasolina: un equilibrio de colusión tácita.
Jordi Perdiguero García
254/2006 Desigualdad regional en España: renta permanente versus renta corriente.
José M.Pastor, Empar Pons y Lorenzo Serrano
255/2006 Environmental implications of organic food preferences: an application of the impure public goods model.
Ana Maria Aldanondo-Ochoa y Carmen Almansa-Sáez
256/2006 Family tax credits versus family allowances when labour supply matters: Evidence for Spain.
José Felix Sanz-Sanz, Desiderio Romero-Jordán y Santiago Álvarez-García
257/2006 La internacionalización de la empresa manufacturera española: efectos del capital humano genérico y específico.
José López Rodríguez
258/2006 Evaluación de las migraciones interregionales en España, 1996-2004.
María Martínez Torres
259/2006 Efficiency and market power in Spanish banking.
Rolf Färe, Shawna Grosskopf y Emili Tortosa-Ausina.
260/2006 Asimetrías en volatilidad, beta y contagios entre las empresas grandes y pequeñas cotizadas en la bolsa española.
Helena Chuliá y Hipòlit Torró.
261/2006 Birth Replacement Ratios: New Measures of Period Population Replacement.
José Antonio Ortega.
262/2006 Accidentes de tráfico, víctimas mortales y consumo de alcohol.
José Mª Arranz y Ana I. Gil.
263/2006 Análisis de la Presencia de la Mujer en los Consejos de Administración de las Mil Mayores Em- presas Españolas.
Ruth Mateos de Cabo, Lorenzo Escot Mangas y Ricardo Gimeno Nogués.
264/2006 Crisis y Reforma del Pacto de Estabilidad y Crecimiento. Las Limitaciones de la Política Econó- mica en Europa.
Ignacio Álvarez Peralta.
265/2006 Have Child Tax Allowances Affected Family Size? A Microdata Study For Spain (1996-2000).
Jaime Vallés-Giménez y Anabel Zárate-Marco.
266/2006 Health Human Capital And The Shift From Foraging To Farming.
Paolo Rungo.
267/2006 Financiación Autonómica y Política de la Competencia: El Mercado de Gasolina en Canarias.
Juan Luis Jiménez y Jordi Perdiguero.
268/2006 El cumplimiento del Protocolo de Kyoto para los hogares españoles: el papel de la imposición sobre la energía.
Desiderio Romero-Jordán y José Félix Sanz-Sanz.
269/2006 Banking competition, financial dependence and economic growth Joaquín Maudos y Juan Fernández de Guevara
270/2006 Efficiency, subsidies and environmental adaptation of animal farming under CAP Werner Kleinhanß, Carmen Murillo, Carlos San Juan y Stefan Sperlich
271/2006 Interest Groups, Incentives to Cooperation and Decision-Making Process in the European Union A. Garcia-Lorenzo y Jesús López-Rodríguez
272/2006 Riesgo asimétrico y estrategias de momentum en el mercado de valores español Luis Muga y Rafael Santamaría
273/2006 Valoración de capital-riesgo en proyectos de base tecnológica e innovadora a través de la teoría de opciones reales
Gracia Rubio Martín
274/2006 Capital stock and unemployment: searching for the missing link
Ana Rosa Martínez-Cañete, Elena Márquez de la Cruz, Alfonso Palacio-Vera and Inés Pérez- Soba Aguilar
275/2006 Study of the influence of the voters’ political culture on vote decision through the simulation of a political competition problem in Spain
Sagrario Lantarón, Isabel Lillo, Mª Dolores López and Javier Rodrigo 276/2006 Investment and growth in Europe during the Golden Age
Antonio Cubel and Mª Teresa Sanchis
277/2006 Efectos de vincular la pensión pública a la inversión en cantidad y calidad de hijos en un modelo de equilibrio general
Robert Meneu Gaya
278/2006 El consumo y la valoración de activos Elena Márquez y Belén Nieto
279/2006 Economic growth and currency crisis: A real exchange rate entropic approach David Matesanz Gómez y Guillermo J. Ortega
280/2006 Three measures of returns to education: An illustration for the case of Spain María Arrazola y José de Hevia
281/2006 Composition of Firms versus Composition of Jobs Antoni Cunyat
282/2006 La vocación internacional de un holding tranviario belga: la Compagnie Mutuelle de Tram- ways, 1895-1918
Alberte Martínez López
283/2006 Una visión panorámica de las entidades de crédito en España en la última década.
Constantino García Ramos
284/2006 Foreign Capital and Business Strategies: a comparative analysis of urban transport in Madrid and Barcelona, 1871-1925
Alberte Martínez López
285/2006 Los intereses belgas en la red ferroviaria catalana, 1890-1936 Alberte Martínez López
286/2006 The Governance of Quality: The Case of the Agrifood Brand Names Marta Fernández Barcala, Manuel González-Díaz y Emmanuel Raynaud
287/2006 Modelling the role of health status in the transition out of malthusian equilibrium Paolo Rungo, Luis Currais and Berta Rivera
288/2006 Industrial Effects of Climate Change Policies through the EU Emissions Trading Scheme Xavier Labandeira and Miguel Rodríguez
289/2006 Globalisation and the Composition of Government Spending: An analysis for OECD countries Norman Gemmell, Richard Kneller and Ismael Sanz
290/2006 La producción de energía eléctrica en España: Análisis económico de la actividad tras la liberali- zación del Sector Eléctrico
Fernando Hernández Martínez
291/2006 Further considerations on the link between adjustment costs and the productivity of R&D invest- ment: evidence for Spain
Desiderio Romero-Jordán, José Félix Sanz-Sanz and Inmaculada Álvarez-Ayuso 292/2006 Una teoría sobre la contribución de la función de compras al rendimiento empresarial
Javier González Benito
293/2006 Agility drivers, enablers and outcomes: empirical test of an integrated agile manufacturing model Daniel Vázquez-Bustelo, Lucía Avella and Esteban Fernández
294/2006 Testing the parametric vs the semiparametric generalized mixed effects models María José Lombardía and Stefan Sperlich
295/2006 Nonlinear dynamics in energy futures Mariano Matilla-García
296/2006 Estimating Spatial Models By Generalized Maximum Entropy Or How To Get Rid Of W Esteban Fernández Vázquez, Matías Mayor Fernández and Jorge Rodriguez-Valez 297/2006 Optimización fiscal en las transmisiones lucrativas: análisis metodológico
Félix Domínguez Barrero
298/2006 La situación actual de la banca online en España
Francisco José Climent Diranzo y Alexandre Momparler Pechuán
299/2006 Estrategia competitiva y rendimiento del negocio: el papel mediador de la estrategia y las capacidades productivas
Javier González Benito y Isabel Suárez González
300/2006 A Parametric Model to Estimate Risk in a Fixed Income Portfolio Pilar Abad and Sonia Benito
301/2007 Análisis Empírico de las Preferencias Sociales Respecto del Gasto en Obra Social de las Cajas de Ahorros
Alejandro Esteller-Moré, Jonathan Jorba Jiménez y Albert Solé-Ollé
302/2007 Assessing the enlargement and deepening of regional trading blocs: The European Union case Salvador Gil-Pareja, Rafael Llorca-Vivero y José Antonio Martínez-Serrano
303/2007 ¿Es la Franquicia un Medio de Financiación?: Evidencia para el Caso Español Vanesa Solís Rodríguez y Manuel González Díaz
304/2007 On the Finite-Sample Biases in Nonparametric Testing for Variance Constancy Paulo M.M. Rodrigues and Antonio Rubia
305/2007 Spain is Different: Relative Wages 1989-98 José Antonio Carrasco Gallego
306/2007 Poverty reduction and SAM multipliers: An evaluation of public policies in a regional framework Francisco Javier De Miguel-Vélez y Jesús Pérez-Mayo
307/2007 La Eficiencia en la Gestión del Riesgo de Crédito en las Cajas de Ahorro Marcelino Martínez Cabrera
308/2007 Optimal environmental policy in transport: unintended effects on consumers' generalized price M. Pilar Socorro and Ofelia Betancor
309/2007 Agricultural Productivity in the European Regions: Trends and Explanatory Factors Roberto Ezcurra, Belen Iráizoz, Pedro Pascual and Manuel Rapún
310/2007 Long-run Regional Population Divergence and Modern Economic Growth in Europe: a Case Study of Spain
María Isabel Ayuda, Fernando Collantes and Vicente Pinilla
311/2007 Financial Information effects on the measurement of Commercial Banks’ Efficiency Borja Amor, María T. Tascón and José L. Fanjul
312/2007 Neutralidad e incentivos de las inversiones financieras en el nuevo IRPF Félix Domínguez Barrero
313/2007 The Effects of Corporate Social Responsibility Perceptions on The Valuation of Common Stock Waymond Rodgers , Helen Choy and Andres Guiral-Contreras
314/2007 Country Creditor Rights, Information Sharing and Commercial Banks’ Profitability Persistence across the world
Borja Amor, María T. Tascón and José L. Fanjul
315/2007 ¿Es Relevante el Déficit Corriente en una Unión Monetaria? El Caso Español Javier Blanco González y Ignacio del Rosal Fernández
316/2007 The Impact of Credit Rating Announcements on Spanish Corporate Fixed Income Performance:
Returns, Yields and Liquidity
Pilar Abad, Antonio Díaz and M. Dolores Robles
317/2007 Indicadores de Lealtad al Establecimiento y Formato Comercial Basados en la Distribución del Presupuesto
Cesar Augusto Bustos Reyes y Óscar González Benito
318/2007 Migrants and Market Potential in Spain over The XXth Century: A Test Of The New Economic Geography
Daniel A. Tirado, Jordi Pons, Elisenda Paluzie an