En primer lloc, es va estudiar el procés de mobilització d'arsènic a les aigües subterrànies comparant la composició química de les aigües subterrànies de tres àrees geogràfiques del districte de Bengala Occidental. El baix potencial redox (Eh = -185 a -86 mV) i el domini d'As (III) i Fe (II) indiquen la naturalesa anòxica dels aqüífers.
GENERAL INTRODUCTION
Occurrence and distribution of arsenic
- Distribution of arsenic in minerals
- Distribution of arsenic in rocks
The average concentration of arsenic in sedimentary rocks is typically in the range of 5 – 10 mg kg-1 [15]. The concentration of arsenic in sand and sandstone (quartz and feldspar) is much lower (4 mg kg-1) compared to loamy (13 mg kg-1) [16].
Sources of arsenic contamination
- Natural sources
- Anthropogenic sources
- Mining
- Fossil fuel burning
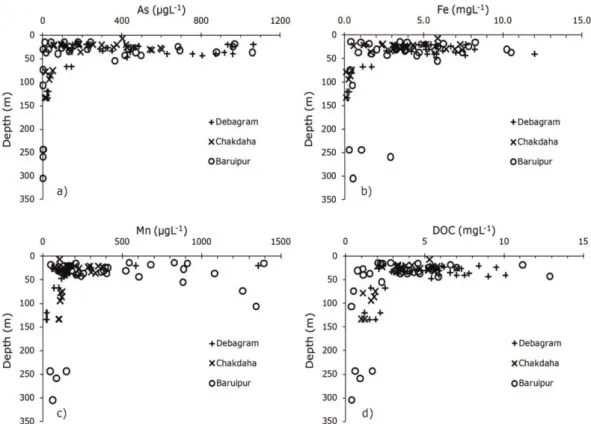
The concentration of arsenic and the distribution of the species in groundwater depend on the redox state of the groundwater and. Depth profile of (a) As, (b) Fe, (c) Mn and (d) DOC concentrations in the three study areas (Debagram, Chakdaha and Baruipur).
Agricultural use
- Wood preservation
- Contamination of arsenic in groundwater
- Arid oxidizing environment
- Mixed oxidizing and reducing environment
- Reducing environment
- Arsenic exposure and the assessment of biomarkers
- Exposure pathways of arsenic
- Evaluation of the biomarkers of arsenic exposure
- Removal of arsenic from contaminated water
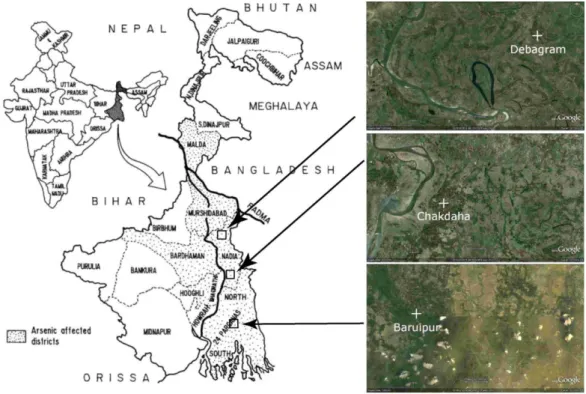
- Location and climate
- Physiography and geomorphology …
- Depositional environment
- Overview of the various geochemical processes responsible for arsenic
- References
OBJECTIVE
The main objective of this thesis is focused on understanding the interactions of arsenic in environmental and biological systems through the chemical speciation of its main species. Although extensive research has been conducted on arsenic mobilization in groundwater, our understanding of the various local anthropogenic and geogenic effects that may control elevated arsenic levels in groundwater is actually lacking. To understand these factors, we studied the groundwater chemistry and the process of arsenic mobilization by comparing three physiologically different areas.
The arsenic effect on humans has been measured by measuring arsenic on various biological fluids and structures, but each of these has some disadvantages. Although the proper understanding of the arsenic mobilization mechanism and the health effect of arsenic is of utmost importance, treatment technologies aimed at the removal of arsenic are equally important to be addressed, as the delivery of safe water to the arsenic-affected patients is the only effective alternative is for healing. With this goal, we tried to develop an adsorbent that could reduce the elevated levels of arsenic in aqueous solution.
nZVI was doped on the surface of an inert material (montmorillonite) and we tried to investigate the removal efficiency. We also studied the speciation of arsenic after adsorption onto absorbent material to understand the mechanism of arsenic removal from aqueous solution.
EXPERIMENTS AND RESULTS
Arsenic mobilization in the aquifers of West Bengal, India
- Introduction
- Materials and methods
- Sampling and analysis
- Geochemical modeling
- Results and discussion
- Groundwater chemical composition
- Distribution of redox sensitive elements in groundwater
- Thermodynamic calculations
- Factors controlling arsenic mobilization in groundwater
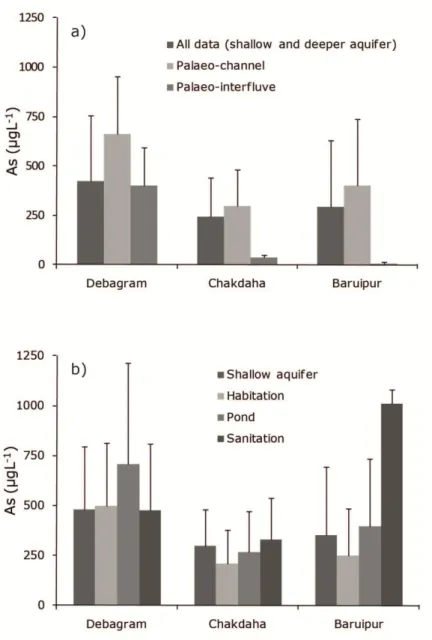
- Geomorphology and land use control of arsenic mobilization
- Conclusion s
- References
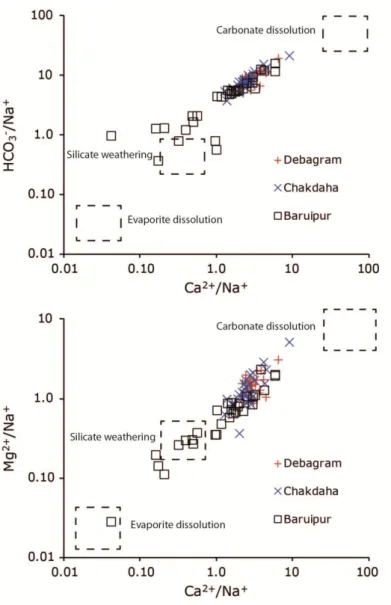
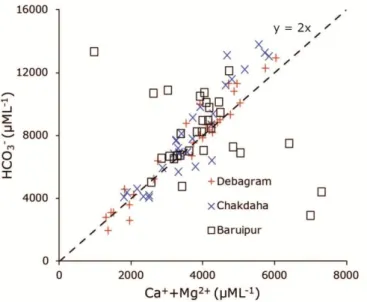
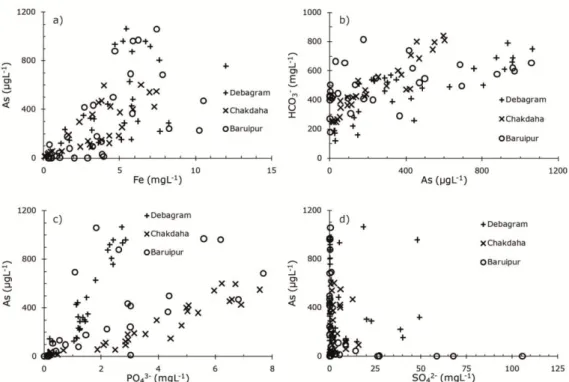
This artifact is also reflected in the Piper plot (Fig. 3.1.1). versus Ca2+ + Mg2+ to compare carbonate dissolution rates in the groundwater of the study areas. The concentration of DOC is also relatively high in the shallow aquifers of the Bhagirathi-Hooghly alluvial plain and delta front (5.7. The saturation indices (average values) of mineral phases in the groundwater of the Bhagirathi-Hooghly alluvial plain and delta front are shown in Switch off.
The presence of calcite, aragonite and rhodochrosite mineral phases in the sediment of the Bhagirathi-Hooghly alluvial plain and delta front was previously reported by other researchers [36,37]. 53] also showed a link between subsurface sedimentology (i.e. the distribution of paleosol, an ancient land surface) and depth heterogeneity of As in the groundwater of southern West Bengal. 36] observed paleochannel settings at the western edge of the study area, where groundwater contains high As concentrations (Fig. 3.1.7a).
The observation of high PO43 concentrations in the shallow aquifer of the delta front clearly indicates extensive anthropogenic activities that may further control the solubility of As in the aquifer. High Because the concentrations in the groundwater of the study areas were mainly controlled by the reductive dissolution of Fe-oxyhydroxides, catalyzed by the oxidation of organic matter. Ahmed, Flushing history as a hydrogeological control on the regional distribution of arsenic in shallow groundwater of the BDP, Environ.
Banerjee, Sedimentological control on Mn, and other trace elements, in groundwater of the Bengal delta, Environ.

Saliva as a biomarker of arsenic exposure
- Introduction
- Materials and methods
- Estimation of total inorganic As exposure
- Data analysis
- Results and discussion
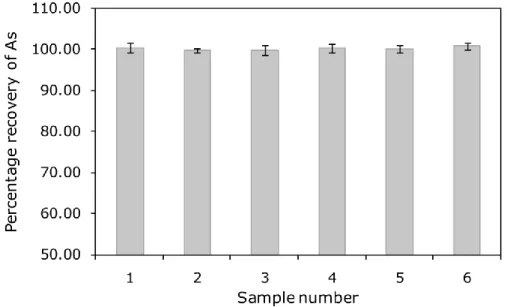
- Analytical protocol and quality control
- Arsenic exposure and total arsenic concentration in urine and saliva
- Factors regulating As concentration in urine and saliva
- Conclusions
- References
The concentrations of As in the urine samples were corrected to the average specific gravity of the samples (1.01 gmL-1). 33] had estimated the extent of As intake through rice by measuring the As concentration of the household rice samples and from the amount of daily rice consumption for each participant. Histogram and normal probability plot of the tabulated TDI, A concentration in urine and saliva revealed that the distribution was quite skewed and deviated from normality.
The influence of different demographic variables on As concentration in urine and saliva was tested by analysis of variance (ANOVA). The statistical results of As level in drinking water, tabular TDI, concentration of As in urine (UA) and saliva (SA) are shown in Table 3.2.1 and Log transformed data are shown in Fig. Statistical table of measured As concentration in drinking water, TDI, UA and SA of all participants.
Correlation matrix of the bivariate relationship between Log Total daily As intake, Log As in urine and saliva. L_TDI – Log of total daily As intake L_UAs – Log of urinary As concentration L_SAs – Log of salivary As concentration r – Pearson's correlation coefficient SEE – Standard error of estimate.
Speciation of salivary arsenic
- Introduction
- Materials and methods
- Reagents and standard chemicals
- Study group and sample collection
- Instrumentation
- Sample preparation
- Data processing
- Result and discussion
- Evaluation of the speciation method and analytical performance
- Analyses of the As species in saliva samples
- Study variables and their effect on salivary As
- Conclusions
- References
Saliva, a readily available biofluid, has been validated as a biomarker of arsenic (As) exposure in several villages of West Bengal, India. Pentavalent arsenic [As(V)] was found to be the predominant species in saliva, with the amount of inorganic As [As(V) and the trivalent form of As(III)] accounting for more than half of the total As in the samples. Analysis of the confounding effects of age, sex, smoking, body mass index and prevalence of skin lesions showed that women and controls without skin lesions had a higher ability to methylate the ingested compared to the rest of the population.
Thus, our study shows that As species in saliva can be a useful tool to predict the individual.
Montmorillonite-supported nanoscale zerovalent iron for removal of
- Materials and chemicals
- Preparation of Mt-nZVI
- Characterization and measurement
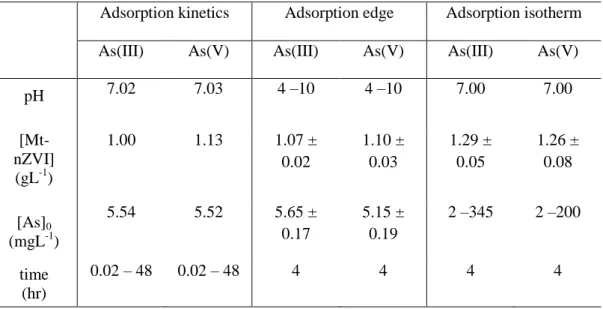
- Adsorption experiment
- Results and discussion
- Characterization
- Adsorption kinetics of As onto Mt-nZVI
- As adsorption edge
- Arsenic adsorption isotherm
- Characterization of the reaction product
- Effect of coexisting oxy-anions
- Applicability of Mt-nZVI to natural system
- Reusability of the composite
- Conclusion
- References
A mechanism for removal of As and method for regeneration of Mt-nZVI after repeated use have been proposed. The peak of As in Mt-nZVI after reaction (Fig. 3.4.2) further confirmed that As was adsorbed on the solid surface. The removal of As(III) and As(V) also decreased with decreasing concentration of Mt-nZVI from 1 to 0.1 mg L-1 (data not shown).
Schematic of (a) pseudo second-order kinetics of As(III) and As(V) adsorption on Mt-nZVI; (b) pseudo-second-order rate constant as a function of Mt-nZVI concentration. Pseudo first-order rate constant (Kads) for As(III) and As(V) adsorbed on Mt-nZVI. On the other hand, the pH of zero point charge (pHZPC) of the synthesized Mt-nZVI was determined to be 8.2.
Our results show that the values of n are within this range (Table 3.4.3), indicating favorable adsorption of As(III) and As(V) on Mt-nZVI. On the other hand, the XPS analysis for As(III)-reacted Mt-nZVI also showed the presence of As(V) alone, indicating complete oxidation of As(III) by the Mt-nZVI surface (Fig. 3.4.9b).
GENERAL DISCUSSION
Therefore, scientific communities are now engaged in understanding the different release mechanisms that cause high concentrations of arsenic in groundwater in different parts of the world. In order to understand the phenomenon of high arsenic content in groundwater, we conducted a comparative study of groundwater in geologically different areas. The separation of inorganic arsenic showed that As(III) always dominated over As(V) in the groundwater of our study areas.
Therefore, the exposure level of arsenic is quite high and poses a threat to the residents of the area. However, each of the previously used biomarkers represents some disadvantages, either in the form of complicated analysis of arsenic or incorrect interpretation of data. According to the charge and acidity of the arsenic species at this particular pH, As(III), DMA, MMA and As(V) were eluted in order.
The results suggested that the methylated arsenic is due to the methylation of the ingested arsenic. Phosphate in solution reduced arsenic adsorption and was attributed to competition for the same adsorption site on the adsorbent surface.
GENERAL CONCLUSIONS
However, the source, distribution and type of the available organic matter was linked to geomorphological features (eg abandoned canals) and local anthropogenic activities (eg sanitation, household waste, etc.). The release of arsenic in groundwater from Debagram and Baruipur was complex and due to the combination of processes such as carbonate mineral dissolution and reduction of Fe oxyhydroxides. Thus, one single arsenic mobilization mechanism was unable to explain the release of arsenic from these areas, but was governed by the simultaneous occurrence of multiple processes.
Our developed method for the determination of total arsenic in saliva was able to quantify low levels of arsenic in collected saliva samples. While rhodium was most suitable as an internal standard, addition of ethanol to the sample prior to analysis increased the sensitivity of arsenic in ICP-MS. Arsenic in saliva showed good correlation with ingested inorganic arsenic and also with urinary arsenic, which is now an established biomarker of arsenic exposure.
Our results showed As(V) was the major arsenic species in saliva for our studied population and the. Therefore, arsenic species in saliva could provide insight into the internal dose and any individual differences in susceptibility to arsenic exposure.
FUTURE TRENDS
It would be interesting to study the composition of arsenic in the saliva of people of different ethnic groups. Both of them were a great support to me during my doctoral studies and significantly contributed to better work. I have been fortunate to work with some of the best people in the field of arsenic, including Prof.
Chakraborty have been like my big brothers and I could always discuss with them about my studies and also about my work related things. Nela was the backbone of my stay in Girona and whenever I had problems related to any administrative or other issues, she would be there. They have a lot of experience working with ICP-MS and if there was a problem with the instrument, they would both open the instrument right away and I would be very confident that the next day the problem would be solved.
Carme or ``Professora'' is one of them and whenever there are any problems related to. Every day I got some strange questions about Catalan and its pronunciation and both Carme and Aida were kind enough to give me some information to improve my knowledge of the language.