Por el contrario, no se detectó relación entre BHBA preparto y PL el día 14 de lactancia. Estas condiciones ocurren comúnmente alrededor del parto y la lactancia temprana (Chapinal et al., 2012).
Origen de la cetosis
Aspectos bioquímicos de la cetosis
El acetil-CoA se produce por oxidación de ácidos grasos en las mitocondrias del hígado para luego ser metabolizados en el ciclo de los ácidos tricarboxílicos. Sin embargo, cuando hay un exceso de acetil-CoA, el ciclo ácido no la metaboliza y tiende a enviarla al hígado mediante un proceso conocido como cetogénesis (Botham & Mayes, 2015).
Metabolitos - síntesis y actividad biológica
Ácidos grasos no esterificados
McCarthy, Mann, Nydam, Overton y McArt (2015) informaron límites más flexibles, clasificando como bajas concentraciones inferiores a 1,0 mmol L-1 entre tres y 14 días en la leche.
Calcio
Aproximadamente, el 69% de las vacas lecheras experimentan niveles bajos de Ca2+ sérico en el período periparto (Martínez et al., 2016). Este trastorno afecta aproximadamente del 65 al 69% de las vacas multíparas con concentraciones de Ca2+ menores a 2.125 mmol L-1 después del parto (Martínez et al., 2016).
Impacto en la producción lechera e incidencia de trastornos
Producción de leche
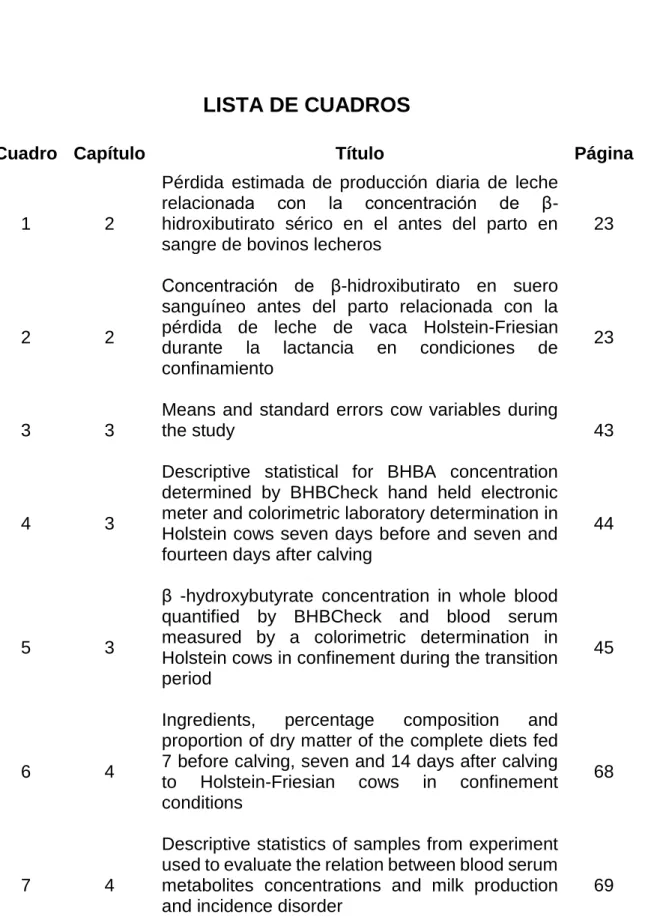
Pérdida estimada de producción diaria de leche (DML) relacionada con la concentración sérica de β-hidroxibutirato (BHBA) antes del parto (21-0 días) de ganado lechero en condiciones de confinamiento. Concentración de β-hidroxibutirato (BHBA) en suero sanguíneo preparto relacionada con la pérdida estimada de leche (PL) en vacas Holstein-Friesian durante una lactancia en condiciones de confinamiento con PL. Kg lactancia-1) Lactancia BHBA (mmol L-1) Referencia.

Trastornos metabólicos
25 La incidencia de problemas uterinos como metritis y retención de placenta se puede predecir cuando la concentración de AGNE es superior a 0,4 mmol L-1 durante dos semanas antes del parto (Hammon, Evjen, Dhiman, Goff & Walters, 2006; LeBlanc, 2006; Quiroz-Rocha et al., 2010), aunque el umbral crítico de AGNE para predecir la retención placentaria fue ≥ 0,3 mEq L-1. Las vacas con concentraciones séricas de NEFA superiores a ≥ 0,3 mEq L-1 una semana antes del parto tenían 1,8 veces más probabilidades de retener la placenta después del parto que las vacas con concentraciones más bajas (Chapinal et al., 2011). Las vacas con concentraciones de BHBA ≥ 1,0 mmol L-1 tenían 13,6 veces más probabilidades de desarrollar EA y 4,7 veces más probabilidades de desarrollar cetosis clínica (Seifi et al., 2011).
Estas vacas tenían 5,1 veces más probabilidades de experimentar desplazamiento del abomaso en la primera semana después del parto (Seifi et al., 2011).
Literatura citada
Prevalence of subclinical ketosis in primarily pasture-grazing New Zealand dairy cows in early lactation. Evaluation of eight cow-side ketone tests in milk for detection of subclinical ketosis in dairy cows. The concentrations of non-esterified fatty acids and beta-hydroxybutyrate in dairy cows are not well correlated during the transition period.
Diseases, reproductive performance and changes in milk production associated with subclinical ketosis in dairy cows: a meta-analysis and review. Validation of the BHBCheck β-hydroxybutyrate blood meter as a diagnostic tool for hyperketonemia in dairy cows.
ABSTRACT
INTRODUCTION
35 compared with laboratory determination (LiquiColor Assay; EKF Diagnostics-Stanbio, Boerne, TX, USA) in peripartum dairy cows in northern Mexico. We hypothesized that the electronic hand-held meter is as effective and accurate a tool as the laboratory method for diagnosing hyperketonemia.
MATERIALS AND METHODS
- Study area and animals
- Animal feeding and management
- Blood sampling
- Statistical analysis
The BHBA concentration of the sample obtained by the colorimetric enzyme test in the laboratory was used as the standard BHBA concentration for statistical analysis. PROC REG was used with the colorimetric laboratory test as the dependent variable and BHBCheck as the independent variable. A PROC MIXED analysis was then performed with a completely randomized design, with repeated measures, using cow identification as the subject and day of sampling as the repeated term.
Sensitive was obtained by PROC FREQ as the proportion of samples with BHBA concentration greater than 1.2 mmol/L correctly diagnosed as positive by BHBCheck. Specificity was estimated as the proportion of samples with BHBA concentration less than 1.2 mmol/L correctly diagnosed as negative.
RESULTS AND DISCUSSION
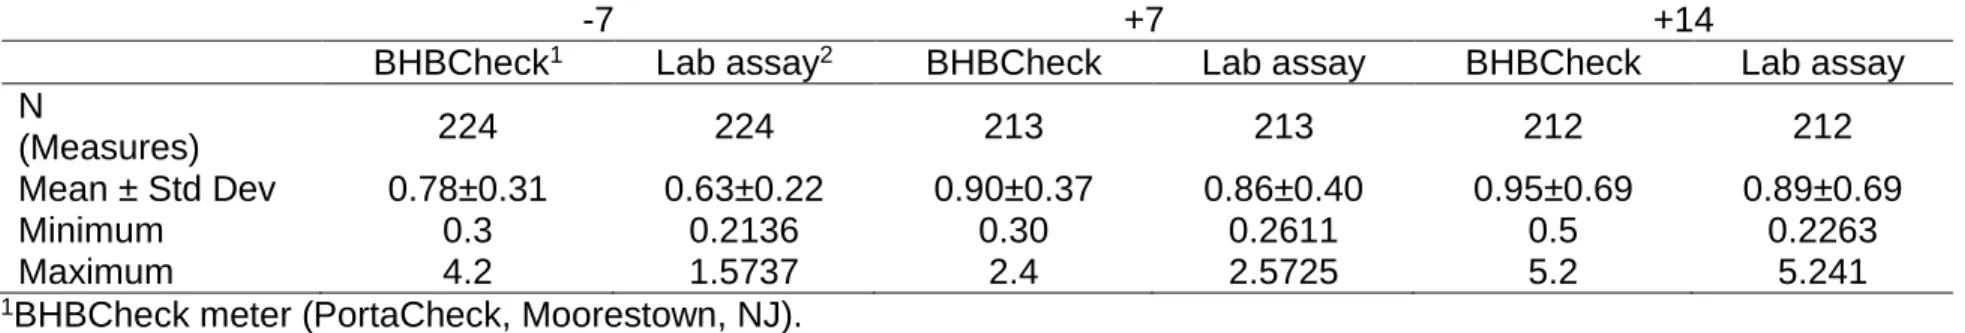
Linear regression analysis of BHBCheck compared to the laboratory task resulted in a coefficient correlation and mean square error of for cows sampled seven days) before expected calving date and for samples seven and fourteen days after calving, respectively (Figure 2). The correlation estimate (r . = 0.86) between the two BHBA measurements in the present study supports the results of the above study. Mean differences at day seven post-calving had the least bias compared to serum concentrations of BHBA with a mean difference of -0.03 mmol/L, with the most equidistant distribution of points around the mean.
The specificity of BHBCheck was acceptable and can detect HYK at individual cow and herd level. The price of the device is close to $75, and the strips needed to run it are about $3 (total cost per test).
IMPLICATIONS
These costs are usually less than the costs of sending samples to the laboratory and avoid complicated logistics and time to obtain diagnosis and treatment.
ACKNOWLEDGEMENTS
LITERATURE CITED
Linear regression of blood BHBA concentrations quantified by BHBCheck (PortaCheck, Moorestown, NJ; left panels) compared with a laboratory colorimetric assay (LiquiColor colorimetric assay; EKF Diagnostics-Stanbio, Boerne, TX) seven before and seven and fourteen days after calving. Difference between BHBA concentrations measured in the laboratory as determined in 325 samples by a colorimetric laboratory assay (LiquiColor colorimetric assay; EKF Diagnostics-Stanbio, Boerne, TX) and BHBCheck (PortaCheck, Moorestown, NJ; left axis) plotted against their mean concentrations across all experiments . Difference between BHBA concentrations measured in the laboratory determined by a colorimetric laboratory assay (LiquiColor colorimetric assay; EKF Diagnostics-Stanbio, Boerne, TX) and BHBCheck (PortaCheck, Moorestown, NJ) plotted against their mean concentrations seven days before calving.
Difference of laboratory-measured BHBA concentrations determined by colorimetric laboratory assay (LiquiColor colorimetric assay; EKF Diagnostics- Stanbio, Boerne, TX) and BHBCheck (PortaCheck, Moorestown, NJ) plotted against their mean concentrations seven days after calving. Difference between laboratory-measured BHBA concentrations determined by colorimetric laboratory assay (LiquiColor colorimetric assay; EKF Diagnostics- Stanbio, Boerne, TX) and BHBCheck (PortaCheck, Moorestown, NJ) plotted against their mean concentrations fourteen days after calving.
Abstract
Introduction
51 At the level of the cow, reductions in serum Ca2+ concentrations, increases in NEFA and BHBA have been associated with an increased risk of contracting diseases (Seifi, LeBlanc, Leslie & Duffield, 2011) and milk loss (Chapinal et al. al. , 2012). The cow-level thresholds of these metabolites were used to identify individuals at risk of damaging their health and productivity. Based on this premise, the aim of this study was to determine the serum concentrations of β-hydroxybutyrate, calcium and non-esterified fatty acids, seven days before parturition, and the relationships between them and milk losses at seven and 14 days of lactation in Holstein-Friesian cows in custody.
Materials and methods
- Study area
- Animal feeding and management
- Serum analysis
- Recording diseases
- Statistical analysis
52 30 cows per herd were sufficient to detect the prevalence of high metabolite concentrations within a confidence interval of 5 to 95% (Chapinal et al., 2011). Disease definitions were previously described by Le Blanc et al. Hierarchical dummy variables were created to examine the difference between thresholds, categorical values were 1.0 and 0, for high- and low-risk cows, respectively, based on serum concentrations of each metabolite at each sampling threshold used, previously published by Chapinal et al.
The dummy variables of MY and body condition were determined following the procedures published by López-Ordaz et al. To predict lost or unharvested MY and the possible association between metabolites and metabolic disorders, categorization of low, medium and high was used; while MY was classified as medium low (18.21 to 36.33) and high (≥ 36.33 kg d-1) and referred to as 0, -1 and 1, respectively, based on the discrete variables reported by López-Ordaz et al.
Results
Multivariate models were developed for each concentration threshold and analyzed by conditional logistic regression, including dichotomized proportions of animals in the high-risk group. The relationships between metabolites and MY and the proportion of animals at the threshold of high-risk metabolites are presented in Table 8. The proportion of animals at high risk based on blood serum BHBA concentrations is determined on day 7 after parturition (11%), while the proportion of cows with the lower concentration of Ca2+ in the blood serum was 34% on the seventh day before delivery.
The relationship between blood concentrations determined on day 7 before calving and the incidence of disorders in the first 60 days of lactation is shown in Table 9 and had a significant effect on the incidence of lameness (P. While acidosis and hypocalcemia did not differ significantly showed in incidence compared to serum levels of BHBA, Ca2+ and NEFA concentrations on day seven before and after calving (Table 10).
Discussion
In the first weeks of lactation, low concentrations of NEFA and BHBA were associated with MY losses, showing that a moderate degree of fat mobilization at the beginning of lactation may be critical to achieve high MY. Another factor involved in the onset of ketosis is the milk production level of the cows. The results observed in the present study are inconsistent with those observed by others. 2012) observed associations between Ca2+ milk yield.
Similarly, in a study of 91 freestall dairy farms in the northeastern US, Ospina et al. The results obtained in the present study regarding the levels of NEFA and laminitis are contradictory to other reports in the literature.
Conclusion
63 improve their nutritional management strategies to avoid losses in milk production or prevent the presence of metabolic disorders such as laminitis.
Aknowledgments
Literature cited
Evaluation of peripartum calcium status, energetic profile and neutrophil function in dairy cows at low or high risk of developing uterine disease. Associations of transesterified fatty acid and β-hydroxybutyrate concentrations with early lactation reproductive performance and milk production in transition dairy cattle in the northeastern United States. Association between the proportion of transition cows sampled with nonesterified fatty acids and beta-hydroxybutyrate and disease incidence, pregnancy rate and milk production at the herd level.
Association of immediate postpartum plasma calcium concentration with early lactation disease, culling, reproduction and milk production in Holstein cows. Increased concentration of ß-hydroxybutyrate in the blood affects glucose metabolism in dairy cows before and after parturition.


