I NTRODUCTION
C RISIS AND POLICY RESPONSE IN THE US AND E UROPE
- Why is the crisis taking too long to resolve?
- The debt overhang
- Fiscal restraint
- The ultra-easy monetary policy
In the recovery from the subprime crisis, average US growth barely exceeded 2 percent (table 1). In this respect, there are two major shortcomings in the policy response in both the US and the Eurozone.
S PILLOVERS TO THE G LOBAL S OUTH
- Growth in the Global South: Decoupling and recoupling
- The commodity-finance nexus
- Financial spillovers
- The global crisis and commodity prices
- International trade and trade imbalances
Growth in these economies picked up sharply in the early 2000s as both commodity prices and capital inflows began to recover rapidly from their previously low levels. There is indeed a remarkable inverse correlation between the nominal effective exchange rate of the dollar and commodity prices in the new millennium (Chart 6). The surge in capital inflows to EDEs that began in the early 2000s was the third post-war boom.
Outflows accelerated towards the end of the year due to expectations of faster normalization of monetary policy in the US. The Korean won was one of the weakest currencies in the wake of the crisis. The boom in commodity prices and capital inflows in the new millennium was not always carefully managed by commodity-dependent EDEs (Akyüz 2012).
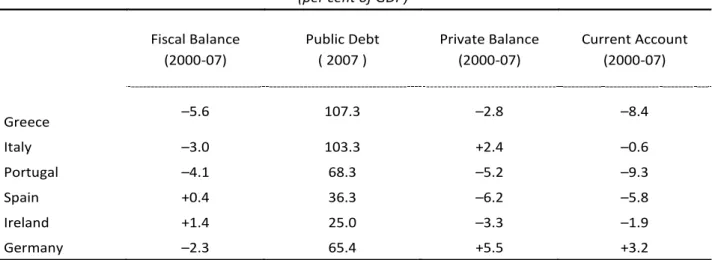
An important development in the world economy in the new millennium is a significant slowdown in world trade. Finally, there is a major shift in the external balances of the Eurozone as a result of austere policies that have been followed in response to the crisis (graph 14).
P ROSPECTS FOR GROWTH AND STABILITY
Inequality, demand gap and financial fragility
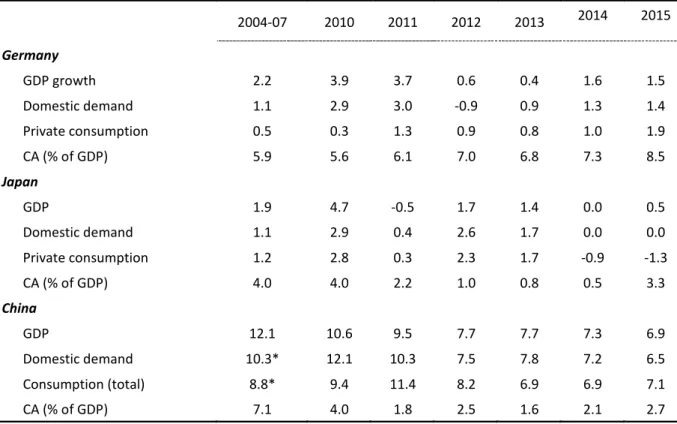
The US has done this consistently for the past three decades – first the savings and loan bubble of the 1980s, then the tech (dot-com) bubble of the 1990s, followed by the subprime bubble of the new millennium, and now zero interest. interest rate and quantitative easing bubble created in response to the subprime crisis. In the United States, the bursting of the dot-com bubble in the early 2000s was followed by a larger (subprime) bubble, and the policy response to the subprime crisis generated even more debt and greater inequality. Until the crisis, China, Germany and Japan all relied on foreign markets to close the demand gap and had GDP grow faster than domestic demand (Table 4).
However, unlike the other two, the decline in the wage share in China was associated with strong growth in real wages as well as in employment. So, for demand gap and stagnation, debt-driven bubbles are not part of the solution, but part of the problem. As a result, stagnation is likely to remain the new normal in the coming years with governments trying to reignite growth by creating credit and asset bubbles and/or trying to export unemployment through beggarly macroeconomic, labor, trade and exchange rate policies. -your-neighbour, thereby generating financial and economic instability and tension in international economic relations with significant repercussions for EDEs.
Potential spillovers from the US, Europe and China
The US incurs bilateral deficits in its trade with several countries; large and small (table 5). However, if measured as a share of total trade to account for differences in the size of the economies that trade with the United States, the differences in relative sizes of trade surpluses with the United States narrow considerably. Measured as a share of GDP to account for the demand stimulus the US provides to its trading partners, the top five countries that have trade surpluses with the US are all in the South.
This share is higher in processing exports, which constitute a very large part of Chinese exports to the United States (Akyüz 2011a). Thus, tariffs on Chinese exports to the US would hurt East Asian suppliers as well as China itself. Thus, tariffs targeting their exports to the United States will have an even greater impact on their suppliers, including in the United States, especially in the case of Mexico.

C HALLENGES AND POLICY ISSUES FOR THE G LOBAL S OUTH
Real output growth
Decoupling in the sense that the economic performance of the South has become independent of conditions in the North would be highly unlikely in the face of increasingly closer global integration of EDEs. A more fundamental question is whether there has been an upward shift in the trend (potential) growth of EDEs relative to advanced economies and a secular acceleration of convergence. It also warned that failure to make a correct assessment of the respective roles of external and domestic factors in the superior performance of EDEs could lead to complacency and increase their exposure to shocks.
The IMF eventually came to a similar view, acknowledging that potential growth in the South declined more than in the North (IMF WEO April 2015: Chapter 3). Conditions in international commodity and financial markets have played a central role in the performance of EDEs in the new millennium. When commodity prices and capital flows are reversed, a vicious cycle can ensue where declining growth in the South leads to weaker commodity prices and capital inflows which in turn further dampen growth.
Capital Flows to Emerging Economies
Commodity prices
Private capital inflows to emerging economies and commodity prices
Commodity Prices and the US Dollar
It was also helped by a significantly improved risk appetite for lending and investment in emerging economies. Although it ended with the flight to safety triggered by the Lehman collapse in September 2008, the recovery was rapid thanks to the sharp interest rate cuts and rapid monetary expansion in the US and Europe and shifts in risk perceptions towards advanced economies (Chart 3). On average, they were above pre-crisis levels, but in a downward trend due to stronger growth in the outflow of residents.
This picture began to change in 2014 amid expectations of a tightening of monetary policy in the US, as nonresident inflows fell sharply while resident outflows remained strong. This was the first decline in emerging economies' reserves in the new millennium – even at the nadir of the crisis, when inflows plummeted, emerging economies continued to replenish their international reserves. The depletion of reserves continued in 2016, not only in China, but also in many other emerging economies.
Emerging Economies Reserve Accumulation
Chinese reserves and the yuan
Since the crisis, capital flows to emerging economies have shown significant short-term instability due to uncertainties created by a series of events in advanced economies and changes in risk appetite. The May 2013 tantrum caused a rise in the 10-year Treasury bond yield and a sharp decline in capital inflows to emerging economies. The boom in 2010 led to a strong recovery in exchange rates and stock prices in most major emerging economies that had come under severe pressure in the immediate aftermath of the Lehman collapse.
As upward pressure on currencies continued, several emerging economies released inflows from hands and began to contain them, usually using market-friendly measures rather than direct restrictions. Some emerging economies, such as South Africa, have liberalized resident outflows to alleviate upward pressure on the currency. Not only did most emerging economies welcome the bubbles in asset markets, but they also ignored the growing vulnerability resulting from increased corporate borrowing abroad.
Emerging economies exchange rates
Emerging Economies Equities
The rapid growth of major commodity-importing EDUs, especially China, played a central role in the pre-crisis boom. After the outbreak of the financial crisis in advanced economies, the momentum of commodity prices was fully sustained by growth in the South, particularly in China, where the composition of imports changed from manufactured goods to commodities as a result of the shift from exports to investment in infrastructure and property. 9 Energy, which has a large weight of about 63 percent in the overall index, is subject to geopolitical risks.
It is found that the material intensity, i.e. materials consumption per dollar of GDP, much higher in the Asia-Pacific region than elsewhere in the world and increasing. They benefit from lower prices of the raw materials they import, but lose much more from reduced revenue from fuel exports. These countries, particularly metal exporters such as Chile and Peru, are also suffering from falling prices for their export commodities.
Growth of world trade and income
That's also true for some of the wealthiest Gulf oil exporters, which have typically avoided spending cuts in past downturns. After the Uruguay Round, from 1995 to 2005, world trade grew in volume terms almost twice as fast as world income, at a rate of about 7 percent per year. This has created panic in the neoliberal camp that protectionism is on the rise and globalization is stalling.
Fourth, there has been a surge in foreign investment for local markets in some countries, particularly by Chinese firms in the US, through takeovers or newly built capacity with cheap credit. Such market-seeking FDI may accelerate relative to cross-border trade in the coming years with the rise of protectionism in the US. Indeed, the evidence shows that the import content of Chinese exports has fallen from about 60 percent in the mid-1990s to about 35 percent in recent years (Koopman et al. 2012, Upward et al. 2013).
North-South Imbalances
Convergence of external imbalances: US and China
Eurozone current account
Wage Share
While there is considerable uncertainty about the benefits of these policies to the US economy, they could cause severe damage to the rest of the world. The incidence of these would depend on how they are designed and on the countries' trade ties with the US. Vietnam tops the list in terms of the surplus it generates with the US per dollar of trade, followed by China.
For example, about a third of the income loss resulting from the relocation of such companies to the US would fall on China and the rest on its suppliers and the profits of TNCs.13. The US often resorted to the currency manipulation argument by threatening its trading partners with protectionism. Many observers draw a close parallel between conditions in China today and those in the US on the eve of the subprime crisis, predicting a similar financial crisis that could jeopardize prospects for a soft landing to a lower but sustainable growth path.
Share of household total consumption in Korea and China
The G20 has been captured by the OECD and the Bretton Woods Institutions, and groupings of developing countries such as BRICS and other South-South organizations are inward-looking, moving away from global and systemic issues and global economic governance reform. However, the stakes are now becoming too high for EDEs to leave the organization of the global economy and its governance to one or two major economic powers and the multilateral institutions they control. Growth and distribution after the 2007-2008 US financial crisis: Who bore the brunt of the crisis.
Quantifying high levels of endogeneity and changes in structural regimes in commodity markets. One of the world's most brilliant Chinese minds has a warning for the second half of Business Insider, January 10. November 1, 2005 Review of sanitary and phytosanitary measures in QUAD countries for tropical fruits and vegetables imported from developing countries.
January 9, 2007 A developmental analysis of the proposed WIPO Treaty on the Protection of Broadcasting and Cable Broadcasting Organizations. May 28, 2010 The impact of the global economic crisis on the industrial development of the least developed countries.


![A Scholar's Guide to Getting Published in English. Critical Choices and Practical Strategies [Ressenya]](data:image/gif;base64,R0lGODlhAQABAIAAAP///wAAACH5BAEAAAAALAAAAAABAAEAAAICRAEAOw==)