FISCAL SUSTAINABILITY AND IMMIGRATION IN THE MADRID REGION
LUIS MIGUEL DONCEL PEDRO DURÁ PILAR GRAU-CARLES
JORGE SAINZ
FUNDACIÓN DE LAS CAJAS DE AHORROS DOCUMENTO DE TRABAJO
Nº 634/2011
De conformidad con la base quinta de la convocatoria del Programa de Estímulo a la Investigación, este trabajo ha sido sometido a eva- luación externa anónima de especialistas cualificados a fin de con- trastar su nivel técnico.
ISSN: 1988-8767
La serie DOCUMENTOS DE TRABAJO incluye avances y resultados de investigaciones dentro de los pro- gramas de la Fundación de las Cajas de Ahorros.
Las opiniones son responsabilidad de los autores.
Fiscal Sustainability and Immigration in the Madrid Region
Luis Miguel Doncel*, Pedro Durá†, Pilar Grau-Carles* and Jorge Sainz*
Abstract
The growing number of immigrants in the Madrid region raises several questions concerning the welfare of future native generations. The debates shift from increasing concern about the congestion of public services like education or healthcare, to how immigration helps to ease tension in relation to financing those services and other benefits to the region’s general welfare. In order to evaluate the global effect, our analysis uses a generational accounting method which is applied to different productivity, interest rate and growth scenarios. The results show that the impact of immigrants is positive, with intergenerational distribution towards the currently most active taxpayers.
Keywords: Generational accounting, fiscal balance, international immigration
JEL Code: F22, E62, R10
* Department of Applied Economics I, University Rey Juan Carlos, Paseo de los Artilleros s/n 28030 Madrid.
† Department of Economic Policy, University Complutense de Madrid, Campus de Somosaguas, 28040 Madrid.
1.- Introduction
In the last few years, the Madrid region has gone from having hardly any immigrants to this group representing 13.3% of the total population in 2006, and 18% in 2008. This change has given rise to a lively debate about the effect of immigration on the region from both a social and economic perspective. With regards to the latter, the aspect of interest is how the fiscal costs and benefits of immigrants are distributed between the Spanish State and the region.
The Madrid region is a relevant case study for analysing the impact of immigration. It is small in size, as it only represents 1.6% of the total surface area of Spain, although it houses approximately 14% of the Spanish population, generating 18% of the national GDP and it has a high per capita income figure, 35% above the EU- 27 average. For comparative purposes, the region’s GDP is greater than that of neighbouring Portugal. From the immigration perspective, Spain has been one of the leading countries of destination in the world in the last ten years, and the Madrid region has absorbed the largest increase in its immigrant population. The effect of immigration on public services has been one of the major issued, as irrespective of its positive impact on Social Security financing, the perception of Spanish nationals regarding saturation of the healthcare and education systems, etc., has given rise to a heated debate.
The United States was the first country to estimate the fiscal effect of immigration. Huddle (1993) estimates a negative balance of 42,500 million dollars. In contrast, it was estimated by Fix and Passel (1994), as +25,000 millions. In spite of the significance of the previous studies, it was not until 1995 when Borjas (1995), scientifically evaluated the impact as somewhere between -16,000 and +6,000 million.
Lee and Miller (1997), showed that the effect on the economy as a whole depends on
the type of immigration. The younger and more qualified the new workers are, greater
will be their fiscal contribution to the economy; this was confirmed by Storesletten (2000).
The studies conducted for Europe show some differences. In the case of Sweden, Storesletten (2003), analyses the contribution of immigrants and their use of public assets throughout their lifetimes, estimating that the present value of an immigrant is - 20,500 dollars, with young immigrants presenting a positive fiscal balance. For the United Kingdom, Gott and Johnston (2002), and for the Organisation for Economic Co- operation and Development (OECD), Coppel et al (2001), obtain a slightly positive balance, although the result depends on the immigrant profile. Coleman and Rowthorm (2004), show the existence of a slightly positive fiscal effect in the short run, which becomes uncertain in the long-term.
For Spain, Aparicio and Tormo (2000), estimate, for 1998, a positive balance of around 0.21% of the Gross Domestic Product (GDP). These figures are similar to those estimated by Dolado (2002), 0.3% of the GDP, where, unlike workers competing in the same segment, individuals with qualifications other than those of the new arrivals benefit.
Selection becomes a key aspect of the integration and evolution of new immigrants (Dolado et al, 1997 or Coppel et al, 2001). The Oficina Económica del Presidente
i(2006), estimates the fiscal contribution of immigration for 2005 as 0.5% of the GDP. Finally, Conde-Ruiz et al., (2008), obtain a higher figure, 1.25%, unequally distributed according to the number of new workers. They also show that the effect on per capita income has been zero (but negative in some regions, such as Madrid) and the impact on productivity has been negative.
One limitation of these studies is that the costs generated by immigrants
decrease as they and following generations settle and become integrated in society
(Iturbe-Ormaetxe, 2002). Furthermore, many of the previous studies only consider the positive effect of social security contributions, but not the cost of the obligations generated in the form of pensions (Boldrin et al., 1999).
These effects are estimated using generational accounting methods, proposed by Auerbach et al. (1994), and revised for Spain by Bonin et al. (2001). On a State level, Collado et al. (2004), estimate that the effect of immigrants is positive and significant, as they and following generations help to relieve the burden of the distributive pension system, although the final effect may depend on the type of immigrant. On a regional level, the effects are also different, as the public administrations have other obligations, as shown for Andalusia by García et al. (2006).
For 2005, Vicens (2006), estimated a deficit for the Madrid region ranging from 0.8%-0.55% of the GDP. This fiscal balance, however, refers solely to that year, without considering the fiscal dynamic for the following period. This is contemplated in this paper, which represents an attempt to evaluate both present and future income and expenditure generated by immigrants in the Madrid region. We use a generational accounting model which simulated three alternative immigrant input alternatives, three variations in the economy’s discount rate and another three possible evolutions of productivity. We have also simulated other scenarios which are not included here, as the main qualitative results are summarised in these scenarios.
We find that the results depend on how fiscal policy is articulated; in other
words, on how the increased public services burden is distributed among present and
future generations. We will see that the positive effects of immigration in relation to
fiscal sustainability are much clearer on scenarios which do not involve deferred
payment. Likewise, the benefits associated to immigration will also depend on the
taxpayer’s age and even sex.
Section 2 contains a brief description of the generational accounting method and our data projections and populational calculations. Sections 3 and 4 calculate, respectively, the fiscal revenues and expenditures generated by the immigrants living in the Madrid region in 2006. Subsequently, section 5 applies the generational accounting model and describes the principal results. The paper ends with some conclusions.
2.- The generational accounting model and data projections
A theoretical precedent of generational accounting is dynamic neoclassic general equilibrium models of overlapping generations. These models are appropriate for population economy issues, as they are able to integrate the life cycle hypothesis in rational intertemporal decision-making with interactions between generations, thus enabling us to study the impact of a changing demographic environment on the economy. Generational accounting sacrifices general equilibrium aspects to obtain greater applicability, focusing on the effects of demographic changes on the public budget.
Some attempts to contrast the two approaches are found in Börstinghaus and Hirte (2001); Fehr and Kotlikoff (1996); and Raffelhüschen and Risa (1997), who compare the effects which can be predicted from generational accounting models and overlapping generation models. The principal conclusion is that generational accounting does not provide a good measurement of the impact of a tax reform, although it is capable of providing good results when measuring the quality and sign of a reform’s effects for different generations.
The importance of generational accounting models lies in the fact that they are
capable of showing the net discounted value of the amounts to be paid by both present
and future generations to the public administration throughout their lifetimes (Smith and
Edmonston, 1996). They basically consist of editing an “account” for each generation which accounts, in current value, for all the public revenues and expenditures they will generate. The difference is the current net benefit (or cost) from a fiscal perspective.
The sustainability of public finance is assumed, so all the government’s budgetary constraints must be met. In current terms, the sum of all income, at equilibrium, must be equal to the sum of all expenditure plus the amount of debt in the base year. In other words:
s t
s t s tt s
t s
s
Debt
r es Expenditur r
venues
1 1
Re [1]
where r and s denote the interest rate and the year. We now distinguish between expenditure which can not be individually reassigned (Consumer spending) and transfers. The latter can be discounted by the taxes paid by each generation to obtain net revenue, expressing [1] as:
1
, 0
,
s
. .
1
spending Consumer
s
s t t N
s
s t t t
s
t t
s
Debt NetT NetT
r [2]
The expenditure discounted in consumption, in any period s, plus the amount of public debt, will be equal to the net taxes paid or received by individuals from present generations (t-s, up to N, where N is the maximum years of an individual’s life) plus the net taxes of each future generation (t+s). These calculations must be made distinguishing each individual’s sex and origin. The next taxes for a generation k, will the discounted sum of the projected mean payment to the public sector in year j by a representative individual from generation k multiplied by the number of residents in year j included in the cohort born in year k:
k N
k t j
t j
k j k
j k
t
r
t MeanPaymen Inhabit
NetT
, max
, ,
,
1
. . [3]
The generational accounts of each age are thus obtained:
k t k t k
t Inhabit account NetT
al Generation
, ,
, .
.
[4]
When the sum of the revenues is equal to consumption spending plus debt, as in [2], this would be an equilibrium scenario. If the sum of spending is greater, this would be an “unsustainable” fiscal policy scenario. In this case, two possible alternatives are contemplated which will be described in detail in section 5.
On the other hand, in order to calculate equation [2], we have to estimate prior income and expenditure and make some assumptions about their evolution. We assume that per capita spending will increase in the future at the same rate as productivity g, estimated at 1.25%. Consumption spending is thus obtained by multiplying this per capita spending by population projections. Likewise, in order to calculate mean net payments, we estimate those of the present generations in the base year (2006) and project by means of the productivity rate, correcting for population projections.
We have chosen 2006 as reference based on data availability. Unfortunately our series do not reflect the possible changes due to the global crisis that was patent in 2008.
In Spain, due to the idiosyncrasy of the economy, the effects were delayed to the last quarter of 2008 and, especially to 2009. Our results do not include those changes and we will have to wait several years to have all the data.
Before approaching the impact of immigration on the economy, we will describe the volume, origin and characteristics of the foreign population in the Madrid region, in order to highlight the importance of studying immigration in this specific part of Spain.
Madrid is the Spanish region with the relatively highest immigrant population and the
highest migratory flows in Spain. Immigrants represented 13.3% of the region’s total
population in 2006 and housed 24% of all the immigrants in Spain. Madrid is also the
Spanish region which registered highest growth in migratory flows from 2001 to 2006,
with an average annual growth rate of 45%, at a time when Spain was one of the leading
recipients of immigration, not only in Europe but on a worldwide scale. Figure 1 shows the origin of the immigrants living in the Madrid region by nationality. Practically half are from Central and South America, representing a significant difference relative to the immigrants in other EU countries. This is important, as a common language and culture help the integration process, so it is more plausible, within a few generations, to expect similar behaviour among natives and immigrants with regards, for instance, to fertility rates.
FIGURE 1.- Origins of immigration in the Madrid region
Asia 5.67%
Australia 0.05%
Apatrid
0.03% European Union
(25) 10.31%
European Non-UE 20.29%
Afric 12.51%
Central America 4.60%
North America 1.64%
South America 44.89%
Source: INE
Another sociodemographic characteristic of immigration in the Madrid region is its equality in terms of sex, with male and female immigration on practically the same level. With regards to age, most of the immigrant population is in the 14-64 age group.
Specifically in 2006, around 70% was in that group. Most immigrants, therefore, are of
a potentially active age, so they can be classified as “net contributors” to the system, at
least in the short term. Finally, a large proportion of immigrant labour is occupied in the low qualified segment, largely construction, which registered spectacular growth not only in the Madrid region but all over Spain (in those years, Spain was the country in which the construction sector represented the highest percentage of the GDP among all EU-27 countries).
With this as our starting point, our analysis includes population projections from 2006 to 2106, based on life expectancy and fertility rate estimates. The basic method used to perform population projections is that used by Hollmann et al. (2000). For the native population’s life expectancy and fertility rates we used National Statistics Institute (INE) data, and data from the US Census Bureau for the foreign population’s fertility and mortality rates. The model is contemplated in annual periods by age, sex and origin group from Statistical National Institute (INE) data.
To calculate the children born into the foreign population living in Madrid, we
consider the population of the respective sex, in the first age group of the base year in
relation to the total, weighted by the number of women of childbearing age, from 15 to
44, the survival rate and both present and future fertility rates. In the subsequent period,
we consider both the group’s migratory balance and the foreign population born in the
Madrid region. The fertility rate will vary among generations, considering that the first
will present a rate different from that of the second and third, when they become the
same. From the fourth generation, all individuals are classified as native. Finally, three
scenarios are considered in relation to the net migratory balance. They are described in
section 5.
FIGURE 2.- Evolution of the national and immigrant population as percentages of the entire population by sex in the Madrid region in 2006, 2056 and 2106 according to a mean inflow scenario
YEAR 2006
15.00 10.00 5.00 0.00 5.00 10.00 15.00
0 5 10 15 20 25 30 35 40 45 50 55 60 65 70 75 80 85 90 95
Men Women Inm. Men Inm. Women
YEAR 2006
15.00 10.00 5.00 0.00 5.00 10.00 15.00
0 5 10 15 20 25 30 35 40 45 50 55 60 65 70 75 80 85 90 95
Men Women Inm. Men Inm. Women
YEAR 2056
15.00 10.00 5.00 0.00 5.00 10.00 15.00
0 5 10 15 20 25 30 35 40 45 50 55 60 65 70 75 80 85 90 95
Men Women Inm. Men Inm. Women
YEAR 2106
15.00 10.00 5.00 0.00 5.00 10.00 15.00
0 5 10 15 20 25 30 35 40 45 50 55 60 65 70 75 80 85 90 95
Men Women Inm. Men Inm. Women
Source: the author
Figure 2 shows the evolution of the national and immigrant populations as a percentage of the total by sex. As Figure 2 shows, the immigrant population pyramid presents the most numerous cohorts in precisely the same strata as the native population, from age 20 to 40, although the mean age of the immigrant population is slightly lower, around 30, while that of the native population is about 36. The migratory process will help to mitigate the gradual ageing of the population.
One of the main consequences of the new populational structure, on a nationwide scale, is the Social Security superavit generated in the short term, evaluated at the end of 2007 as 1.34% of the GDP, when pensions represented 8.7%. Of the 18.7 million Social Security contributors, 10.1% are immigrants, so the contributor/pensioner ratio is around 2.5.
This situation, however, may change dramatically in the next few decades. For example, expectations for 2050 show that pension expenditure will be 20% of the GDP (Dolado and Vázquez, 2008). Thanks to the evaluation of generational accounting models, we can estimate the real net contribution of immigration.
3. Revenues
The data for fiscal revenues used in our calculations for the generational
accounts comes, in the aggregate, from the Budget of the Regional Government, from
the Social Security Treasury (see Table1). One of the characteristics of the quasi federal
fiscal system in Spain that adds some difficulties to the estimation, is that some taxes
are shared with the National Government such as Direct Income taxes (IRPF), Value
Added Tax (IVA) while other special indirect taxes on housing (IAJD and ITP) are the
exclusive competence of the region. On the other hand, other fiscal revenues, like Social
Security contributions, are exclusively managed by the National Government.
Under these circumstances we have adopted the strategy shown in García et al., 2006. We have chosen three categories of taxes, direct taxes (mainly income and corporate), indirect taxes (value added, tobacco, housing, etc) and, finally, Social Security contributions. To estimate the contribution for each of the profiles by sex, age and nationality we have used the European Community Household Panel (ECHP), a survey based on a standardised questionnaire that involves annual interviewing of a representative panel of households and individuals in each country, covering a wide range of topics: income, health, education, housing, demographics and employment characteristic, etc. Although the Panel we use started in 1997 and ended in 2001, it is the closest approximation to the fiscal behaviour of families that it is available. The data is complemented with the Household Budget Survey (HBS), which allows obtaining the profiles of taxes paid by natives and immigrants on the base year from the specific microdata, adjusting by the total number on the sample and by the difference between the estimations and the budgetary numbers.
TABLE 1.- Aggregate Revenues in the Madrid Region, 2006
(millions of €)
Type of tax Total Immigrants Percentage Personal Income tax 4,562 49.8 1.09%
VAT 3,094 431.1 13.93%
Social Security contributions 15,056 842.5 5.60%
Tax on documented legal acts 1,438 2.3 0.16%
Property Transfer tax 1,895 122.4 6.46%
Total 26,045 1479.7 5.68%
Source: Madrid region budget for 2006, Social Security administration and the author
The consumption behaviour is derived from the HBS, which shows the spending
in the different groups of goods, assuming equally spending for each family member
(immigrant and native) and applying the tax rate for each case. The results show that native families have a lower saving rate, while immigrants expending is concentrated on basic goods.
TABLE 2.- Taxes paid by immigrants in Madrid Region by area of activity
2006 Withheld Rebates Tax revenue
Agriculture 1,565,796 1,330,927 234,869
Industry 9,603,115 8,162,647 1,440,467
Construction 104,393,339 88,734,339 15,659,001
Services 127,806,115 108,635,198 19,170,917
Self-employed 52,429,225 44,564,842 7,864,384
Domestic 33,858,254 28,779,516 5,078,738
Others 2,017,828 1,715,154 302,674
Total 331,673,673 281,922,622 49,751,051 Source: CNA· 93, Social Security, Annual Salary Structure Survey, Active Population Survey, European Community
Household Panel (ECHP) and the author
For fixed income taxes and Social Security contributions we establish the
profiles of the individuals by using ECHP Panel, which gives a detailed account of the
net revenues of the family members age 16 and above. To obtain the gross data we use
the tables from both the revenue service and the social security treasury. To adjust
immigrants to nationals working households, and following García et al. (2006); and
Collado et al. (2004), we apply a 75% reduction on the income of immigrant households
with respect to those of native similar situation. To obtain the aggregate numbers we
adjust those data by the occupation rate for each sector obtained from the Economically
Active Population Survey (EAPS), which allows estimating the figures for active and
non active natives and immigrants.
TABLE 3.- Taxes paid by immigrants in the Madrid region by expenditure item
2006
Consumption structure
Annual individual expenditure
Total individual expenditure
VAT
Food and non-alcoholic beverages 24.5% 1,117 851,407,631 51,084,458 Alcoholic beverages, tobacco and narcotics 4.0% 182 139,005,328 22,240,852 Articles of clothing and footwear 5.1% 233 177,780,361 28,444,858 Housing, water, electricity and other fuels 31.8% 1449 1,105,092,354 176,814,777 Furnishing, household equipment and housing
expenses 2.5% 114 86,878,330 13,900,533 Health 1.2% 55 41,701,598 6,672,256 Transport 8.5% 387 295,386,321 47,261,811 Communications 5.8% 264 201,557,725 32,249,236
Leisure and culture 3.1% 141 107,729,129 4,309,165
Education 0.4% 18 13,900,533 - Hotels, cafés and restaurants 7.8% 357 272,306,361 19,061,445
Other goods and services 5.2% 238 181,519,182 29,043,069 Total 100.0% 4556 3,474,264,853 431,082,460
Source: Continuous Household Budget Survey, European Community Household Panel (ECHP), Ministry of Agriculture, Vicens (2006) and the author
The main results of these estimations can be seen on Table 1, 2 and 3, which show the relevance of indirect taxes over direct taxes, especially for Madrid. Another interesting issue is the weight of Social Security contributions with respect to Income taxes. This effect is due to fact that most of immigrants salaries are below the minimum requirements, being exempt of payment, while Social Security is paid by all employees.
Another interesting issue is the high rate of employment on females, but the strong
concentration on household services, that have low Social Security contributions and
are usually below the cited taxing limit.
4.- Expenditures
The aggregate expenditure figures are taken from the Madrid region’s 2006 budget which is shown in the first column of Table 4. There are two exception, Healthcare and Education expenditures, which are, not only the two major items — representing nearly 63% of the region’s total spending — but also present strongly age- dependent profiles. These two items are therefore of key importance for our objective, and they are each considered in a specific section, in which we explain how we have allocated expenditure by age profile.
TABLE 4.- Aggregate Expenditure of the Madrid region (millions of €)
2006 2006
Budget
Direct immig.
expend.
% of total
Immig.
expend.
% of/
total
Nationals expend.
% of total
AGGREGATE EXPENDITURE
Health and consumer
affairs 6,067.9 545.6 7.83 6,420.9 92.17 6,966.5
Education 4,334.2 401.3 10.26 3,508.7 89.74 3,910.0
Family and social affairs 965.1 13.2 1.4 13.2 1.37 951.9 98.63 965.1 Immigration 70.8 33.8 47.7 33.8 47.68 37.0 52.32 70.8 Justice and Interior 515.6 26.9 5.2 26.9 5.22 488.7 94.78 515.6 Culture and Sport 288.0 1.6 0.5 1.6 0.54 286.4 99.46 288.0 Transp. and
infrastructures 1,549.6 206.46 13.32 1,343.1 86.68 1549.5 Economy Technology
and Innovation. 277.5 36.97 13.32 240.5 86.68 277.5 Employment and women 593.7 31.6 5.3 31.6 5.33 562.1 94.67 593.7 Environment 738.7 14.6 2.0 14.6 1.98 724.1 98.02 738.7 Presidency 229.1 30.52 13.32 198.6 86.68 229.1 Public finance 294.5 39.24 13.32 255.3 86.68 294.5 Public debt 492.6 65.63 13.32 426.9 86.68 492.6
Others 159.0 21.18 13.32 137.8 86.68 159.0
TOTAL 16,576.1 1,468.5 8,61 15,581.9 91.39 17,050.4
Source: 2006 Madrid Region Budget, Vicens(2006) and the author
The last column of Table 4 shows the aggregate expenditure figures we have used for our generational accounts model. As you can see, all the figures are the same as in the budget except Healthcare and Education.
Table 4 also shows aggregate expenditure, distinguishing between immigrants and Spanish nationals. In Healthcare and Education, the criteria used will be described in detail later. For the other items, we have used estimates of direct spending on the immigrant population whenever they were available and, when not, for the immigrant population we estimated expenditure in proportion to their percentage of the total population in 2006 (13.32%). In these items, in order to allocate aggregate expenditure to age profiles, we applied a proportional criterion, using the age pyramids for immigrants and Spanish nationals.
We can see that the total expenditure assigned to the immigrant population in 2006 was 1,468.5 million euros, 8.61% of the total. This is lower than the percentage represented by immigrants in the total population, largely due to the fact that their healthcare expenditure is less than that of the national population due to their lower age profile.
4.1.-Allocation of healthcare spending by age profile
In order to allocate healthcare spending by age group among the immigrant and native populations, we used the calculations found in Vicens, 2006, with some adjustments. This study estimates per capita healthcare spending in 2005 according to age in three major healthcare items: specialised care, primary care and public health.
We assume that there are no significant differences between the healthcare spending of
a Spanish national and immigrant of the same age. Vicens, 2006, refers to different empirical studies to justify this assumption; also see Regidor, 2008.
TABLE 5.- Healthcare exp. by age p.c. (€)
2005 2006
age Speci
alist Primary
care Public health
Special ist
Primary care
Pub.
heal. Rest Total
p.c.
0-4 42 507 89 43.1 520.7 91.4 127.1 782.3
5-14
15 245 5 15.4 251.6 5.1 127.1 399.3 15-24
67 206 5 68.8 211.6 5.1 127.1 412.6 25-34
193 198 6 198.2 203.3 6.2 127.1 534.8 35-44
218 234 8 223.9 240.3 8.2 127.1 599.5 45-54
723 316 10 742.5 324.5 10.3 127.1 1.204.4 55-64
895 439 23 919.2 450.9 23.6 127.1 1,520.7 65-74
1851 659 60 1,901.0 676.8 61.6 127.1 2,766.5 75 y +
3370 759 65 3,461.0 779.5 66.8 127.1 4,434.3 total
644.6 339.7 20.9 662.0 348.9 21.5 127.1 1,159.5
weighted means
Source: for 2005 Vicens (2006), rest the author
We have made two adjustments to the results obtained. The first is simply a CPI
update to the year 2006. The other adjustment consists of adding a residual item which
proportionally allocates the Department of Health spending not included in the previous
items. The results of these adjustments are also shown in Table 5. Figure 3 shows total
per capita healthcare spending by age group. We see that it is J-shaped, meaning that,
except for the first part, healthcare spending tends to increase with age. Note large
differences according to age, as such spending can be multiplied by more than ten within an individual’s lifetime (from less than 400€ in the 5-14 age group and more than 4,400€ for the over-75s).
FIGURE 3.- Healthcare expenditure per capita (€)
782,32
399,25
412,60 534,82
599,52
1.204,42
1.520,74
2.766,49 4.434,34
0 500 1000 1500 2000 2500 3000 3500 4000 4500 5000
0‐4 5‐14 15‐24 25‐34 35‐44 45‐54 55‐64 65‐74 75 y +
( €)
age groups
Source: the author
4.2 Allocation of education expenditure by age profile
Education is the other major item in the Madrid region budget which has also an age- related spending profile.
With regards to public spending on non-university education, we again
make use of the important study conducted by Vicens, 2006, which estimated
expenditure by student for each non-university level. Due to the lack of statistical data,
these figures are estimated assuming that “on each educational level … an immigrant pupil … represents the same expenditure as a non-immigrant pupil” (Vicens, 2006, pp.
197). This is not the case, however, when calculating the cost of mean grants per pupil.
Given the lower mean income of immigrant families, grant costs per immigrant pupil are considerably higher. When the two concepts are added together, we find that the mean cost per immigrant pupil is higher.
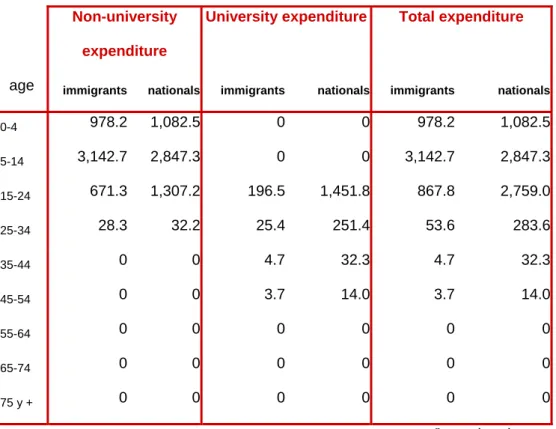
TABLE 6.- Per capita expenditure on education (€)
Non-university expenditure
University expenditure Total expenditure
age immigrants nationals immigrants nationals immigrants nationals
0-4 978.2 1,082.5 0 0 978.2 1,082.5
5-14 3,142.7 2,847.3 0 0 3,142.7 2,847.3
15-24 671.3 1,307.2 196.5 1,451.8 867.8 2,759.0
25-34 28.3 32.2 25.4 251.4 53.6 283.6
35-44 0 0 4.7 32.3 4.7 32.3
45-54 0 0 3.7 14.0 3.7 14.0
55-64 0 0 0 0 0 0
65-74 0 0 0 0 0 0
75 y + 0 0 0 0 0 0
Source: the author
We now have to allocate educational spending by age group and between
Spanish nationals and immigrants, using information about pupils registered at public
and publicly-subsidised schools provided by the Regional Ministry of Education for
each educational level in the 2005/2006 academic year. This information, however, is
not broken down by age, so we have to make use of the pupil distribution by age
statistics estimated by the (INE).
The result is shown on Table 6, where we can see that in all age groups except 5- 14, mean per capita expenditure for immigrants is less than for nationals, as less of the former are registered for non-compulsory education. The opposite is true in the 5-14 age group (which includes most compulsory education). There are two possible explanations for this: a) spending per foreign pupil is greater because of the grant effect (due to a lower mean income), and b) a higher percentage of the native population attends private schools.
In order to allocate university-level public spending, we have considered a
homogeneous distribution among university students, irrespective of whether they are nationals or foreign. If we divide total university and research spending among the number of students registered at public university in 2005/2006, we obtain mean spending per student (5,673€). The INE student distribution by age statistics were used to distribute this figure by age group. However, as no distinction is made between national and foreign students, we assume that the total percentage of immigrant university students is the same for all ages.
With this information, we allocated public spending on university education by age group, which is also shown in Table 6. In this case, the significant differences in per capita spending in favour of the national population would be explained by the enormous differences in the percentage of each population attending university.
Finally, when we add non-university and university expenditure together, we
obtain the distribution of total public spending on education by age group. It can be
found in the last column of Table 6 and on Figure 4. We see how the per capita
spending on education generated by Spanish nationals is greater on all non-compulsory
levels.
FIGURE 4.- Total per capita expenditure on education (€)
0 500 1000 1500 2000 2500 3000 3500
0‐4 5‐14 15‐24 25‐34 35‐44 45‐54 55‐64 65‐74 75 y +
( €)
age groups
immigrants nationals
Source: the author
4.3.- Allocation of total expenditure by age profile
In items other than Education and Healthcare, we have distributed spending
homogeneously among the entire population, without distinguishing age. If we add
Education and Healthcare to the other items, we obtain total per capita spending by
age group, as shown on Table 7 and Figure 5. We see how the public spending by age
profile (except for the first part) is U-shaped, as the greatest spending on the young goes
on Education, whereas the older population has more healthcare costs. The “middle-
aged” population represents a minimal cost in these areas (education and healthcare).
TABLE 7.- Total p.c. expenditure (€) Immig. nationals
0-4 1,847.4 1,951.6 5-14 3,628.8 3,333.4 15-24 1,367.3 3,258.4 25-34 675.3 905.2 35-44 691.1 718.6 45-54 1,295.0 1,305.3 55-64 1,607.6 1,607.6 65-74 2,853.3 2,853.3 75 y + 4,521.2 4,521.2
Source: the author.
On the other hand, according to the Bank of Spain, the Madrid regions current debt totalled 10,060 million euros in December, 2006.
FIGURE 5.- Total per capita expenditure (€)
0 500 1000 1500 2000 2500 3000 3500 4000 4500 5000
0‐4 5‐14 15‐24 25‐34 35‐44 45‐54 55‐64 65‐74 75 y +
( €)
age groups
immigrants nationals
Source: the author
5.- Results
Our analysis considers three scenarios
iiregarding the migratory balance in the Madrid region: a) Mean immigrant inflow scenario: it would be the best approximation to the migratory flows experienced to date in the region and establishes a gradual decrease in the migratory balance, which in 2005-2010 will be only 70% of the 2005 figure. Annual arrivals would register a mean of close to 98,000 people; in 2010-2015 the figure will be 60% that of the previous five years, and zero for the other periods; b) No immigration scenario: borders are closed after 2006; c) Low immigrant
inflow scenario: it would represent a somewhat faster reduction in the net migratorybalance than the mean inflow scenario, due to economic or social phenomena, and the net migratory balance in 2005-2010 would be 40% that of 2005 (in figures, there would be close to 60,000 new immigrants), falling to 20% in the next five years, and then to zero.
We analysed two fiscal policy alternatives for each scenario. With the first, the
burden of possible fiscal disequilibrium falls completely on future generations,
previously described as an “irresponsible” fiscal policy”; the second alternative assumes
that adjustments are made for all generations (“responsible” fiscal policy). We also
assumed (although we subsequently performed a sensitivity analysis) that mean
productivity growth is around 1.25% and that the interest rate is 5%. By including the
productivity rate in our population projections together with income estimations, we
obtain the generational accounts for the generations living in the base year. Once the
present value of public consumption, debt and the accounts for the living generations
has been estimated, we obtain the accounts for future generations as a residual.
The above data is included in the calculation of the profiles related to payments and revenues by age and sex, obtaining the mean per capita spending and income for each group in the base year. By multiplying mean spending by the number of individuals in the group’s population, we would, in theory, obtain the total amount of taxes or transfers received by the group. Future profiles are established with per capita income and spending projections, considering that they expand at the same rate as productivity, as we assume that salaries and productivity grow at the same rate in the long-run in the presence of competitive markets. Finally, all individual profiles are normalised relative to the profile of a representative, 40-year old male.
Tables 8, 9 and 10 summarise the different generational accounting results for all three scenarios. The first two columns show the first fiscal policy alternative, when adjustment is transferred to future generations, and the last two consider that payment is made by all generations. Positive values show that the generation in question, at current values, will pay more than it receives in its lifetime, with negative values showing the opposite.
Table 8 shows the results for the mean inflow scenario. The accounts shown on
the table correspond to a typical life cycle model. They grow in childhood (they are less
negative or more positive) and youth and peak at around the age of 25. They then start
to decrease, with the lowest values found among older generations, due to greater
healthcare costs. Specifically, there would only be positive values among men aged
from 25-35. This is because this population group has minimal educational and
healthcare costs, whereas their tax contributions are considerable. For other generations
and women, the present net value of payments is negative. The significant differences
between male and female accounts are largely due to the latter’s relatively low
participation in the labour market. They are net demanders of transfers in all generations, and their values are always higher (in absolute terms) than those of men.
TABLE 8.- Generational accounts, a) mean inflow scenario (g=1.25%, r=5%)
Base year=2006 All burden on future generations Immediate change
Age Men Women Men Women
0 -46219.06 -60326.13 -8554.6 -21928.46 5 -40105.45 -55878.73 893.98 -14732.21 10 -26968.02 -47607.38 19191.64 -315.7 15 -12130.09 -37909.85 41142.2 16156.23 20 -1105.99 -30524.56 53927.7 24326.92 25 8046.75 -19592.99 55180.03 26549 30 4523.16 -20874.36 45435.69 19559.01 35 1317.01 -25203.14 40574.31 14394.37 40 -4544.56 -29237.86 30031.57 5941.39 45 -11319.93 -35727.2 20604.99 -2482.71 50 -20541.1 -42923.38 8534.89 -11889.97 55 -26785.68 -46672.76 -3514.12 -19901.35 60 -34264.19 -50093.33 -15453.07 -26553.14 65 -52038.65 -73397.13 -30114.98 -43511.18 70 -36273.81 -55456.83 -22504.88 -34959.7 75 -33701.23 -56100.42 -21908.02 -37096.9 80 -29667.31 -55089.83 -19851.41 -37673.3 85 -30643.99 -53993.25 -21377.9 -37561.72 90 -27867.26 -42679.38 -16431.09 -27163.83 95 -23526.63 -34385.77 -6393.83 -16700.77 Generation born in 2007 30280.98 16836.02 -7953.53 -20886.61
% change in net taxes 49.19 17.35
Source: the author
The figure under the “Generation born in 2007” heading represents the present
value of the average net fiscal burden supported by an individual born in that year
throughout his lifetime, assuming that the following generations pay that amount
adjusted for productivity. We can thus compare the net taxes of an individual from the generation born in 2006 and another born a year later. On Table 8, the taxes paid by a man born in 2007 would be 30,280 € in net terms, while one born a year earlier would receive 46,219 €. There is therefore disequilibrium between present and future generations, showing that the disequilibrium in public accounts is transferred to the future. The case for women is similar, as they also go from being net recipients of public funds to being net contributors.
The last row on the table represents the percentage difference in the shift from taxes to transfers between the generation of zero age in the base year and the future generation. In this case, the accounts (increase in taxes and reduction of transfers) for someone born in 2007 are 49.19% greater than for someone born in 2006. At this point, it is interesting to note the differences caused by the application of the two fiscal policies. With the “irresponsible” policy, a man born in 2007 would have to bear a fiscal burden more than 75,000 € greater in his lifetime than one born in 2006. With a
“responsible” fiscal policy, however, the additional tax burden would only be 600 € in his lifetime, relative to man born a year earlier.
It is interesting to find that not only are there more generations of men for whom
the present value of payments would be positive (from 5 to 50), but there would also be
some generations of women (from 15 to 40) who would have positive payments. In this
scenario, we can see how the burden on future generations is substantially reduced. This
reveals the important generational inequity that the current fiscal system is producing
for future generations, as most of the fiscal budget deficit is being transferred to the
future. Most of this deficit appears to be associated to the healthcare and educational
systems, according to the cost structure used in the region’s budget. The demographic
structure of the Madrid population, would lead to the smallest generations being net
payers. In order to correct this disequilibrium, the tax increase and reduction in transfers for the first of the future generations is calculated at 17.35%, a third of the previous.
TABLE 9.- Generational accounts, b) no immigration scenario (g=1.25%, r=5%)
Base year=2006 All burden on future generations Immediate change
Age Men Women Men Women
0 -46632.22 -61319.13 -7647.26 -21851.47 5 -39842.07 -56106.09 1939.28 -14424.21 10 -25881.26 -45889.62 18958.84 -553.3 15 -11177.6 -34204.25 37100.56 13985.38 20 -480.56 -26503.9 48054.24 21845.68 25 9446.6 -16854.64 53103.6 26525.71 30 6371.56 -19290.48 46453.69 20844
35 3253.08 -24265.19 42906.76 15958.69 40 -3095.82 -29092.61 32505 7118.54 45 -10653.52 -36516.3 22659.66 -1924.13 50 -21037.37 -44776.54 9572.77 -12208.77 55 -28367.77 -49326.06 -3787.68 -21066.83 60 -36490.89 -53223.05 -16588.04 -28289.24 65 -55110.34 -77938.86 -31963.08 -46298.25 70 -38195.66 -58886.41 -23761.64 -37225 75 -35331.82 -59481.75 -23045.37 -39448.97 80 -30983.68 -58071.1 -20806.99 -39794.09 85 -31798.3 -56470.15 -22172.73 -39232.7 90 -28694.6 -44245.92 -16840.06 -28068.88 95 -23920.96 -35202.99 -6423.68 -17076.29 Generation born in 2007 33044.54 18290.95 -7163.36 -21063,47
% change in net taxes 48.21 16.8
Source: the author
The results for the no immigration scenario are shown on Table 9. We can clearly see
the effect of immigration and comparisons with other population scenarios. When we
assume that the entire burden is transferred to future generations (first two columns), we find that the same generations are net recipients and payers as with the mean inflow scenario. The generational accounts continue to result in a large deficit, transferring the burden to future generations. The payment to be made by the generation born in 2007, however, if there were no immigration, would be greater, 33,044 € for men and 18,290
€ for women, in both cases higher than the figures of the previous immigration scenario, where they were 30,280 € and 16,836 €, respectively. This means that the migratory phenomenon would represent a 9.1% reduction in net payments for men and 8.6% for women. Indeed, the present generations of net payers (men aged from 25 to 35) contribute more in the case of no immigration (9,446 €; 6,371 €; 3,253 €) and the transfers received by younger generations would be lower than with a mean inflow (8,046 €; 4,523 €; 1,317 €). This result is nearly always found for men, but is less homogeneous for women. This phenomenon could be associated to the lower activity rate of immigrant females relative to males, leading to an increase in social spending in relation to income. Then, we can say that immigration helps to reduce budgetary disequilibrium if payments from men are greater than those from women.
The results are somewhat different with the second fiscal policy alternative (last
two columns of Table 9). The negative net balance of the generation born in 2007 is
reduced for men and increased for women. The reason for the difference is that most of
the burden falls on present generations. The immigrants of future generations will be
recent arrivals, whereas the present generations include old and new members. The
fiscal contribution of new immigrants is therefore more important for future
generations. Their mean contribution is smaller with the second fiscal policy alternative,
so the elimination of immigration has a less unfavourable impact on an immediate fiscal
adjustment scenario, where each immigrant’s net contribution is negative.
TABLE 10.- Generational accounts, d) low inflow scenario (g=1.25%, r=5%)
Base year=2006 All burden on future generations Immediate change
Age Men Women Men Women
0 -46414.76 -60828.27 -8076.43 -21874.3
5 -39879.69 -55858.36 1402.38 -14556.74
10 -26367.67 -46532.73 18853.24 -544.95
15 -11654.39 -35827.46 38689.04 14862.62
20 -796.85 -28396.04 50705.13 22987.06
25 8784.35 -18191.16 54127.75 26554.52
30 5464.23 -20077.56 45965.07 20200.9
35 2279.41 -24737.17 41735.57 15156.7
40 -3843.72 -29176.78 31237.68 6502.54
45 -11025.16 -36142.69 21580.37 -2238.96
50 -20832.86 -43871.04 8988.47 -12086.39
55 -27604.31 -48005.53 -3707.13 -20510.33
60 -35366.85 -51648.78 -16033.75 -27429.71
65 -53526.01 -75640.62 -31021.51 -44901.7
70 -37194.41 -57146.7 -23116.18 -36087.05
75 -34472.78 -57750.57 -22456.55 -38256.22
80 -30280.68 -56520.96 -20305.42 -38699.52
85 -31166.45 -55153.02 -21739.73 -38343.93
90 -28228.31 -43385.82 -16614.8 -27577.29
95 -23686.78 -34728.92 -6429.85 -16886.48
Generation born in 2007 31644.13 17548.22 -7530.49 -20944.86
% change in net taxes 48.6 17.1
Source: the author
Finally, with the low inflow scenario (Table 10) and the first fiscal policy, there
is a 4.5% greater burden for the males of future generations and 4.2% for the females,
while the second alternative leads to a 5.3% reduction for men and an insignificant reduction for women, all relative to the mean inflow scenario. This shows the same process as we found earlier with the case of no immigration.
Tables 8 to 10 show how immigration helps to reduce the tax burden of different generations if the deficit-reducing fiscal policy is transferred to the future. This is because most immigrants arrive at a working age, so they are net payers for some years, helping to reduce part of the current deficit, which is not transferred to the future. In the case of an immediate change in fiscal policy, however, we see that the positive effects of immigration are found precisely in the generations where the migratory phenomenon is larger, in the 0-10 age group for both men and women, and 25-30 to 50-55 for men and 25-30 to 45-50 for women. In all these cases, a larger population inflow means that tax payments are reduced in per capita terms, while the opposite is true for other generations, where the migratory phenomenon is less widespread.
Given the model’s assumptions, it appears that immigration would help to reduce generational fiscal disequilibria, as it would diminish the net tax burden on middle-aged men and women, thus leading to intergenerational redistribution.
In any event, the impact not only depends on the evolution of global fiscal policy
in the next few years, but the scope of scenarios considered is limited by different
assumptions that we have necessarily had to make. They include assumptions regarding
aspects as important as the continuity of healthcare and educational policies in the time
period contemplated, the type and age profile of future immigrants, the evolution of
interest rates (this is of vital importance given the significant differences between
present and future income and expenditure), the evolution of the economy’s
productivity, etc.
These variables have been classified as exogenous, although they are only so up to a point, as they are significantly interrelated to migratory flows. For example, the arrival of immigrants will, in different ways, influence the evolution of productivity, and even the viability of some productive sectors. At the same time, however, the type of immigrants that could arrive will be influenced by the demand derived from the growth of the most dynamic sectors. In this respect, we should highlight the flexibility in labour matters derived from immigrants, as according to the 2007 Active Population Survey, immigrant mobility is 4 times greater than that of the national population, 11.8% versus 3.1%. Furthermore, this mobility is not only horizontal but also vertical, as at the same time 41.7% of the foreigners who had entered the economy on the lowest rung, had been promoted to better qualified positions shortly after joining the labour market. This factor is of key importance for the Spanish economy to become more competitive, as it is highly constrained by a rigid labour market, European Commission (2007).
Another example of these interrelations can be found in relation to healthcare of educational services, which will be better financed by the contributions of new immigrants if they are young and active. However, if these active immigrants are accompanied by children of school age or their dependent parents, social services could be overloaded and require a reform. In turn, the generosity of these services and their access conditions could represent an incentive for certain kinds of immigration.
These remarks aim to show the complexity of an analysis of the financial impact
of immigration and the need to go beyond the contemplated scenarios. As a first step,
we now perform a sensitivity analysis of the results of our scenarios, although it is
limited to the interest rate and evolution of productivity variables.
In order to analyse the model’s sensitivity, calculations were made for the different scenarios with different interest and productivity growth rates. The impact of interest rates on the percentage change in taxes and transfers is clear, as it increases as interest rates grow. This effect is much greater with a policy involving deferring payment to future generations. This would appear to be the cause of the deficit currently affecting the system. An immediate policy change would partially solve this problem, whereas fiscal policy deferrals would create a greater financial burden on future generations. With regards to the alternative productivity growth scenarios, the effect is of little significance. At this point, we should mention that migratory flows and different productivity scenarios are closely linked, as in long periods of recession inflows will be significantly reduced, as we are now seeing. Moreover, although it appears to be clear that the arrival of large numbers of immigrants reduces the economy’s labour productivity rate in the short term by reducing its capital-labour ratio, in the long run this effect could be compensated by greater mobility and its effect on occupational flexibility or the movement of more qualified workers to other economic sectors. More highly qualified immigrants in qualified jobs could help to improve the fiscal system substantially, as suggested by Storesletten (2000) for the United States and Gott and Johnston (2002) for the United Kingdom.
Finally, Table 11 compares the burden supported by the newborns of two generations with the different scenarios. The analysis with 3% and 7% interest rates (which is not included) provides the same qualitative results.
With the first fiscal policy we see that, in most cases, the burden is reduced as new immigrants arrive. A male born in 2007 would see his tax burden increased by 5%
when going from no immigration to a mean inflow scenario if the economic growth rate
is 0.75% whereas, if the economy grows by 2%, he would benefit from an accumulated
8% tax burden reduction. With interest rates of 3% and 7% there would also be gains of around 8%. Immigration would therefore help to reduce the burden of future generations. In contrast, if fiscal policy is immediately adjusted, the positive impact of immigration depends to a great extent on sex, as it is much more beneficial for men. In this case, men register much more variable and important gains when interest rates are lower and there is a shift from a no immigration to a mean inflow scenario. With a mean economic growth rate of 1.25%, these gains are 15% for a 3% interest rate, 6.3% for a 5% rate and only 0.2% for a 7% rate. For women, the variability of the figures is much more moderate, with gains of around
2 % .
As we mentioned earlier, the use of 2006 as our base year does not take the consequences of the current economic crisis into account, as its severest effects started to be felt in the last quarter of 2008. Pending the availability of regional figures, immigration in Spain slowed down considerably, with a reduction in both new immigrants with job contracts, 10,000 in 2009 versus 136,000 in 2008, and in illegal immigrants, estimated as 7,000 in 2009 versus 14,000 in 2008. For 2010, immigration numbers have been reduced to 80% those of the previous year, with priority given to highly qualified groups. This means that the scenario closer to the figures for this year will be that considering a low immigrant inflow. .
However, one of the factors resulting from the crisis which the model does not
consider is its effect on the labour market. To date, the crisis has led to the loss of
300,000 immigrant jobs, from a total of 3,500,000 million. Most of the jobs lost in the
Spanish economy in 2009 were temporary contracts associated to the construction and
service sectors. These sectors represent most immigrant labour and are also where their
jobs are more temporary than their national counterparts, as they only recently joined
the labour market.
TABLE 11.- Burden on newborns and future generations with different assumptions
Interest rate 5% 5% 5%
Productivity growth rate 1.25% 0.75% 2%
Men Women Men Women Men Women Payments future generations
a) Mean inflow
Generation born in 2006
-46219.06 -60326.13 -42816.3 -54683.95 -52803.31 -71523.79
Generation born in 2007
30280.98 16836.02 29928.21 16653.2 35253.86 18502
b) No immigration
Generation born in 2006
-46632.22 -61319.13 -43235.84 -55609.97 -53209.23 -72645.62
Generation born in 2007
33044.54 18290.95 28455.52 15599.32 38272.46 19942.3
d) Low inflow
Generation born in 2006
-46414.76 -60828.27 -43013.89 -55149.45 -52998.1 -72096.78
Generation born in 2007
31644.13 17548.22 27182.92 14905.95 36745.92 19208.17
Immediate change
a) Mean inflow
Generation born in 2006
-8554.6 -21928.46 -11365.82 -21929.47 -3258.79 -20565.98
Generation born in 2007
-7953.53 -20886.61 -10687.61 -21671.2 -2807.91 -19554.49
b) No immigration
Generation born in 2006
-7647.26 -21851.47 -10629.72 -22701.03 -2061.79 -20432.72
Generation born in 2007
-7163.36 -21063.47 -10096.78 -21907.26 -1674.88 -19657.89
d) Low inflow
Generation born in 2006
-8076.43 -21874.3 -10973.5 -22698.68 -2635.66 -20485.18
Generation born in 2007
-7530.49