Projections are generated under various assumptions about factors considered as drivers of the global fish markets. However, aquaculture is expected to supply over 60 percent of fish destined for direct human consumption.
Introduction
- Motivations and Objective
- Lessons from Fish to 2020
- Strategy of Improving Modeling Framework in Fish to 2030
- Policy Research Questions
Fish consumption per per capita in the Africa region is about half the global average (FAO 2012). In the new version of IMPACT, the production and utilization of fishmeal and fish oil is explicitly modelled.
Preparing IMPACT Model for Fish to 2030
Basics of IMPACT Model
In the Fish to 2020 study, the model started its simulations in the year 1997 and performed projections into 2020. In the current study, the model begins its projections in the year 2000 and continues to 2030.
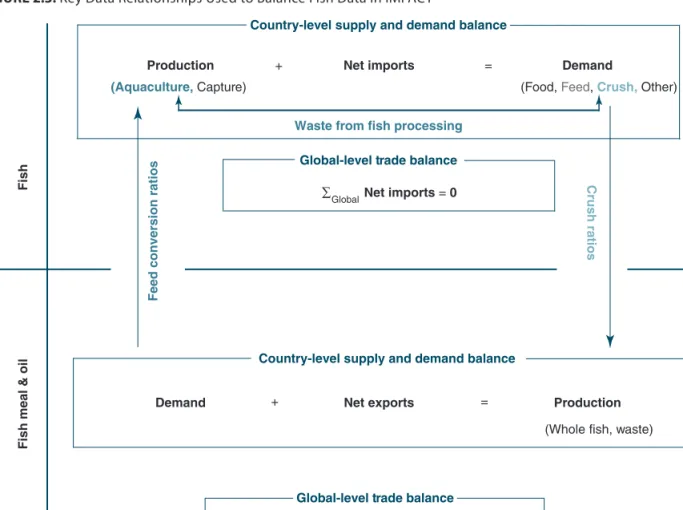
IMPACT Model Structure
For both existing raw materials and newly added fish products, reduced-form demand functions regulate per capita consumption demand in the model. As a new addition to this study, the model includes the “reduction” of small pelagic and other fish for the production of fishmeal and fish oil. The profitability of aquaculture is characterized in the model by the price of the fish species, the prices of other species and the prices of fishmeal and fish oil (crucial inputs for aquaculture).7 Accordingly, the price elasticities of supply with respect to own price are positive, while those related to fishmeal and fish oil prices are negative.
For the production of fishmeal and fish oil, the model allows the use of fish waste, and the model contains a simple demand function for the treatment of waste. The demand function for fish processing waste contains only the fishmeal price as an argument. The reduced demand for whole fish or processing waste has no exogenous driver for change in the model.
Derivation of these ratios for fishmeal and fish oil is discussed in the next section.
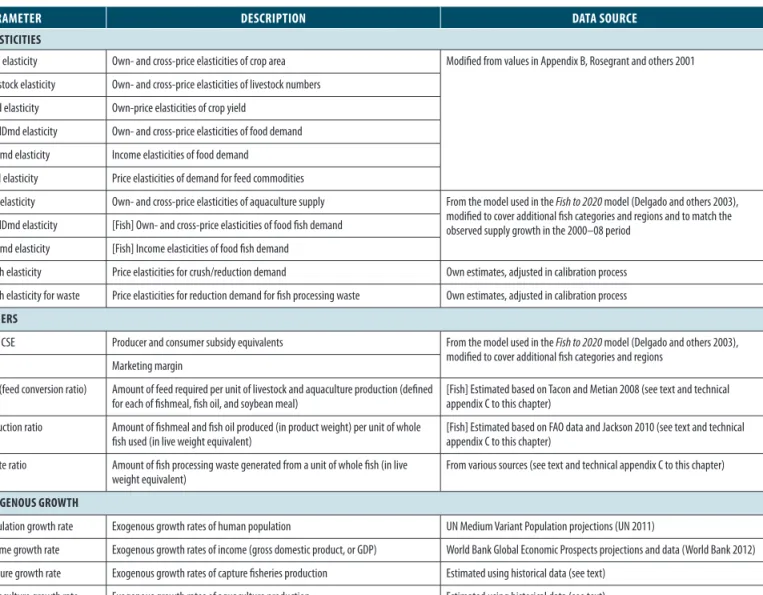
Data Used and Parameter Specifi cation
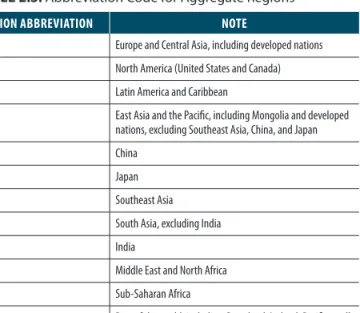
12 FAO FIPS is responsible for the calculation of FBS for fish and fish TABLE 2.4: Summary of key variables in the IMPACT model. For ease of use in the IMPACT model, the fish species are aggregated in this study. In the IMPACT model, the consumption and trade series are available for nine aggregated fishery products.
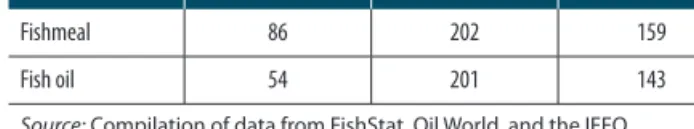
First, table 2.5 shows that there are more fishmeal/fish oil exporting countries in the data than producing countries. For fishmeal and fish oil, the price series provided by IFFO are used. Food Elasticity Dmd [Fish] Intrinsic and cross-price elasticities of demand for fish food IncDmd elasticity [Fish] Income elasticities of demand for fish food.
Reduction ratio The amount of fishmeal and fish oil produced (in product weight) per unit of whole fish used (in live weight equivalent).
Establishing a Consistent Base-Year Picture
This also applies to the trade in fishmeal and fish oil. The inconsistency of the data mainly arises from the addition of fishmeal and fish oil to the model. This allows deviations to a greater extent for variables related to fishmeal and fish oil.
Estimating reduction ratios takes into account the amounts of fish processing waste used in the production of fishmeal and fish oil. The quantity of fish landed (through capture fishing or aquaculture) may never deviate from the data. In addition, to achieve internal consistency, the trade and production levels of fishmeal and fish oil may deviate from the data.
Second, we prioritize production and trade data for fishmeal and fish oil (Set III).
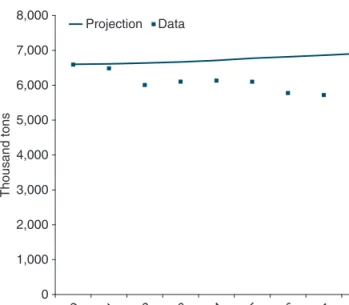
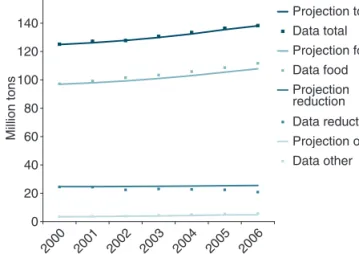
Assessing the Quality of Projections
Note that, since fish production ranges are not allowed to deviate from the data in the base year establishment process, the projections coincide with the data for the year 2000. Fishmeal and fish oil demand are determined in the model as aquaculture and livestock. production times the corresponding FCRs. Thus, the projected levels of aquaculture and livestock production largely drive the projections of fishmeal and fish oil supply and demand.
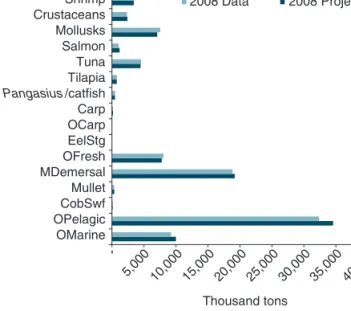
For the same reason, but to a lesser extent, OMarien production is overestimated, as they are also used for the production of fishmeal and fish oil. Regarding the regional calibration of the demand side of the model, Figure 2.12 shows a comparison between the model projections and FAO data on food fish demand per capita for 2006. In Figure 2.14 we see a comparison between the model projections and data for the regional net exports of fish.
The steady upward trend in real world fish oil prices is similar to that of fishmeal and is shown in Figure 2.17.
Issues and Discussions
21 There are other multi-commodity fishing industry models (e.g., the AsiaFish model) that work better for country-specific projections of fish supply and demand (Dey, Briones, and Ahmed 2005; Dey and others 2008). In particular, the RRs are discussed in the context of the allocation of the use of fish processing waste in the production of fishmeal and fish oil. Amount of whole fish used in fishmeal production, indicated by FAO FIPS FBS data.
Thus, in the calculated amount the use of fish processing waste originates from all these countries. Reduction ratio: amount of fishmeal and fish oil produced (in product weight) per unit of fish used (in live weight equivalent). Waste ratio: the amount of fish processing waste generated by a unit of whole fish (in live weight equivalent).
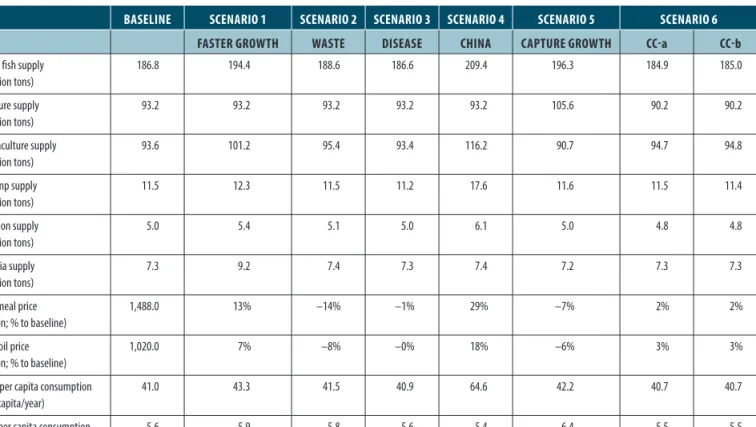
The base case reflects the trends of global fish markets currently observed in aggregated statistics.
IMPACT Projections to 2030 under the Baseline Specifi cation
- Production
- Consumption
- Trade and Prices
- Fishmeal and Fish Oil
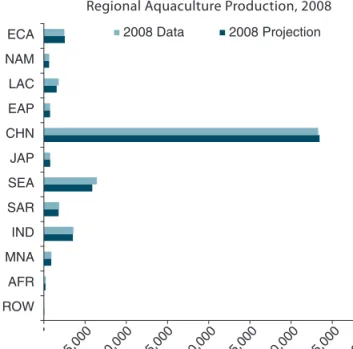
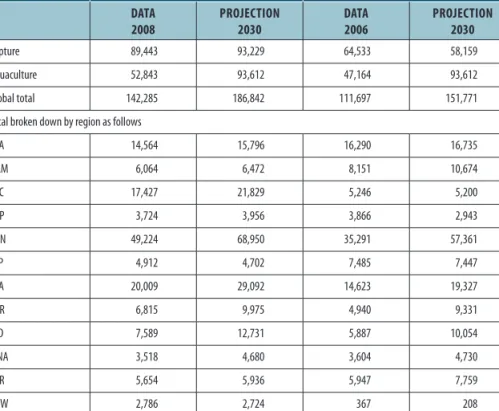
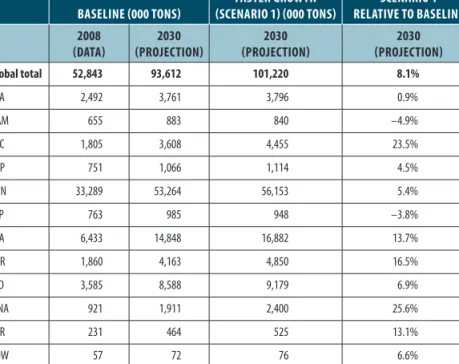
China's fish production is expected to grow by 31.4 percent, accounting for a whopping 36.9 percent of global fish production by 2030. Overall, the model does not predict a significant shift among the major players in global fish markets. In general, per capita fish consumption is expected to grow rapidly in the regions with the highest projected income growth (CHN, IND, SEA).
Currently, about 80 percent of the fish produced worldwide are consumed by humans as food. The bar for AFR shows that the net import of fish in that region. Over the entire projection period, the model shows that about 15 percent of the world's fishmeal supply comes from fish processing waste.
However, there are likely to be differences in the way supply and demand for fishmeal and fish oil is modelled.
IMPACT Projections to 2030 under Selected Scenarios
- Scenario 1: Faster Aquaculture Growth
- Scenario 2: Expanded Use of Fish Processing Waste in Fishmeal and Fish Oil Production
- Scenario 3: A Major Disease Outbreak in Shrimp Aquaculture in Asia
- Scenario 4: Accelerated Shift of Consumer Preferences in China
- Scenario 5: Improvement of Capture Fisheries Productivity
- Scenario 6: Impacts of Climate Change on the Productivity of Capture Fisheries
In addition, the model now allows the use of fish waste to produce fishmeal and fish oil, as explained in Chapter 2. In fact, most of the gain from using fish waste under the scenario would. We simulate a sudden drop in aquaculture production of shrimp in the affected countries by 35 percent in 2015 compared to the baseline projection value in 2015.
Note that the model may exaggerate TABLE 4.7: Projected changes in food fish consumption. Much of the change is focused on the five specific species that were targeted in this scenario. As a result, the total supply of fish would be lower under CC than under the baseline scenario.
The changes in the oceans due to the climate change scenarios based on Cheung et al (2010) would not have any major impact on the projected consumption of food fish into 2030.
Discussion
Main Findings from the Analysis
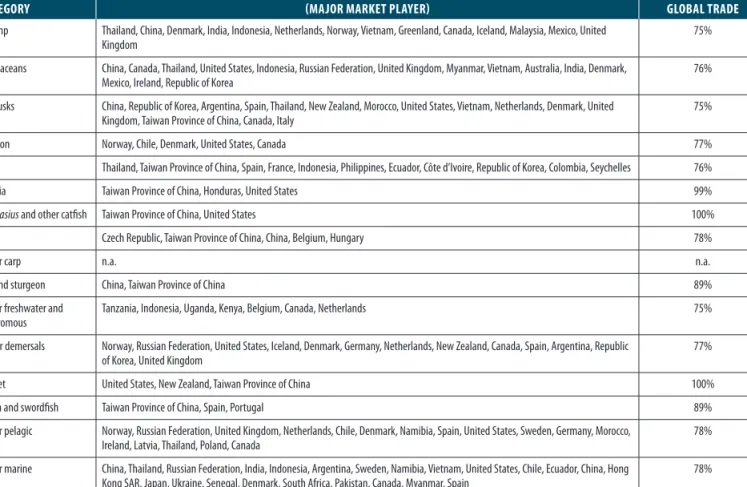
China is likely to still top the producer list of major fish species, but other Asian countries/. Other pelagic species are likely to remain the most important category for use in fishmeal and fish oil production. This is also reflected in our results in terms of the increasing use of fish processing waste for reduction to fishmeal and fish oil.
The model predicts that the fishmeal that will fuel the future growth of Asian aquaculture will largely be imported from Latin America, which will likely continue to produce a surplus of feed for both fish and livestock production. One of the illustrative scenarios we explore in this study points to important sources of feed for aquaculture: fish processing waste that, together with whole fish, can be reduced to fishmeal and fish oil. A substantially increased demand for high and medium value fish species in China would shift the global fish trade.
As a result, fish consumption in every other region will be reduced by 1 to 32 percent.
Discussion and Possible Future Directions
This gives us some confidence in the model's ability to reproduce the observed dynamics of the global fish markets. Given the sheer number of land-fish species combinations represented in the IMPACT model, case-by-case investigation of aquaculture expansion potential is not carried out. More importantly, the use of FAO FIPS FBS data determines the level of disaggregation of fish species, which limits the scope of analysis in this study.
Allowing the model to represent fish trade for processing purposes would require significant code changes, and obtaining consistent fish and seafood trade and consumption sets would require more complex data preparation. As a result, much time has been spent identifying the sources of discrepancies and reconciling them in order to reconstruct a credible and consistent picture of world fish markets. FAO has worked to encourage Member States to report disaggregated fish trade data.
This would undoubtedly be a desirable goal for anyone engaged in fish supply and demand research within the FAO and within the broader research community.