Machine Learning for Ecology
and Sustainable Natural Resource Management
Grant R. W. Humphries Dawn R. Magness
Falk Huettmann Editors
Natural Resource Management
Falk Huettmann
Editors
Machine Learning for Ecology and Sustainable Natural Resource
Management
ISBN 978-3-319-96976-3 ISBN 978-3-319-96978-7 (eBook) https://doi.org/10.1007/978-3-319-96978-7
Library of Congress Control Number: 2018956275
© Springer Nature Switzerland AG 2018
This work is subject to copyright. All rights are reserved by the Publisher, whether the whole or part of the material is concerned, specifically the rights of translation, reprinting, reuse of illustrations, recitation, broadcasting, reproduction on microfilms or in any other physical way, and transmission or information storage and retrieval, electronic adaptation, computer software, or by similar or dissimilar methodology now known or hereafter developed.
The use of general descriptive names, registered names, trademarks, service marks, etc. in this publication does not imply, even in the absence of a specific statement, that such names are exempt from the relevant protective laws and regulations and therefore free for general use.
The publisher, the authors, and the editors are safe to assume that the advice and information in this book are believed to be true and accurate at the date of publication. Neither the publisher nor the authors or the editors give a warranty, express or implied, with respect to the material contained herein or for any errors or omissions that may have been made. The publisher remains neutral with regard to jurisdictional claims in published maps and institutional affiliations.
This Springer imprint is published by the registered company Springer Nature Switzerland AG The registered company address is: Gewerbestrasse 11, 6330 Cham, Switzerland
Grant R. W. Humphries Black Bawks Data Science Ltd Fort Augustus, Scotland Falk Huettmann
EWHALE Lab, Biology and Wildlife Department Institute of Arctic Biology University of Alaska-Fairbanks Fairbanks, AK, USA
Dawn R. Magness
U.S. Fish and Wildlife Service Kenai National Wildlife Refuge Soldotna, AK, USA
balance and harmony with nature despite the odds being stacked against them
Grant R. W. Humphries I dedicate this book to those who work towards sustainability, human rights, and environmental justice
Dawn R. Magness I devote this book to ‘everybody’ (as things cannot be done any other way these days)
Falk Huettmann
vii
The fields of nature conservation and wildlife science have grown and diversified so rapidly over the past 50 years, it is hard to imagine how the speed of change could get even faster – it has. As artificial intelligence and machine learning is increas- ingly used in our field, change will accelerate. Grant Humphries, Dawn Magness and Falk Huettmann have provided us a book filled with information essential to get any wildlife or conservation biologist up to speed with the concepts and application of machine learning. They cover historical and conceptual information, plus specific case studies and a taste of the future.
Machine learning attempts to extract knowledge from messy data, and it is hard to think of a field where the data is messier. While traditional ecological data analy- sis and well-designed field experiments will always be essential, we need to find new tools to interpret the flood of environmental data coming from satellites, drones, camera traps, acoustic monitoring devices, tagged animals and more. Machine learning is relatively open-minded about the meaning of this data and the relation- ships between different kinds of data. While at times this is dangerous, it also liber- ates us to explore new ideas – such as using data on seabird chick weights to make predictions about the Southern Oscillation Index (Chap. 13).
The future of conservation will require an open mind. We could be using machine learning: for carrying out real-time management of small-scale fisheries, analyzing satellite data to make better landscape change models that inform policy, deploying drones that can deter poachers, and creating ephemeral protected areas for migra- tory species. As the authors remind us, we have very little time to avert the extinc- tion of most of the world’s species and whole-scale reduction in the abundance of even common species. We need every discipline and every tool available to effi- ciently and effectively solve the world’s conservation problems.
As The Nature Conservancy’s Chief Scientist, I can say that we will be increas- ing our investment in using artificial intelligence to make faster and better conserva- tion decisions that deliver outcomes on the ground.
Hugh Possingham The Chief Scientist of The Nature Conservancy
Arlington, Virginia, USA
ix
1 The findings and conclusions in this book are those of the authors and do not necessarily represent the views of the US Fish and Wildlife Service.
This painting, by Margaret Oliver, depicts Northern Gannet (Morus bassanus) and Northern Fulmar (Fulmarus glacialis) near an iceberg. Northern Gannet is a species that can be found breed- ing in the temperate parts of the North Atlantic and as far south as the Gulf of Mexico during the non-breeding season. The Northern Gannet, however, is being found further and further north, with 6 records in Svalbard, well above the Arctic Circle, between 2000 and 2016. This is likely to con- tinue and increase as ecosystem shifts push oceanic biomes further north. Icebergs, like the one shown in this piece, are another complex seascape feature that can be integrated into machine learning models for a holistic understanding of global ecosystems
We humans are curious animals. While other animals generally live in balance with their respective ecosystems, we almost seem to go out of our way to tip that balance in our favor to the extreme detriment of everything else. If an alien race were to look at us objectively, it is likely they would consider most modern humans a cancer on the planet; growing uncontrollably and using resources without much care, limit, or reason. But within this destructive framework lie some heroes who have at least been able to clearly identify our impacts and are fighting to protect species, habitats, and, ultimately, the human race. Some of them are scientists, environmentalists, conservationists, ecological economists, and others who only want to see balance restored to the planet. This battle is becoming harder to fight as our population expands and we compete more and more for our precious resources. To that end, we are in desperate need for fast decisions in a conservation context. Unfortunately, we often see science efforts get caught up in details like narrow statistical assumptions, mechanisms, and parsimony. While this has been interesting perhaps from a certain academic perspective, it really fails to build a holistic understanding of our world.
In the many years that we (the editors of this book) have been studying the appli- cation of machine learning, there have been amazing changes in techniques. I (GH) recall starting my master’s degree with a moderate understanding of multivariate statistics but having never used a machine learning algorithm before. Within my first week, I had run my first model using Salford System’s machine learning software, TreeNet (an implementation of boosted regression trees). At the time, I did not real- ize the path I was about to take and spent the next two years studying the method to be able to pull apart and make sense of the science behind the technique. One thing I learned was that machine learning and, subsequently, scripting (in R and Python) was a rabbit hole. The more I did, the deeper I went (“deep learning,” you could say), and the more I wanted to know. But what I soon realized was that it was not just that the philosophy was complex and dynamic, but that the methods and tools were changing much faster than I could keep up with. Trying to build an under- standing of a complex suite of tools and techniques while having to study ecology (or wildlife biology), take other course work, have a social life, and write was a challenging task. This made me realize something that has become abundantly clear to me over the last decade: there is a major disconnect between ecology and the computational (and quantitative) skills required in today’s job market. This discon- nect makes it very difficult for applying solutions to complex analytical problems in fast and effective ways (to match the changing pace of our world). We (as ecolo- gists) spend vast amounts of time pouring through obscure and confusing computer
“lingo” that we just are not used to, and that slows us down. We have to therefore raise the question: “How do academics (already tasked with writing grants, teaching courses, mentoring students, publishing research, doing admin work, etc…), or gov- ernment scientists, or other researchers have the time to really understand and apply new techniques?” We (GH, FH, and DM) have all experienced this over our careers to date in various ways, and it is part of the motivation for compiling this book. We want to encourage ecologists at universities and elsewhere to embrace the techno- logical changes that are coming our way; specifically, powerful machine learning algorithms that can be tailored to a number of really interesting scientific questions.
Ideally, this would be done in an open access framework, which would help to make the most meaningful impact on progress. The integration of computational science, machine learning, and data mining into ecology courses at a very basic level has the potential to vastly change how we do science by allowing us to quickly analyze complex and peculiar datasets common in wildlife studies. There is still time to redefine syllabi, performance evaluations, and job descriptions with an outlook and focus on global sustainability.
Machine learning algorithms are being recognized more and more as formidable weapons in natural resource management and wildlife biology. This is because the methods we elaborate on in this book are able to decipher complex relationships between many predictor variables (hundreds or more of the best available) and give meaningful and powerful predictions while allowing us to infer relevant mecha- nisms and good management action. There is somewhat of a stigma in ecology, however, which we believe stems from a lack of basic teachings when we are stu- dents. Firstly, we are not really taught basic data management techniques to help us better organize ourselves digitally, which has direct implications in things like data mining. Secondly, the details of new algorithms (or how to begin deciphering them) are not really taught, which makes them come off as “black boxes.” Thirdly, the basic principles of scripting (e.g., R, Python, C++ etc…) are not taught to us and are picked up, if at all, through many frustrating nights in front of online tutorials or trial and error (mostly error!).
There is hope, however, as university statistics courses are more frequently taught in R, which means code can be replicated and explained. But these courses are generally pure statistics courses (though exceptions are arising with quantitative ecology being taught in some universities now). Also, machine learning algorithms and techniques rarely integrated in these courses. Machine learning is an entire suite of tools that cannot be ignored as the evidence for their superiority in many aspects mounts further. They can help lead us toward a holistic understanding of the planet if used correctly and in an ethical framework.
Our book aims to guide you through a series of interesting and new applications of machine learning algorithms in wildlife biology, ecology, and natural resource management. We hope that as you read through these techniques, you get some ideas for your own research and perhaps try a few algorithms yourself. The world is changing rapidly, as are the algorithms we use to model it. Despite the ongoing decay and policy chaos, we see a bright future ahead for machine learning in ecol- ogy and our planet.
Fort Augustus, Scotland Grant R. W. Humphries
Soldotna, AK, USA Dawn R. Magness
Fairbanks, AK, USA Falk Huettmann
xiii
The work in this book stems from a decade of networking and communications with a variety of amazing and talented people, as well as personal experience applying machine learning to complex ecological datasets. A full list of those people could take up a book all on its own. I am indebted to I. Jones, T. Miller, D. Verbyla, D.
Atkinson, C. Deal, H. Moller, P. Seddon, J. Overton, G. Nevitt, B. Sydeman, and H. Lynch for direct guidance and supervision over my academic career, allowing me to explore novel uses of machine learning algorithms. A special thanks to my co- editors, without whom this book would not be possible. Many of the projects I have worked on have been inspired by the studies and dedication of many of my peers and lab mates including: J. Lavers, S. Seneviratne, A. Baltensperger, T. Mullet, S. Hazlett, K. Jochum, S. Oppel, M. Lindgren, R. Buxton, M. Savoca, B. Hoover, S. Jamieson, C. Tyson, H. Robinson, M. Garcia-Reyes, C. Youngflesh, M. Schrimpf, M. Lynch, C. Foley, B. Goncalvez, A. Borowicz, B. Weinstein, F. McDuie, and many others. Finally, thanks go to my family – my rocks in this world: Alex, Dylan, and River.
Grant R. W. Humphries Having worked on the issue worldwide and professionally for over 25 years, for a machine learning book and in the environmental and conservation sciences, by now one should carry a long list of people to thank. Though the reality is – and as the intense machine learning work has shown us globally – the amount of people to thank on that issue remains relatively few. Surprising to us, machine learning is still
“just” a narrow aspect in the quantitative sciences and an even smaller group in the governmentally dominated wildlife conservation management field. People, nations, and institutions who “saw the light” and supported that issue were far and few: that is also the Leo Breiman career experience (whom I acknowledge here the most). On the good side, those people that are to be thanked are true visionaries and one must be grateful for their massive progress and for being open-minded. An incomplete but tight list consists of: R. O’Connor, A.W. Diamond, G. Yumin, M. Chunrong, H. Huesong, B. Raymond, C. Fox, P. Paquet, D. Kirk, S. Pitman, J. Evans,
S. Cushman, B. Walther, L. Koever, B. Danis, S. Ickert-Bond, D. Verbyla, J. Morton, G. Heyward, T. Gotthardt, and R. Yoccum. The discussions and support we received from Salford Systems Ltd. – D. Steinberg, L. Solomon, and their team – cannot be valued highly enough for discussing and learning more about “modern” machine learning applications in real life. The institutions, agencies, and individuals who invited us for machine learning workshops and conference sessions worldwide are greatly appreciated also. All my 60+ students in the EWHALE lab with the University of Alaska-Fairbanks (UAF) must be thanked for their efforts working on the issue with us on machine learning and open access, too. And then, there are many big but indirect supporters who just kept an open mind and pursued holistic non-parsimonious views, namely D. Carlson, J. Liu, T. Lock, B. Czech, J. Ausubel, P. Skylstad, B. Welker, T. Williams, H. Possingham, P. Koubbi, H. Griffith, C. De Broyer, A. Bult-Ito, D. Misra, R. Ganguli, P. Layer, B. Norcross, T. Bowyer, K. Hundertmark, E. Bortz, A. Shestopalov, K. Kieland, and the Springer publisher (namely J. Slobodien). Lastly, I thank H. Berrios Alvarez, S. Linke, I. Presse, H. Hera, C. Cambu, L. Luna, and S. Sparks for wider infrastructure support and for plain fun in the world of machine learning and data.
Falk Huettmann The co-editors would like to jointly thank all the reviewers who helped make this book happen: A. Baltensperger, E. Craig, T. Miewald, B. Weinstein, C. Fox, D. Kirk, D. Karmacharya, A. Bennison, M. Lindgren, M. Garcia-Reyes, V. Morera, S. Pittman, T. Mullet, A. Raya Rey, M. Ryo, and C. Mi.
We greatly appreciate the artwork provided to this book by A. Price, G. Brehm, M. Oliver, and C. Humphries—fantastic artists with hearts for the planet. We would also like to extend our deepest gratitude to Hugh Possingham for writing the fore- word to this book. His work on Marxan and related issues has led to protections for some of the most vulnerable places in the world, and we are honored to have his thoughts reflected here. And finally, thanks to Springer for publishing this book and making it available to ecologists and natural resource managers around the world.
Grant, Falk, and Dawn
showing a colony of gentoo penguins that have integrated rope (possibly left by earlier explorers) into their nest. Even in the remote corners of the world, we see the direct impact of humans on wildlife
xvii
Part I Introduction
1 Machine Learning in Wildlife Biology: Algorithms, Data Issues and Availability, Workflows, Citizen Science, Code Sharing,
Metadata and a Brief Historical Perspective . . . 3 Grant R. W. Humphries and Falk Huettmann
2 Use of Machine Learning (ML) for Predicting and Analyzing Ecological and ‘Presence Only’ Data: An Overview
of Applications and a Good Outlook . . . 27 Falk Huettmann, Erica H. Craig, Keiko A. Herrick,
Andrew P. Baltensperger, Grant R. W. Humphries, David J. Lieske, Katharine Miller, Timothy C. Mullet, Steffen Oppel,
Cynthia Resendiz, Imme Rutzen, Moritz S. Schmid, Madan K. Suwal, and Brian D. Young
3 Boosting, Bagging and Ensembles in the Real World:
An Overview, some Explanations and a Practical Synthesis for Holistic Global Wildlife Conservation Applications
Based on Machine Learning with Decision Trees . . . 63 Falk Huettmann
Part II Predicting Patterns
4 From Data Mining with Machine Learning to Inference
in Diverse and Highly Complex Data: Some Shared Experiences, Intellectual Reasoning and Analysis Steps for the Real World
of Science Applications . . . 87 Falk Huettmann
5 Ensembles of Ensembles: Combining the Predictions
from Multiple Machine Learning Methods . . . 109 David J. Lieske, Moritz S. Schmid, and Matthew Mahoney
6 Machine Learning for Macroscale Ecological Niche Modeling - a Multi- Model, Multi- Response Ensemble Technique
for Tree Species Management Under Climate Change . . . 123 Anantha M. Prasad
7 Mapping Aboveground Biomass of Trees Using Forest Inventory Data and Public Environmental Variables within the Alaskan
Boreal Forest . . . 141 Brian D. Young, John Yarie, David Verbyla, Falk Huettmann,
and F. Stuart Chapin III
Part III Data Exploration and Hypothesis Generation with Machine Learning
8 ‘Batteries’ in Machine Learning: A First Experimental Assessment of Inference for Siberian Crane Breeding Grounds
in the Russian High Arctic Based on ‘Shaving’ 74 Predictors . . . 163 Falk Huettmann, Chunrong Mi, and Yumin Guo
9 Landscape Applications of Machine Learning: Comparing Random Forests and Logistic Regression in Multi-Scale Optimized Predictive Modeling of American Marten
Occurrence in Northern Idaho, USA . . . 185 Samuel A. Cushman and Tzeidle N. Wasserman
10 Using Interactions among Species, Landscapes, and Climate to Inform Ecological Niche Models: A Case Study of American
Marten (Martes americana) Distribution in Alaska . . . 205 Andrew P. Baltensperger
11 Advanced Data Mining (Cloning) of Predicted Climate-Scapes and Their Variances Assessed with Machine Learning:
An Example from Southern Alaska Shows Topographical
Biases and Strong Differences . . . 227 Falk Huettmann
12 Using TreeNet, a Machine Learning Approach to Better Understand Factors that Influence Elevated Blood Lead Levels
in Wintering Golden Eagles in the Western United States . . . 243 Erica H. Craig, Tim H. Craig, and Mark R. Fuller
Part IV Novel Applications of Machine Learning Beyond Species Distribution Models
13 Breaking Away from ‘Traditional’ Uses of Machine Learning:
A Case Study Linking Sooty Shearwaters (Ardenna griseus)
and Upcoming Changes in the Southern Oscillation Index . . . 263 Grant R. W. Humphries
14 Image Recognition in Wildlife Applications . . . 285 Dawn R. Magness
15 Machine Learning Techniques for Quantifying Geographic Variation in Leach’s Storm-Petrel (Hydrobates leucorhous)
Vocalizations . . . 295 Grant R. W. Humphries, Rachel T. Buxton, and Ian L. Jones
Part V Implementing Machine Learning for Resource Management 16 Machine Learning for ‘Strategic Conservation and Planning’:
Patterns, Applications, Thoughts and Urgently Needed Global
Progress for Sustainability . . . 315 Falk Huettmann
17 How the Internet Can Know What You Want Before You Do:
Web-Based Machine Learning Applications for Wildlife
Management . . . 335 Grant R. W. Humphries
18 Machine Learning and ‘The Cloud’ for Natural Resource Applications: Autonomous Online Robots Driving Sustainable
Conservation Management Worldwide? . . . 353 Grant R. W. Humphries and Falk Huettmann
19 Assessment of Potential Risks from Renewable Energy Development and Other Anthropogenic Factors to Wintering
Golden Eagles in the Western United States. . . 379 Erica H. Craig, Mark R. Fuller, Tim H. Craig, and Falk Huettmann
Part VI Conclusions
20 A Perspective on the Future of Machine Learning: Moving Away from ‘Business as Usual’ and Towards a Holistic Approach
of Global Conservation . . . 411 Grant R. W. Humphries and Falk Huettmann
Index . . . 431
xxi
Andrew P. Baltensperger National Park Service, Fairbanks, AK, USA
Rachel T. Buxton Department of Fish, Wildlife and Conservation Biology, Colorado State University, Fort Collins, CO, USA
Erica H. Craig Aquila Environmental, Fairbanks, AK, USA Tim H. Craig Aquila Environmental, Fairbanks, AK, USA
Samuel A. Cushman U.S. Forest Service, Rocky Mountain Research Station, Flagstaff, AZ, USA
Mark R. Fuller Boise State University, Raptor Research Center, Boise, ID, USA Yumin Guo College of Nature Conservation, Beijing Forestry University, Beijing, China
Keiko A. Herrick EWHALE Lab, Biology and Wildlife Department, Institute of Arctic Biology, University of Alaska-Fairbanks, Fairbanks, AK, USA
Falk Huettmann EWHALE Lab, Biology and Wildlife Department, Institute of Arctic Biology, University of Alaska-Fairbanks, Fairbanks, AK, USA
Grant R. W. Humphries Black Bawks Data Science Ltd., Fort Augustus, Scotland Ian L. Jones Department of Biology, Memorial University, St. John’s, NL, Canada David J. Lieske Department of Geography and Environment, Mount Allison University, Sackville, NB, Canada
Dawn R. Magness U.S. Fish and Wildlife Service, Kenai National Wildlife Refuge, Soldotna, AK, USA
Matthew Mahoney Department of Geography and Environment, Mount Allison University, Sackville, NB, Canada
Chunrong Mi Institute of Zoology, Chinese Academy of Sciences, Beijing, China College of Nature Conservation, Beijing Forestry University, Beijing, China
Katharine Miller Auke Bay Laboratories, Alaska Fisheries Science Center, National Marine Fisheries Service, NOAA, Juneau, AK, USA
Timothy C. Mullet EWHALE Lab, Biology and Wildlife Department, Institute of Arctic Biology, University of Alaska-Fairbanks, Fairbanks, AK, USA
Steffen Oppel RSPB Centre for Conservation Science, Royal Society for the Protection of Birds, Cambridge, UK
Anantha M. Prasad Research Ecologist, USDA Forest Service, Northern Research Station, Delaware, OH, USA
Cynthia Resendiz EWHALE Lab, Biology and Wildlife Department, Institute of Arctic Biology, University of Alaska-Fairbanks, Fairbanks, AK, USA
Imme Rutzen EWHALE Lab, Biology and Wildlife Department, Institute of Arctic Biology, University of Alaska-Fairbanks, Fairbanks, AK, USA
Moritz S. Schmid Hatfield Marine Science Center, Oregon State University, Newport, OR, USA
EWHALE Lab, Biology and Wildlife Department, Institute of Arctic Biology, University of Alaska-Fairbanks, Fairbanks, AK, USA
CERC in Remote Sensing of Canada’s New Arctic Frontier Université Laval, Québec, Canada
F. Stuart Chapin III Institute of Arctic Biology, University of Alaska Fairbanks, Fairbanks, AK, USA
Madan K. Suwal Department of Geography, University of Bergen, Bergen, Norway
David Verbyla Department of Forest Sciences, University of Alaska Fairbanks, Fairbanks, AK, USA
Tzeidle N. Wasserman School of Forestry, Northern Arizona University, Flagstaff, AZ, USA
John Yarie Department of Forest Sciences, University of Alaska Fairbanks, Fairbanks, AK, USA
Brian D. Young Department of Natural Sciences, Landmark College, Putney, VT, USA
xxiii
Dr. Grant R. W. Humphries is an ecological data scientist who has worked on a number of marine and terrestrial projects (mostly seabirds) around the world where machine learning tools were critical to solving complex problems. He has over a decade of experience working with machine learning tools and techniques and loves applying them in novel and interesting ways.
He is the founder of Black Bawks Data Science Ltd., a small data science company based in the highlands of Scotland, where he works on building interactive, web- based decision support tools that integrate advanced modeling. He is also a penguin counter, traveling to Antarctica every year to collect data for the Antarctic Site Inventory. His spare time is dedicated to music, cooking, and spending time with his two daughters, River and Dylan, and wife, Alex.
Dr. Dawn R. Magness is a landscape ecologist inter- ested in climate change adaptation, landscape plan- ning, ecological services, and spatial modeling. She earned her M.S. in Fish and Wildlife Science at Texas A & M University and her Ph.D. in the interdisciplin- ary Resilience and Adaptation Program at the University of Alaska, Fairbanks. Her current projects use multiple methods to assess ecosystem vulnerability to inform strategic adaptation planning. She has con- ducted research on songbirds, flying squirrels, and American marten.
Dr. Falk Huettmann is a “digital naturalist” linking computing and the Internet with natural history research for global conservation and sustainability. He is a Professor in Wildlife Ecology at the University of Alaska Fairbanks (UAF) Biology & Wildlife Department and Institute of Arctic Biology, where he and many international students run the EWHALE lab.
In his lab, he pursues biodiversity, land- and seascapes, the atmosphere, global governance, ecological eco- nomics, diseases, and new approaches to global sus- tainability on a pixel-scale. Most of his 200 publications and 7 books are centered on Open Access and Open Source, Geographic Information Systems (GIS), and data mining/machine learning.
“The world is one big data problem.”
– Andrew McAfee
Introduction
3
© Springer Nature Switzerland AG 2018
G. R. W. Humphries et al. (eds.), Machine Learning for Ecology and Sustainable Natural Resource Management, https://doi.org/10.1007/978-3-319-96978-7_1
Machine Learning in Wildlife Biology:
Algorithms, Data Issues and Availability, Workflows, Citizen Science, Code Sharing, Metadata and a Brief Historical Perspective
Grant R. W. Humphries and Falk Huettmann
1.1 Introduction
We can all agree that machine learning has come a long way from Alan Turing’s original theories in the 1950s. With many new methods and publications arising, we are seeing a new statistical culture beginning to form (for natural resource applica- tions see Hilborn and Mangel 1997; Breiman 2001a; Hochachka et al. 2007; Drew et al. 2011). This new culture has granted us access to a major tool box that is handy to any practitioner trained in machine learning techniques, frequentist statistics, or neither (Hastie et al. 2009; Fernandez-Delgado et al. 2014). Its success across mul- tiple disciplines and its accessibility means that machine learning as a technique should not be ignored. Machine learning methods outperform other algorithms when it comes to predictive power (and inference), elegance, and convenience (e.g., Elith et al. 2006; Mi et al. 2017), particularly when rapid decision making is required, as is the case in natural resource management. New algorithms and meth- ods for looking at complex ecological data are arising fast; unfortunately, faster than most scholars or tenured professors (for example) can keep up with.
The adoption of machine learning in the ecological community has been slow.
Beyond a possible discomfort with unknown methods, perhaps this has also been due to lack of communication between natural scientists and the machine learning community, the absence of machine learning in natural sciences education, or
G. R. W. Humphries (*)
Black Bawks Data Science Ltd., Fort Augustus, Scotland e-mail: [email protected]
F. Huettmann
EWHALE Lab, Biology and Wildlife Department, Institute of Arctic Biology, University of Alaska-Fairbanks, Fairbanks, AK, USA
e-mail: [email protected]
because there is little communication of examples of machine learning methods applied to ecological data (Thessen 2016). However, the literature on applications of machine learning in ecology is growing (e.g., Cushman and Huettmann 2010;
Crisci et al. 2012; Thessen 2016) and integrating into ecological informatics (i.e. the use of modern computational techniques and algorithms on problems of ecological interest; Petkos 2003). We aim, through this chapter, to introduce some machine learning topics in an ecological context. We hope you keep these in mind throughout this book to help guide you towards a better understanding of potential applications of machine learning in ecology.
1.2 Some Terminology
Machine learning consists of many algorithms and thus it is a complex and evolv- ing field. Often the language can be new and unusual for anyone not familiar with it. Included here in Table 1.1 is a short glossary of commonly used terms/concepts and their brief definitions. Many of the terms (e.g., categorical or continuous data) will be familiar to ecologists, but some may be new. These refreshers and addi- tions to the ecologists’ vocabulary are important because our required skill sets are changing; as are the institutions, nations, and publication landscapes that we work within.
Table 1.1 A basic glossary of machine learning terms that can be found in ecology. These terms will appear throughout the book in various places
Term Definition
AUC (Area under the ROC Curve)
An evaluation metric for classification problems that consider a variety of classification thresholds. Values greater than 0.8 are considered ‘good’
in ecology.
BACK PROPAGATION
Mostly used in neural networks for performing gradient descent (see below) on neural networks. Basically, predictive error is calculated backwards through a neural network graph (the representation of the data flow through neural network nodes). See Rumelhart et al. (1986) for a good description.
BAGGING Also known as bootstrap aggregating, it is an algorithm designed to reduce variance and over-fitting through model averaging. This is the meta-algorithm used in any random forests implementation. Many decision trees are grown (a forest) and can be over-learned (see over-fitting below). Individual trees might have high variance, but low bias. Averaging the predictions across the trees reduces the variance and thus reduces over-learning across the whole dataset.
BIG DATA A term that describes large structured or un-structured datasets most commonly found in business, but extends into ecology through image recognition problems, or high resolution spatial modeling.
(continued)
Table 1.1 (continued)
Term Definition
BOOSTING Boosting is a meta-algorithm used to minimize loss in a machine learning algorithm through iterative cross-validation. This is the meta-algorithm used in the generalized boosted regression modeling method (i.e., boosted regression trees). At each step, the predictive error is measured by cross validation, which is then used to inform the next step. This removes issues of over-learning because it is constantly testing itself to ensure predictive power does not decrease. The best model is selected by where the error has been minimized the most over the process.
CATEGORICAL VARIABLE
A variable with a discrete qualitative value (e.g., names of cities, or months of the year). Sometimes, continuous variables can be broken down into categories for analysis; however, it is very difficult to create a continuous variable from a categorical one.
CLASSIFICATION A category of supervised learning that takes an input and predicts a class (i.e. a categorical variable). Mostly used for presence/absence modeling in ecology.
CLUSTERING A method associated with unsupervised learning where the inherent groupings in a dataset are learned without any a priori input. For example, principal component analysis (PCA) is a type of unsupervised clustering algorithm.
CONTINUOUS VARIABLE
A variable that can have an infinite number of values but within a range (e.g., a person’s age is continuous).
DATA MINING The act of extracting useful information from structured or unstructured data from various sources. Some people use this as an analogy for machine learning, but they are separate, yet related fields. For example, using a machine learning algorithm to automatically download information from the internet could be considered data mining.
Unsupervised learning could also be considered data mining, and some machine learning algorithms take advantage of this to build models.
DATA SCIENCE The study of data analysis, algorithmic development and technology to solve analytical problems. Many ecologists actually classify as data scientists (without even knowing it); particularly those with a quantitative background and strong programming skills.
DECISION TREE A type of supervised learning that is mostly used in classification problems but can be extended to regression. This is also known in the ecological literature as CART (classification and regression trees) and is the basis for algorithms like generalized boosted regression modeling (gbm), TreeNet, or random forests.
DEEP LEARNING Deep learning is advanced machine learning using neural nets for a variety of purposes. It uses vast amounts of data but can output highly flexible and realistic results for simultaneous model outputs. Although not used in ecology yet (save for image recognition), there are vast implications for ecosystem modeling.
DEPENDENT VARIABLE
The dependent variable is what is measured and is affected by the independent variables. Also known as: target variable, or response variable.
ENSEMBLE A merger of the predictions from many models through methods like averaging.
(continued)
Table 1.1 (continued)
Term Definition
FREQUENTIST STATISTICS
Refers to statistics commonly used in ecology and elsewhere that are geared towards hypothesis testing and p-values. They aim to calculate the probability of an outcome of an event or experiment occurring again under the same conditions.
GRADIENT DESCENT
A technique to minimize the loss (e.g., root mean squared error) by computing the best combination of weights and biases in an iterative fashion. This is the basis for boosting.
HOLDOUT DATA A dataset that is held back independently from the dataset used to build the model. Also known as the testing or validation data.
IMPUTATION A technique used for handling missing data by filling in the gaps with either statistical metrics (mean or mode) or machine learning. In ecology, nearest neighbor observation imputation is sometimes used.
INDEPENDENT VARIABLE(S)
This is the variable or set of variables that affects the dependent variable.
Also known as the predictor variable(s), covariate(s) or the explanatory variable(s)
MACHINE LEARNING
The core of our book; this refers to the techniques involved in dealing with vast and/or complex data by developing and running algorithms that learn without a priori knowledge or explicit programming. Machine learning methods are often referred to as black box, but we argue that this is not the case and that any machine learning algorithm is transparent when one takes the time to understand the underlying equations.
LOSS The measure of how bad a model is as defined by a loss function. In linear regression (for example), the loss function is typically the mean squared error.
NEURAL NETWORK
A model inspired by the human brain and neural connections. A neuron takes multiple input values and outputs a single value that is typically a weighted sum of the inputs. This is then passed on to the next neuron in the series.
OVER-FITTING This happens when a model matches training data so closely that it cannot make correct predictions to new data. We argue that the term
“over-fitting” is often mis-used in a machine learning context. Fitting suggests that an equation is fit to a dataset in order to explain the relationship. However, in machine learning, this sort of fitting does not occur. Patterns in the data are generally learned by minimizing variance in data through splits or data averaging (e.g. regression trees or support vector machines). A more appropriate term would be “over-learning” or perhaps “over-training” (both used in the machine learning community) where functions describe data poorly and result into a poor prediction.
However, algorithms that use back-propagation and cross-validation limit and, in some cases, eliminate over-learning. In species distribution modeling (using binary presence/absence data), this can be measured using AUC/ROC.
RECURSIVE PARTITIONING
This is the technique used to create CARTs (i.e., CART is a type of recursive partitioning, but recursive partioning is not CART), and thus the offshoot algorithms (e.g., boosted regression trees and random forests). The method strives to correctly classify data by splitting it into sub-populations based on independent variables. Each sub-population can be split an infinite number of times, or until a threshold or criteria is reached. See Strobl et al. (2009) for a comprehensive overview.
(continued)
1.3 A Few Paragraphs on the History of Machine Learning
Machine learning algorithms really had their beginning after the second world war when Alan Turing introduced the concept of thinking machines (Turing 1950). He envisioned a world when computers would be able to actively learn, and ‘communi- cate’ new information back to users after that learning process. The ‘Turing test’
(i.e., the test that demonstrates whether a machine is learning) became the basis for the machine learning discipline that would soon develop. Only a few years after this, the first computer learning program, designed to play checkers, was developed, and learned as a game progressed. This was inspired by the Turing test (Samuel 1959).
Through the 1960s, there was a boom of interest in machine learning, with neural networks (e.g. the ‘Perceptron’) being a topic of great interest (e.g. for enemy/friend recognition in radar images). However, computational power limited the forward momentum of the subject. This, combined with little to no computational training in life sciences, meant that from the 1970s to the 1990s, during the “boom” of ecology, machine learning, although having been around for some time, was not something really accessible to ecologists. Frequentist statistics and hypothesis testing were the primary tools for life scientists, which made sense at the time because machine learning algorithms had yet to develop to a point where they could be useful. The notion of probabilities, essentially index numbers between 0–1, became globally established with linear regression and logistic functions at its core. Being quantita- tive essentially meant that everything was approximately expressed as a 0 or 1 using regression formulas borrowed from theoretical probability theory. It made for the mainstay of what is referred to as being scientific and also for textbook natural resource management practices (e.g. Silvy 2012). Although we cannot devalue the importance of baseline ecological studies, quantitative practices were moving faster than ecologists were able to keep up with (O’Connor 2000).
Stock markets boomed and technology advanced, and soon we were in an era of computers and the internet through the 1990s. It was during this time when machine learning shifted away from basic pattern learning towards finding algorithms that could predict complex behavior (See Mueller and Massaron 2016). Humans were collecting vast amounts of data, and traditional statistical techniques were not suited to dealing with the problems being faced. More explicitly, the large sample sizes essentially meant
Term Definition
SUPERVISED LEARNING
This type of learning occurs when the algorithm consists of a dependent variable which is predicted from a series of independent variables.
TESTING SET See holdout set above. This is used to generate independent validation of the model. This can be done iteratively (as in boosting).
TRAINING SET This is the set of data that is used to build the model and is usually independent of the testing set. Could also be known as assessment data.
UNSUPERVISED LEARNING
The goal of this technique is to model the underlying structure of the data in order to learn more about it without having a dependent variable.
Clustering falls into this category Table 1.1 (continued)
that hypothesis testing was too challenging as tiny differences could lead to
“significant” results (p value <0.05), and analysis was computationally expensive.
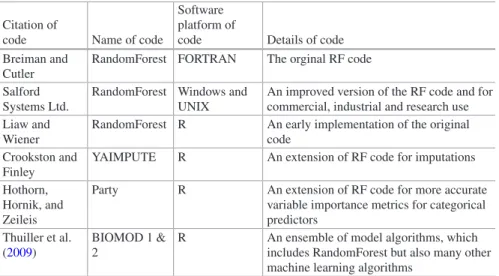
Through the 2000s, things progressed rapidly with computers getting smaller and more powerful. It was during this period when machine learning (primarily through a few select algorithms) was picked up in ecology. Algorithms like classifi- cation and regression trees (CART; Stone 1984) were incorporated early on (De’ath and Fabricius 2000). Soon after, these were refined with boosting and bagging methods outside of the life sciences, leading to boosted regression trees (Friedman 2002) and random forests (Breiman 2001b). Currently, many software companies and programming languages compete for better and more efficient algorithms (see Textbox 1.1 for one such implementation).
A short reference list for wildlife-relevant machine learning methods consists of, but is not limited to: Breiman et al. 1984; Verner et al. 1986; Stockwell and Noble 1992; Stockwell 1994; Boston and Stockwell 1995; Fielding 1999; Phillips and Dudik 2008; Hastie et al. 2009; Mueller and Massaron 2016.
Textbox 1.1 Salford Systems: A Brief and Selective Personal History Dan Steinberg
Salford Systems (A Subsidiary of Minitab, Inc.) 9685 Via Excelencia, Suite 208, San Diego CA 92126
I had the good fortune to be introduced to the work of Leo Breiman and Jerome Friedman in 1985 while I was an Assistant Professor of Economics at the University of California, San Diego (UCSD). A new UC Berkeley Agricultural Economics Ph.D., Richard Carson, had just joined the Economics Department and he was enthusiastically encouraging everyone to look at CART (Classification and Regression Trees) and MARS (Multiple Adaptive Regression Splines), new analytical tools he had studied at Berkeley. He was also touting the marvelous advantages of cross-validation for assessing the true performance of predictive models.
So far as I know I was the only one in the department who took an interest in these radically new methods and I started experimenting mainly with CART. I had already founded Salford Systems several years earlier to market some statistical and econometric software I had developed while I was a grad- uate student at Harvard and I was looking for some new tools to expand Salford’s offerings. In 1990 I met Leo Breiman at a Joint Statistical Meetings of the American Statistical Association. Leo and I spoke about creating a PC-based commercial version of the CART software. With this conversation began a many-year email correspondence with Leo while I slowly worked my way through the 1984 Classification and Regression Tree monograph (by Leo Breiman, Jerome Friedman, Richard Olshen, and Charles Stone 1984). This correspondence, which also included Richard Olshen 1990–1992, helped me write an easy to follow introduction to the methodology and manual to Salford’s new version of the CART software. By 1992 we already had a far easier CLI (command line interface) developed using commands such as.
USE MYFILE MODEL TARGET KEEP X1 X2 X3 X4 LIMIT ATOM = 10 CATEGORY TARGET X1 CART GO
with software available for the major commercial UNIX platforms and the IBM PC.
During 1993 this product was marketed as a SYSTAT add-on module but Salford subsequently took over all responsibility for sales and marketing. We had also begun work on a full GUI interface. The first GUI CART with the trademark Salford navigator and drill down into nodes and other model details was released in 1995. At that time, we began extensive consulting work for three major US banks developing a variety of targeted marketing, credit risk, and mortgage default models on what were fairly large data sets for the time. We often dealt with 100,000 records or more, and typically started with 300 to 2000 predictors (and sometimes more!). Our largest training data sets had around three million records by 1997. Being early adopters of the DEC Alpha hardware line, we were already working with a true 64-bit UNIX 20 years ago, and we made the most of the RAM we could fit into our servers. In 1997 one of our banking customers subsidized our purchase of huge external disk storage for our servers: 100 2GB disk drives plus a number of redundant drives for hot swap replacement of failed drives. Our discount price: $225,000! (20 years later in 2017 you can buy this storage in a pair of $15 thumb drives). The cabinet was a beauty to behold, and it really it looked like it belonged on the space shuttle (Fig. 1.1.1).
Fig. 1.1.1 Salford systems data mining conference, March 2004, San Francisco Bottom row: Leo Breiman, Charles Stone, Richard Olshen, Jerome Friedman. Top row: Richard Carson, Dan Steinberg, Nicholas Scott Cardell
Our work for the banks was exciting in what it taught us about model building and analytics, and it provided a fantastic stress test bed for our soft- ware. Between 1990 and 1998, we fixed numerous exotic CART bugs that revealed themselves only when dealing with large complex data sets, and we thus developed a truly industrial strength product. One of our 1998 projects for an automobile manufacturer required us to predict which make and model a new car purchaser would select from a menu of some 400 options, and our battle-hardened CART had no difficulty handling our 250,000 row by 200 column data set with a 400 level target. We continually perfected and adapted the software in hundreds of ways, for example, to handle text data and optional user specified penalties on predictors due to missingness, cardinality, or cost of acquisition. The penalties act as inhibitors on the use of the predictors and made for better performing and more intuitively acceptable models. Many other enhancements were guided by our Director of Research and Development, Nicholas Scott Cardell often in close collaboration with Breiman and Friedman during the 1990s.
Also, in early 1995 I began a new round of email exchanges with Breiman about the ‘bagger’ (bootstrap aggregation of CART trees). Originally, Breiman wanted to cross-validate every tree in order to prune them all to the right size.
I thought that the computational burden was excessive and so I argued for using the OOB (out of bag) data for this purpose; Breiman ultimately also rejected cross-validation to find right sized trees in favor of using the largest possible (unpruned) tree and so the OOB data was leveraged to great advan- tage in his subsequent work on Random Forests. Salford was the first to implement bagging for decision trees in 1996 under the rubric of the COMBINE command.
Around 1999 I decided that our consulting work was hampering our soft- ware development and that we would henceforth focus almost exclusively on new software development. The timing was good for this as we began work on MARS in 1999 and in 2001 we tackled Gradient Boosting (TreeNet). We were well aware of Random Forests from its earliest incarnations, but devel- opment lagged behind due to lack of resources. Although 2001 experienced the shocks of the internet bubble crash and September 11th, Salford Systems grew throughout the crisis period in part by expanding our sales effort to include Australia and New Zealand. During the period 2001 through 2006 I toured the world at least 10 times giving lectures and presentations wherever I could, focusing mainly on gradient boosting but also on machine learning in general. My stops included universities, academic and commercial confer- ences, research groups in pharmaceutical companies and banks, as well as organizations such as the European Central Bank. Much to my surprise, we made very little headway persuading people to take gradient boosting seri- ously. A few large companies did absorb the message though and in conse- quence profited greatly from being early and well ahead of their competitors.
By 2007 we finally started to see a substantial increase in interest in our software, particularly by the major banks, and 2008 started to shape up as by far our best growth year ever. However, the general financial collapse put a stop to many of the contracts we were in the midst of negotiating and this also led to a contraction in our business. But internet marketing came to our rescue and we engaged in a successful major project to automate the targeted market- ing of web ads in an ad network. We made major advances in such targeted marketing leveraging a highly customized version of CART that included extensive within terminal node analysis. Coupled with a dedicated scoring engine we were able to rank 1000 potential ads in 6 milliseconds. The models were automatically rebuilt every 6 h on learning samples exceeding 1 billion impressions.
In 2010 we embarked on another major application adventure building a predictive modeling system for a large chain of Latin American grocery stores. Working with a network of close to 200 stores and 122,000 products our TreeNet models predicted daily and weekly sales for all promoted products.
The final system was fully automatic, rebuilding and refining models as required, and reducing typical sales prediction errors by at least 50%.
After this project we returned to our roots and began developing substan- tial upgrades to our core learning machines with an even sharper focus on model automation and developing Japanese, and Chinese language versions of SPM. By the time this history is published we will have released yet another major upgrade we are calling SPM8.2 and we will be well on the way to SPM9.0 which raises the automation of complex sequences of analyses to our highest level ever. 2017 and 2018 should also bring our distributed learning machines to market allowing users wanting to analyze data spread out over many servers to leverage the power of a cluster of servers working in parallel with all of the features and capabilities of CART, TreeNet, RandomForests and ensemble model combinations. This latest set of developments is one we are especially eager to deliver as it opens up entirely new horizons for our 26-year research adventure and begins our latest chapter as a subsidiary of statistical and quality control software specialist Minitab.
Acknowledgments The full history involves many more events and people than I have had room to mention in this abbreviated note. Richard Olshen was a constant source of technical advice to us and provided a fabulous overview of Leo Breiman’s work and character in his paper in Statistical Science. Charles Stone was instrumental in helping our adventure result in real world results as well as always being available to give us sage technical advice. I hope others understand that the Salford story is principally bound up with Breiman, Friedman, Olshen, and Stone and they remain the principal subject of this brief essay.
1.4 Machine Learning in Ecology and Wildife Biology to Date
In this book, we will present several cases of how machine learning can be used effectively in ecological studies. It expands on a growing body of literature demon- strating how machine learning can help ecologists and natural resource managers (e.g., Recknagel 2001; Olden et al. 2008; Crisci et al. 2012; Thessen 2016; Valletta et al. 2017), and picks up after Fielding’s seminal book on machine learning in ecol- ogy when it was still in its infancy in our field (Fielding 1999). We have a good understanding of the current state of machine learning in ecology thanks to these aforementioned works and can therefore start plotting a course forward in the imple- mentation of these methods.
In the disciplines of natural resource management, ecology, and conservation biol- ogy, machine learning remains somewhat absent as evidenced by the lack of discus- sion on the topic in current textbooks: Primack (2010) for conservation, Miller and Spoolman (2012) for environmental studies, Silvy (2012) for wildlife biology, Gill (2007) for ornithology and even in animal physiology (Moyes and Schulte 2007).
Most of the advancements in machine learning in ecology lie in the scientific literature (e.g., Elith et al. 2006; Hochachka et al. 2007; Drew et al. 2011). Thus, prior to gradu- ate studies, machine learning techniques for ecological data are inaccessible to stu- dents unless they make a point of learning it on their own or take a specialized course.
Beyond this, it is only recently that computing methods have begun to be taught in University courses for ecologists. More and more, “quantitative ecology” courses (usually taught with the R programming language), are becoming commonplace.
However, machine learning methods are not always integrated into these courses, and when they are, they are often glossed over with regards to the fine-scale detail of their inner-workings.
Further Readings
Breiman L, Friedman J, Olshen R, Stone C (1984) Classification and regression trees. Pacific Grove, Wadsworth
Breiman L (1996) Bagging predictors. Mach Learn 24:123–140
Friedman JH (1991) Multivariate adaptive regression splines (with discussion). Ann Stat 19:1–141 Friedman JH (1999) Stochastic gradient boosting. Statistics Department, Stanford University,
Stanford
Friedman JH (1999) Greedy function approximation: a gradient boosting machine. Statistics Department, Stanford University, Stanford
Olshen R (2001) A Conversation with Leo Breiman Stat Sci 16(2):184–198
Steinberg D, Colla P (1995). CART: Tree-structured non-parametric data analysis. Salford Systems, San Diego
Seigel E (2016) Predictive analytics: the power to predict who will click, buy, lie, or die, Wiley Publisher, New York
This disconnect between machine learning, computing, ecology and science- based conservation management has led to missed opportunities in our opinion at a time when the environment is facing rapid changes and efficient solutions are required. While we press forward with massive resource exploitation for the sake of
“modernity” (Alexander 2013), biodiversity is being lost at alarming rates. This is partly because we have yet to adopt precautionary approaches to management, but also possibly because we spend valuable time debating mechanisms and methods instead of combining or comparing all available methods for a full understanding of our ecosystem. This has led us far away from embracing holistic views of natural resource management (Rosales 2008; Sandifer et al. 2015) that may be possible by integrating our thinking with machine learning.
Machine learning can easily be used in a huge array of applications (Hastie et al. 2009; Mueller and Massaron 2016); the method represents a true paradigm shift in statistics, wildlife management and conservation. Data mining, predictions and classifications are amongst its most common applications (Hastie et al. 2009);
specifically, when data are complex, not normally distributed (statistically), and
‘messy’ (as is typical in ecological and environmental data; McArdle 1988;
Breiman 2001a). Machine learning also works on big and small datasets, lending to their versatility across many fields. The application of machine learning to spa- tial and global data carries a specific benefit in that it can help to show the lack of space and resources available on earth (Wackernagel et al. 2002; Humphries and Huettmann 2014). This could potentially resolve these space and resource conflicts with a fast turn-around time (“rapid assessment”, Huettmann 2007; Kandel et al. 2015 for an example). Whereas, traditional reductionist views have failed to deliver us suc- cessful solutions in this respect (as is obvious with respect to the state of the environ- ment, Rockstroem et al. 2009, Mace et al. 2010). A shift in our strategy for wildlife management is needed.
Currently, machine learning in ecology is mostly restricted to species distribu- tion modeling (SDM; Elith et al. 2006, Guisan and Thuiller 2005, and many oth- ers) where georeferenced occurrences or abundances of species are associated with layers of environmental data (e.g., topography, precipitation). Those asso- ciations are modeled with algorithms like maxent (Phillips et al. 2006), or ran- dom forests (Breiman 2001b) and then predicted to the spatial and temporal extent of those layers of environmental data to determine where species might occur in space (and time). This has been boosted by increases in computing power, allowing us to model more complex data at higher temporal and spatial resolutions (Cushman and Huettmann 2010; Watson et al. 2016). See Textbox 1.2 for a brief example.
Beyond SDMs, machine learning has been increasingly used in species recogni- tion applications. These could be audio recognition exercises (Armitage and Ober 2010; Stowell and Plumbley 2014, Chap. 15), or species recognition from images (Goodwin et al. 2014; Rosa et al. 2016). Machine learning algorithms have also been applied to a lesser degree to animal behavior (e.g., Valletta et al. 2017), and population dynamics modeling (e.g., Recknagel et al. 2002). A review of some of these and other applications can be found in Thessen (2016).
Textbox 1.2 Cheer Pheasant predictions in the Hindu-Kush Himalaya:
What does machine learning bring to the table for wilderness regions, endangered species and the future?
Falk Huettmann and co-authors1
EWHALE lab, University of Alaska Fairbanks.
e-mail: [email protected]
Wilderness regions of this world are precious for mankind, but they often lack protection and support. Still, they are the ultimate goal when it comes to natural resource conservation management. Wilderness is nature at its finest, and it needs to be assessed and managed for future generations. The state of wilderness (untouched habitat by humans) and its global extent reflects how humans man- age the Anthropocene. But how does that link with machine learning, so far?
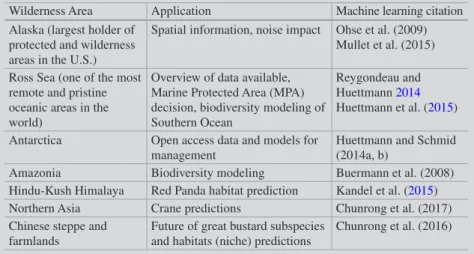
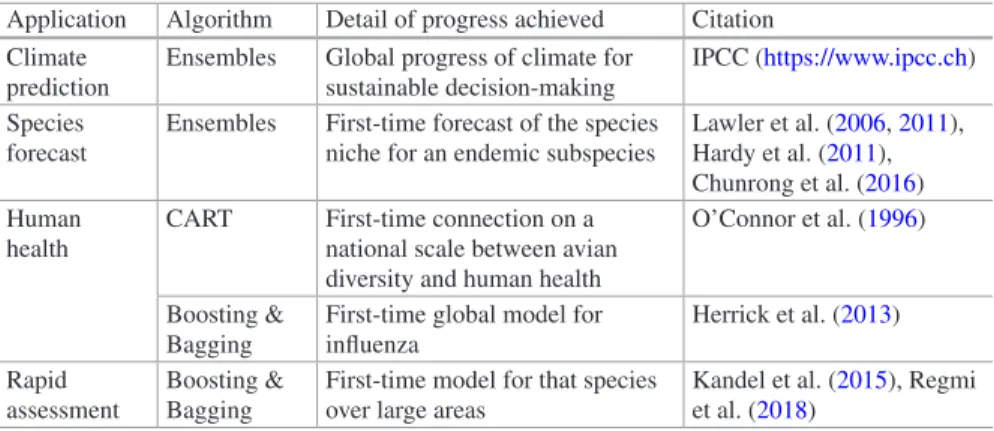
Well, while still at its infancy, machine learning has already been used success- fully in wilderness region management worldwide (Table 1.2.1 for overview).
The Cheer Pheasant (Catreus wallichii)) is a great example of a rare bird species of global concern living in the wilderness of the western Hindu Kush Himalaya region, at around 3000 m of altitude. Its life history is somewhat known (Garson et al. 1992), but probably quite outdated, and its exact distri- bution lacks a lot of information, with animals being dispersed over many countries. Besides new threats such as climate change, this species is strongly hunted and poached, and some local cultures see it as a medical cure against certain ailments. The global population of the species is declining (BirdLife International 2017), and its conservation status is likely to decay.
In an ongoing study (Kandel et al. in prep) we found that machine learning has helped to compile all publicly available data for this species, and then sparked the
1 This work was carried out with the Global Primate Network in Nepal, namely Ganga Ram Regmi, Madan Krishna Suwal, Dikpal Krishna Karmacharya, Kamal Kandel and Sonam Tashi Lama.
Table 1.2.1 Machine learning applications in wilderness regions and their future
Wilderness Area Application Machine learning citation
Alaska (largest holder of protected and wilderness areas in the U.S.)
Spatial information, noise impact Ohse et al. (2009) Mullet et al. (2015) Ross Sea (one of the most
remote and pristine oceanic areas in the world)
Overview of data available, Marine Protected Area (MPA) decision, biodiversity modeling of Southern Ocean
Reygondeau and Huettmann 2014 Huettmann et al. (2015) Antarctica Open access data and models for
management
Huettmann and Schmid (2014a, b)
Amazonia Biodiversity modeling Buermann et al. (2008)
Hindu-Kush Himalaya Red Panda habitat prediction Kandel et al. (2015) Northern Asia Crane predictions Chunrong et al. (2017) Chinese steppe and
farmlands
Future of great bustard subspecies and habitats (niche) predictions
Chunrong et al. (2016)
interest on the issue of cheer pheasant conservation and put it on the wider agenda.
Some progress might be made to help bring this species back using some innova- tive machine learning techniques (e.g., automated occurrence/density sampling in space/time, holistic species distribution modeling) The findings from this study further support the need for science-based management (Fig. 1.2.1).
It is easy to understand that machine learning provides progress to a subject that stalled for over a decade and where the usual set of quantitative analysis cannot provide much further progress. The projects and analyses shown in Table 1.2.1 do not only provide analytical advances but also emphasize the need to improve data collection and management. Perhaps this is one of the biggest improvements provided by machine learning. But as Table 1.2.2 shows, machine learning has not reached its potential yet and more is to be done, it must, if we want to maintain the biodiversity in the globe and its ecological services.
Last but not least, machine learning can be used for future predictions (e.g. Chunrong et al. 2016, Suwal et al. in review), but also for adaptive man- agement progress (Huettmann 2007). We find that, by now, machine learning has shown its benefits and applicability in conservation and awaits urgently to become the analytical platform of choice, worldwide.
Fig. 1.2.1 Cheer pheasant (Catreus wallichii; left) and its habitat (right) in the Himalayan region
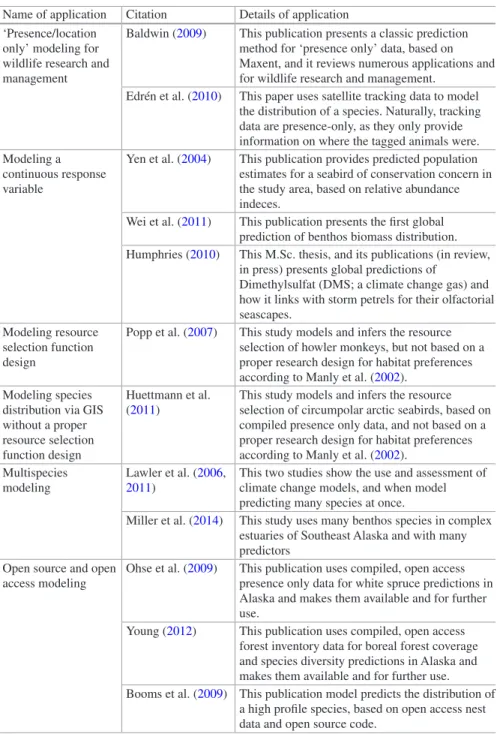
Table 1.2.2 A selection of machine learning applications and steps of future relevance for natural resource management applications (for citations and applications see chapters throughout this book and references within). These applications can be applied anywhere around the world and at any temporal or spatial scale pending data availability
Application topic How done Why needed
Data mining Mining of compiled databases Obtain best available information Species distribution
modeling (SDM)
Species-habitat models Spatial information as the basis of management Remote sensing-based
habitat classification
Classification algorithm Detailed habitat management requires ‘maps’
Climate models Climate data numerical models Climate as the key topic for human well-being
Forecasting Prediction Pre-cautionary management
Impact predictions Prediction Pre-cautionary management
References
BirdLife International (2017) Catreus wallichii (amended version of 2016 assessment). The IUCN Red List of threatened species 2017
Buermann W, Saatchi S, Smith TB, Zutta BR, Chaves JA, Milá B, Graham CH (2008) Predicting species distributions across the Amazonian and Andean regions using remote sensing data. J Biogeog 35:1160–1176
Chunrong M, Huettmann F, Guo Y (2016) Climate envelope predictions indicate an enlarged suitable wintering distribution for Great Bustards (Otis tarda dybowski) in China for the twenty-first century. PeerJ 4:e1630
Chunrong M, Huettmann F, Guo Y, Han X, Wen L (2017) Why choose Random Forest to predict rare species distribution with few samples in large undersampled areas? Three Asian crane species models provide supporting evidence. PeerJ 5:e2849
Garson PJ, Young I, Kaul R (1992) Ecology and conservation of the Cheer pheasant (Catreus wallichii): Studies in the wild and the progress of a reintroduction project. Biol Cons 59:25–35
Huettmann F (2007) Modern adaptive management: adding digital opportunities towards a sustainable world with new values. Forum on public policy: climate change and sustain- able development 3:337–342
Huettmann F, Schmid M (2014a) Climate change and predictions on pelagic biodiversity components. In: De Broyer C, Koubbi P (eds), with Griffiths H, Danis B, David B, Grant S, Gutt J, Held C, Hosie G, Huettmann F, Post A, Ropert-Coudert Y, van den Putte A. The CAML/SCAR-MarBIN BIOGEOGRAPHIC ATLAS OF THE SOUTHERN OCEAN. Scientific Committee on Antarctic Research (SCAR), Cambridge, pp 390–396 Huettmann, F, Schmid M (2014b) Publicly available open access data and machine learning
model-predictions applied with open source