HEIGHT AND ECONOMIC DEVELOPMENT IN SPAIN, 1850-1958
RAMÓN MARÍA-DOLORES JOSÉ MIGUEL MARTÍNEZ-CARRIÓN
FUNDACIÓN DE LAS CAJAS DE AHORROS DOCUMENTO DE TRABAJO
Nº 556/2010
De conformidad con la base quinta de la convocatoria del Programa de Estímulo a la Investigación, este trabajo ha sido sometido a eva- luación externa anónima de especialistas cualificados a fin de con- trastar su nivel técnico.
ISSN: 1988-8767
La serie DOCUMENTOS DE TRABAJO incluye avances y resultados de investigaciones dentro de los pro- gramas de la Fundación de las Cajas de Ahorros.
Las opiniones son responsabilidad de los autores.
1
HEIGHT AND ECONOMIC DEVELOPMENT IN SPAIN, 1850-1958
Ramón María-Dolores*
José Miguel Martínez-Carrión**
Abstract
This paper investigates the relationship between height and economic development in Spain in the modern period. The relation is investigated using recently constructed times series with recruitment data of conscripts. We observed changes in average height along the analyzed period. These variations could be explained by different indicators of economic development such as for consumption of hygiene products, for deflator of private consumption, income per capita, schooling rate, infant mortality and trade (grade of openness). We model human stature as a Vector Autoregressive Model (VAR) and we proceed to estimate a Vector Autoregressive Equilibrium Correction Model (VECqM) to quantify the height response to different changes in the different explanatory variables. The analysis shows that there is a long- run relationship between height, income, and other indicators of economic development in Spain as consumption of hygiene products, and openness.
Key words: Height, health, income, education, economic development,
cointegration.
JEL classification: I1, I3, N3, N9
Corresponding author: Ramón María-Dolores. Departamento de Fundamentos del Análisis Económico. Facultad de Economía y Empresa. Campus de Espinardo 30100. e-mail:
* Departamento de Fundamentos del Análisis Económico. Facultad de Economía y Empresa.
Campus de Espinardo 30100. e-mail: [email protected]
** Departamento de Economía Aplicada. Facultad de Economía y Empresa. Campus de Espinardo 30100. e-mail: [email protected]
Acknowledgements: This paper has been made with support of project SEJ2007-67613 y HAR2010-20684-C02-02 financed by the Ministry of Science and Technology (Government of Spain). We are grateful to M. Camacho, R. Esteves, J. Jacobs, J. Komlos, G. Quiroga, N.
Koepke, L. Prados de la Escosura, and H. Simón for their useful comments.
2
1. Introduction
In the last decades anthropometric history has improved our knowledge on the quality of life of populations. The use of stature and other anthropometric indicators is widely accepted by economic historians and recently by economists to measure aspects of the human well-being and to explore the impact of socioeconomic processes on the biological welfare and health outcomes (Fogel, 1994; Komlos, 1994, 1995a; Steckel 1995, 2009; Steckel and Floud, 1997). Some of the topics mainly debated are the determinants of the height and the relationships between stature and the indicators of economic development.
A high degree of correlation between height and economic development was early observed in developing countries in the second half of the 20
thcentury (Steckel (1979, 1983). Later contributions have clarified the existing relations among height, income per capita, and income inequality in the long term (Brinkman et al, 1985; Drukker and Meerten, 1995; Coll, 1998; Craig and Weis, 1998; Haines, 1998; Jacob and Tassenaar, 2004; Moradi, 2010; Peracci, 2008).
In the last years, a wide battery of indicators on livings standard is used to measure their relationships with the height, resulting in important contributions between health, mortality, and economic development (Easterlin, 2000; Arora, 2001; Deaton, 2003, 2007; Fogel, 2004; Lopez-Casanovas et al, 2005; Persico, Postlewaite and Silverman, 2004; Steckel, 2008)
In the cross-sectional analyses the correlations between height and levels of
economic development are positive and almost perfect, at least in the
populations of the pre-industrial past (Komlos, 1995b, 2003). However, in the
longitudinal analyses the correlations are more controversial. Early papers
established that the temporary series of income per capita could explain the
variations in the changes of heights by ages and that the stature can be used as
a proxy of the income in information absence on the material well-being
(Brinkman and Drukker, 1985), although it is well known that both indicators did
not necessarily evolve in parallel. There are many papers which studied this
relationship in the world economic history. Several papers find that height
3
tended to increase in developing countries in Europe, North America, and Japan in the late 19
thand early 20
thregardless of the level of industrialization (Sandberg and Steckel, 1997, Weir, 1997, Shay, 1994, Honda, 1997, Baten, 2000, Federico, 2003, Vecci and Coppola, 2006, Arcaleni, 2006). The height declined, however, in the United States, England, and the Netherlands while industrialization was proceeding at the end of 18
thand the first half of the 19
thcentury (Margo and Steckel, 1983; Floud et. al, 1990; Komlos, 1998, Haines, 2004). Nevertheless, there is a consensus about an international convergence in biological welfare and other non-income indicators of the standard of living during the 20th century (see Kenny, 2005, Deaton 2007, 2008). The main reason is that the stature is also influenced -among other variables- by the conditions of health in childhood and adolescence, maternal education, public policies of social welfare, child work, geography, and cultural values (Komlos and Baten 1998; Schutkowski, 2008, Steckel, 2009).
The relationships between height and economic development have also
found echo in Spain. The first studies of anthropometric history were led by
economic historians who explored this issue with panels of data from military
sources and different methods. Thus, Gómez-Mendoza and Pérez-Moreda
examined the relationship between height and educational attainment and infant
mortality in the early twentieth century. These authors compared the average
height of recruits by province published in Anuarios Estadísticos de España with
the economic performance and with the infant mortality of the region (Gómez-
Mendoza and Pérez-Moreda, 1995). Martínez-Carrión explored the trends of
height and income between 1850 and 1990 from local recruitment data of
conscripts (Martínez-Carrión, 1994, Martínez-Carrión and Pérez-Castejón
2000); and Quiroga and Coll (2000) discussed height differences as a proxy for
income inequality and that changes within the differences of heights among
social groups could indicate shifts in income inequality. Given the limitations
posed by some conventional indicators of welfare, the possibilities opened up
by anthropometric studies are wide-ranging and relevant to the economic and
social history of contemporary Spain.
4
Recently, using both Spaniards height data panels from the Encuesta
Nacional de Salud (Spanish National Health Survey) and dataset of theEuropean Community Household Panel (Eurostat), economists and demographics presents new evidence on the evolution of adult height and weight (García and Quintana-Domeque 2007, 2009). On the one hand, the influence of generational or environmental effects on adult height has been evaluated and the mechanisms through which socio-economic position may influence individuals’ height have been discussed (Costa-Font and Gil, 2007;
Spijker, Pérez and Cámara, 2008). On the other hand, the determinant of heights during a period of significant social-economic transformation (1960- 2000) has been explored. Results suggest that the epidemiological transition before the Spanish entry into the European Union led to improvements in adult height (Bosh, Bozzoli and Quintana-Domeque, 2009).
Parallelly, Spanish economic growth has been revised in the last years.
According to estimates of Prados de la Escosura, Spain underperformed over the long run mostly due to its sluggish growth in the hundred years up to 1950.
Higher destruction of human rather than of physical capital during the Spanish Civil War (1936-1939) and its aftermath explain its performance during the 1940s and 1950s. The 1940s constituted a phase of delay in the Spanish economy. This economy has been catching up with advanced countries over the last fifty years in which 1959-74 stand out as a period of outstanding performance (Prados de la Escosura, 2003, 2007).
The comparison between the behavior of the Spanish economy and the most
advances nations of Western Europe reveals that Spain was located in a
position near ¾ parts of the level of the product by European inhabitant and in
the middle of the North American. The marked reduction of the Spanish relative
position as a result of the civil conflict of 1936-39 would improve in the 1950s,
but Spain did not reduce distances with developed nations. According to new
estimates Spain’s GDP per head stood at 50.4 percent of that of the United
States in 1933 and decreased to 35 percent in the 1950s. The move towards a
pro-market attitude with de-regulation and the gradual opening up of Spain to
the international economy resulted in sustained growth and catching up with
5
Western Europe during the second half of the twentieth century. A dramatic growth slowdown followed by a sustained catching up, separated by 1986 -the year of Spain’s accession to the European Union- characterized the last quarter of the twentieth century (Prados de la Escosura, 2007).
This paper analyses the relationship between physical stature and economic development for Spain with new data of conscripts’ height. It takes into account several development indicators such as income per capita, real consumption of hygienic products and medical services, price of consumption goods, schooling rate, mortality, and degree of openness which could potentially influence physical stature in the period 1850-1958.
In this paper we try to answer the following questions on the basis of anthropometric data from military records: (i) what are the long-run trends of height in Spain? and (ii) what are the main determinants of changes in Spaniards´ height ? We focus on Spanish males as no long-run information is available on female heights over the long-run. The rest of the paper is organized as follows. Section 2 describes the data employed in this study.
Section 3 investigates the determinants of changes in heights in Spain for the period 1850-1978 through the estimation of a Vector Auto-Regressive (VAR) with a Vector Equilibrium Correction Model. Finally, section 4 concludes.
2. Data description
2.1. Height
For height, standardized time-cohort series can be constructed for Spain from the 1850s onwards
1. Data for the early 19
thcentury are both scarce and fragmentary, and almost non-existent before the end of the eighteenth century.
The first recruitment is carried out in 1770 (with the Monarchy of Carlos IIII).
During the last decades of 18
thcentury, the replacements of the Spanish
1 A recent state of the art on the sources of stature data and on anthropometric history in Spain, to see the monographic number of the journal Agrarian History, 47, coordinated by Martinez- Carrión (2009).
6
conscripts are formed by men aged between 16-40 years. In the first decades of the 19
thcentury the conscription happened to be formed by men of 16-25 years old. It’s necessary to hope the decade 1850s recruitment to find conscripts of a single age: 20 years (1850-1885), 19 years (1885-1900), 20 years (1901-1906) and 21 years (1907-1970). The main sources for an anthropometric study of long-run cohort series in Spain are the Local Military Recruitment Acts –LMRA- (the original records is named Actas de clasificación de los mozos y declaración
de soldados, Actas de Reclutamiento y Reemplazo).This data sources and records are preserved in the Sección de Quintas of local historical archives of the municipalities. Data sample reported here were obtained from such records.
Our data samples include records of all young men who were examined for conscription in 19 municipalities from three geographical regions (Andalusia, Region of Murcia and the Valencian Community) or five provinces distributed by the Spanish Levant: Vera (province of Almeria); Region of Murcia: Cartagena, Cieza, Murcia, Mazarrón, Totana, Torre-Pacheco Yecla (province of Murcia);
Alcoi, Elche, Orihuela, Pego, Villena (province of Alicante): Alzira, Gandía, Requena, Sueca (province of Valencia); Castellón y Villareal (province of Castellón). The municipalities are representatives of socio-economic environments different, some of which they are formed by cities, towns and villages.
In Spain the height of all men were measured at the age of conscription beginning in the 1850’s decade. The stature is expressed in millimeters. The height of the young men was measured by a tallador, administrative personnel of the City council. Data sources also contain information over occupation, place of birth and address (if they emigrated).
Data series here presented is a good proxy for height at the national level
because their economic and environmental characteristics are considered
representative of the Spanish economy of the 19th and 20
thcenturies. Several
studies on total productivity, labor productivity, income per capita, well-being
and inequality, locate Levant populations in the average threshold of Spain
(Domínguez, 2002; Germán, Llopis, Maluquer, Zapata, 2001; Núñez, 2005).
7
Our sample is representative of the Spanish average. Several anthropometric studies find that the stature averages of Valencia and Murcia regions are nearer to height average of the Spaniards: Estimates of average height in the replacements of 1915-29 and 1965-80 reflect the height average of Spain in these analyzed periods (Gómez-Mendoza and Pérez-Moreda, 1995: 85;
Martínez-Belmonte 1983; Martínez-Carrión, 1994: 697; Rebato, 1998).
We construct average height for each cohort by year of birth. The new series of height on Spanish men that we present in this paper contains data of 328,248 conscripts who were listed and measured between 1857 and 1969 to ages of 19-21 years. The backgrounds of these series are in previous works elaborated by Martinez-Carrión and Perez-Castejón (1998, 2000) and the recent dataset of Gil-Puche (2009) presented in his doctoral dissertation
2. The new series on human height in Spain links with the national series elaborated by the Statistics of Recruitment and Replacement of the Armies (Estadísticas del Reclutamiento y Reemplazo de los Ejércitos) from 1954 and estimated by Coll and Quiroga (1994) and Quiroga (2003a).
The most significant problems facing the literature on height that uses military information are: (i) changes in the recruitment age and (ii) the minimum height requirements for military service. In Spain, however, all potential recruits were measured before they were declared fit for military service or not as there was a universal draft, so there is no selective bias from a truncated distribution.
With reference to the first problem in height series posed by the introduction of changes affecting conscription age and by the rounding of height data, it has been addressed by using standardized heights at age 21 taking into account estimations of growth
3. Data here are presented by cohorts of births. We built a new height series using five-years moving averages standardized at the age of twenty one years.
2 Dataset is composed by 141,861 observations with height data. See doctoral thesis of Puche- Gil (2009), to whom we are grateful to provide us the data.
3 On height standardized at the age of 21years, see Martínez-Carrión and Moreno-Lázaro (2007).
8
How representative is our evidence? In other papers the reliability of data has been ascertained using the Kolmogorov-Smirnow and similar tests
4. In this occasion data are normally distributed or Gaussian and do not suffer from typical truncation problems.
2.2. Income and other measures of welfare
For real income, we use the annual series of Spanish GDP per head at constant 1995 prices in pesetas provided by Prados de la Escosura (2003). His recent estimates on the economic growth show that in Spain there were three main phases in the long-run economic development: 1850-1950, 1951-1974 and 1975-2000, with a shift to a lower level during the first period as a consequence of the Civil War of 1936-1939. Phases or long swings in which growth rates differ from the long run trend as a result of economic policies, access to international markets, and technological change can be distinguished.
During the first phase, 1850-1883, the growth rate of GDP per capita was well above the nineteenth century’s average. A slowdown in growth took place between the mid 1880s and 1920.
The most intense growth of the period was achieved in the 1920s that coincided with Primo de Rivera Dictatorship (1923-1929). This was a period of institutional stability that provided a favorable environment for investment and business. Lastly, a fourth long swing took place between 1929 and 1952. The Civil War (1936-39) had a negative impact in the later growth, reducing the product per capita near 15% of the secular growth rate (Prados de la Escosura, 2003: 148). The weak recovery of the period 1944 - 1952 stands out in the international context. In spite of World War II, European economies achieved an average growth rate of 1.4 compared with Spain’s 0.6 during the 1940s.
Spanish economy did not recover pre-war GDP levels until 1951 (absolute terms), and 1955 (per capita terms). The change in trend which began in 1951
4 Martinez Carrión and Pérez Castejón (2000) use a sample of the height of 127.310 conscripts out of a total of 141.911 men (89.7 per cent) called up for service. This height series has a high correlation with Quiroga‘s height series for the same sample period (0.95); see Quiroga (2003a). On height standardized at the age of 21years, see Martínez-Carrión and Moreno- Lázaro (2007).
9
ushered in an exceptional phase of rapid growth which lasted until 1974. As in other countries in the European Periphery during the Golden Age (1950-1973), the main spurt of economic growth in Spain was delayed until the 1960s.
Catching up took place in the late twentieth century, in which the years 1959-74 stand out as a period of outstanding performance (Prados de la Escosura, 2007).
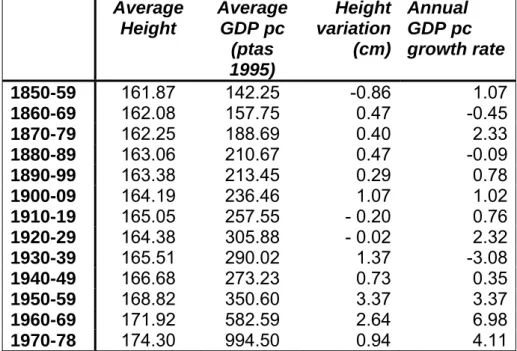
Table 1: Average height and GDP per head (1850-1978)
AverageHeight
Average GDP pc
(ptas 1995)
Height variation (cm)
Annual GDP pc growth rate
1850-59 161.87 142.25 -0.86 1.07
1860-69 162.08 157.75 0.47 -0.45
1870-79 162.25 188.69 0.40 2.33
1880-89 163.06 210.67 0.47 -0.09
1890-99 163.38 213.45 0.29 0.78
1900-09 164.19 236.46 1.07 1.02
1910-19 165.05 257.55 - 0.20 0.76
1920-29 164.38 305.88 - 0.02 2.32
1930-39 165.51 290.02 1.37 -3.08
1940-49 166.68 273.23 0.73 0.35
1950-59 168.82 350.60 3.37 3.37
1960-69 171.92 582.59 2.64 6.98
1970-78 174.30 994.50 0.94 4.11
Sources: Prados de la Escosura (2003) and Martínez-Carrión and Puche-Gil (2009).
Figure 1 compares the evolution of GDP per head and the height for the
period 1850-1978. GDP per head refers to the year in which recruits were
measured. Our results do not reveal a clear relationship between both series
until the end of the 19th century, when similarities between the two series
increased. Nevertheless, that relationship also seems to be high for the period
1900-1920. We obtain a correlation of 0.91 between both series for the whole
sample period. Table 1 shows the average height and GDP per cápita for each
different decade together with their variations. The lack of correlation between
income and height during the initial stages of modern economic growth may
10
well be related to Kuznets’ inverted U hypothesis, namely that income inequality rises and then falls with the level of economic development. Recent research observes a long-term rise in the inequality index during the early phase of globalization that peaked by World War I (Prados de la Escosura 2008). With other databases of Spanish recruits, Quiroga and Coll (2000) show a long term increase in heights inequality among socio-professional groups between the turn of the century and World War I. Martínez-Carrión and Moreno-Lazaro (2007) demonstrate that inequality trends between rural and urban areas increased during the late nineteenth century. The Spanish case could support this hypothesis already verified in other countries during early industrialization and the first stages of economic growth.
160 162 164 166 168 170 172 174 176
0 200 400 600 800 1000 1200 1400 1600
50 60 70 80 90 00 10 20 30 40 50 60 70
HEIGHT GDPPC
Figure 1: Relationship between height (birth year) and GDP per capital (pesetas 1995), 1850-1978
Source: Prados de la Escosura (2003) and Martínez-Carrión and Puche-Gil
(2009).
11
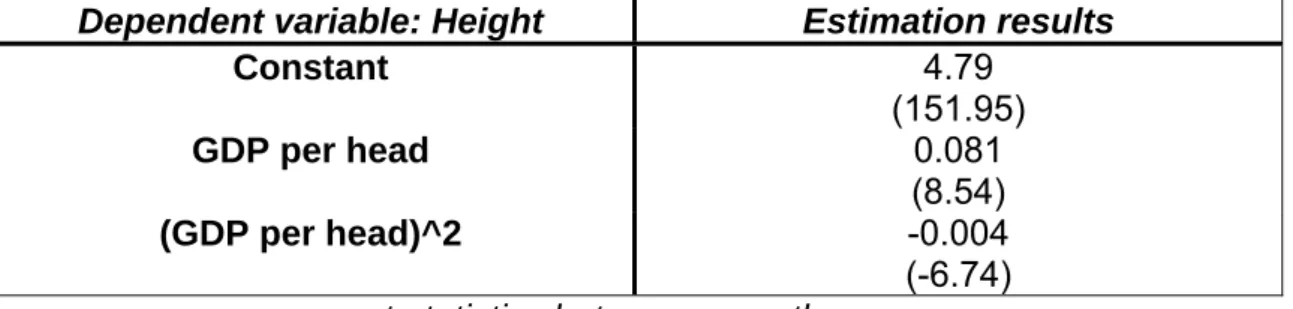
Figure 2 shows a scatter plot of the available data for height (in logs) and GDP per head (in logs) for the period 1850-1978. We also fit a nonlinear regression of height as a function of GDP per head and we observe that the relationship between them is concave, as expected. Table 2 offers the main results of this regression.
160 164 168 172 176
0 2000 4000 6000 8000 10000 GDPPC
HEIGHT
Log HEIGHT vs. Log GDPPC
Figure 2: Height (y-axis) versus GDP per head (x-axis), 1850-1978
Table 2: Relationship between Height (in logs) and GDP per head (in logs)
Dependent variable: Height Estimation results
Constant 4.79
(151.95)
GDP per head 0.081
(8.54)
(GDP per head)^2 -0.004
(-6.74)
t-statistics between parentheses12
The literature on height and economic growth has shown the importance of using anthropometric measures linked to different dimensions of health and standard of living. Recently, studies shows the beneficial effects such as nutritional improvements, comprehensive health care, health awareness and suitable housing conditions may all potentially translate into height improvements (Komlos and Lauderale 2007). With reference to these lines of research, we use two different measures of consumption directly related to health: consumption of hygienic products (personal care and medical services) and the price level of consumption goods. These series are only available up to 1958 and are provided by Prados de la Escosura (2003) at constant 1995 prices. Following the interest in the relationship between mortality and height (Fogel 2004), we employ the mortality rate from 1858 to 1980 (Nicolau, 2005:
124-6; Carreras and Tafunell, 2005).
5 10 15 20 25 30 35 40 45
160 162 164 166 168 170 172 174 176
50 60 70 80 90 00 10 20 30 40 50 60 70
MORT HEIGHT
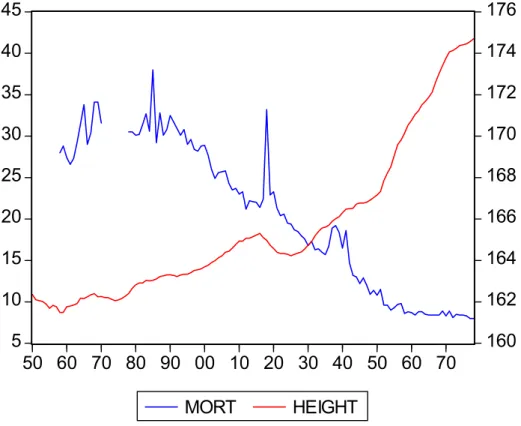
Figure 3: Relationship between height and Mortality rate
13
160
162 164 166 168 170 172
0 50000 100000 150000 200000 250000 300000
50 60 70 80 90 00 10 20 30 40 50
HEIGHT CONSHIGC
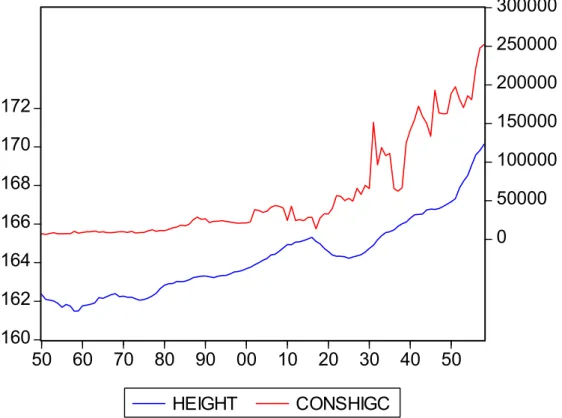
Figure 4: Relationship between height and Real Consumption of hygiene products
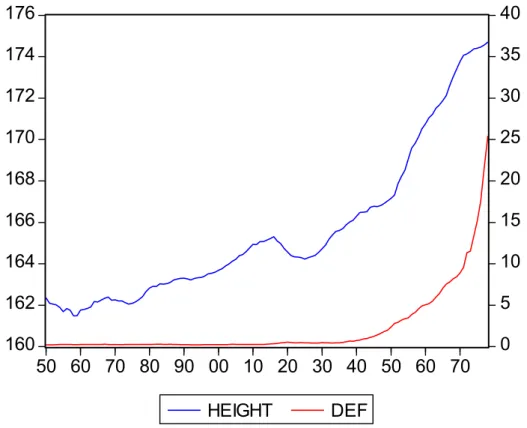
160 162 164 166 168 170 172 174 176
0 5 10 15 20 25 30 35 40
50 60 70 80 90 00 10 20 30 40 50 60 70
HEIGHT DEF
Figure 5: Relationship between height and private consumption deflator
14
Table 3: Average height and Health Indicators (1850-1978)
Average Height
Mortality Consumption of hygiene products
Deflator for private
consumption
1850-
59
161.87 28.4 0.50 74.36
1860- 69
162.08 30.3 0.59 79.43
1870- 79
162.25 30.9 0.60 99.45
1880- 89
163.06 31.6 1.09 107.93
1890- 99
163.38 30 1.26 105.38
1900- 09
164.19 25.6 1.87 112.85
1910- 19
165.05 23.4 1.33 112.73
1920- 29
164.38 19.7 2.39 144.96
1930- 39
165.51 17.2 3.99 122.13
1940- 49
166.68 13.5 5.97 117.31
1950- 59
168.82 9.6 6.97 138.20
1960- 69
171.92 8.5 - -
1970- 78
174.30 8.3 - -
Sources: Height, table 1; mortality, Nicolau (2005); consumption of hygiene products and deflator for private consumption, Prados de la Escosura (2003)
Figures 3-5 plot the relationship between stature, mortality rate,
consumption of hygiene products and deflator for private consumption,
respectively. We observe how the relationship between GDP per head and
mortality rate is clearer after the Civil War although it is also high during the rest
of the sample period (see Table 3). The effects of the flu epidemic in 1918 and
the Civil War 1936-39 were immediately shown in the mortality series and also
influenced the height of next generations of conscripts, measured during the
15
1933-1959 period. With regard to the real consumption of hygiene products we observe a high value of the correlation coefficient for hygiene products (0.86).
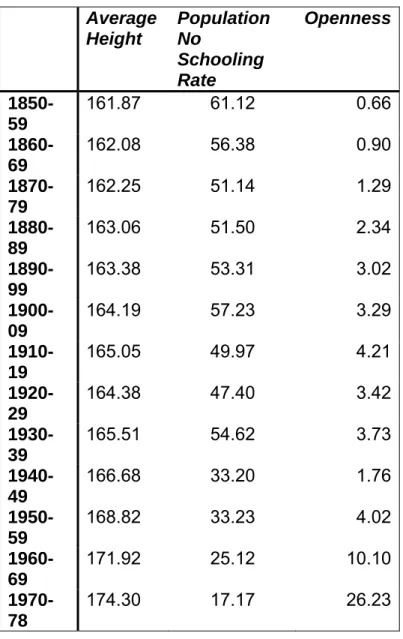
Table 4: Average height and Other Standard of Living Indicators (1850-1978)
Average Height
Population No
Schooling Rate
Openness
1850- 59
161.87 61.12 0.66
1860- 69
162.08 56.38 0.90
1870- 79
162.25 51.14 1.29
1880- 89
163.06 51.50 2.34
1890- 99
163.38 53.31 3.02
1900- 09
164.19 57.23 3.29
1910- 19
165.05 49.97 4.21
1920- 29
164.38 47.40 3.42
1930- 39
165.51 54.62 3.73
1940- 49
166.68 33.20 1.76
1950- 59
168.82 33.23 4.02
1960- 69
171.92 25.12 10.10
1970- 78
174.30 17.17 26.23
Sources: Height, Table 1; population no schooling rates, Núñez (2005: 232- 236); openness, (Tena, 2005: 628-30)
The relationships between stature and human capital measured by the
levels of education, schooling of children, and literacy rates have received the
attention of specialists (Meyer and Selmer, 1999; Schultz 2003). Recently, Case
and Paxson (2008) have recognized that height is associated with one better
16
physical and mental health and cognitive ability. We have also included some education variables such as the schooling rate (Núñez, 2005). Spanish historians have indicated that the education and the human accumulation of capital in Spain have been delayed processes, very unequal in men and women at least until 1960. It constitutes a factor that explains part of the historical delay, relatively compared with the development in other European countries.
Although studies demonstrate that literacy process spread widely and height average increased in the course of first half of century XX, there was inequality increase between literate and illiterate conscripts after the Civil War, what is confirmed by the divergence in stature by both access to education and deterioration of signatures quality of Spanish recruits (Martínez-Carrión and Puche-Gil, 2009; Quiroga, 2001: 616-617).
0 10 20 30 40 50 60 70 80
160 162 164 166 168 170 172 174 176
50 60 70 80 90 00 10 20 30 40 50 60 70 ILLITERACY HEIGHT
Figure 6: Relationship between height and the percentage of population without schooling.
The new estimate confirms that most of the human capital embodied in
the Spanish population into the second half of the twentieth was due to
17
expanded primary schooling rather than to secondary or university studies.
Likewise, it identifies the Civil War of 1936-39 as one the most serious setbacks during two centuries of slow and irregular capital human accumulation. The Civil War and the early years of Franco regime contributed to the depletion of the stock of human capital and had negative effects on welfare population (Núñez, 2005). Our results show that there is a negative correlation of -0.77 between height and the schooling rate. Figure 6 depicts the relationship between height and our education variable: percentage of population without schooling.
Finally, we have also included other important development indicators
such as the grade of openness of the country, measured as the ratio export plus
imports over GDP and built using Prados de la Escosura (2003: 188). There are
very influential papers in literature that claimed to find a negative association
between barriers to trade and economic growth (Ben-David, 1993, Sacks and
Warner, 1995, Edwards, 1998 and Frankel and Romer, 1999). The association
between health, welfare state, and economic opening ¿or openness? still is little
investigated in the anthropometric history. The subject is interesting in Spain to
evaluate the effects of the autarkic and economic liberalization policies during
the long Dictatorship of Franco (1939-1975). Studies made on the Nazi autarky
and old communist countries in Europe show the negative effects on the well-
being, as a result of the strong controls and the restrictions of the market: fixed
price, production contingents, import restrictions, food rationing and limitations
in certain types of foods that people could eat (Baten and Wagner, 2003; Laska-
Mierzejewska, T. and Olszewska, E. 2007). The relation between height and
openness also could consider the integration to the international trade and
increase of the size of the state with the introduction in the welfare state
(Rodrik, 1997, 1999). The influence of welfare state in the physical growth of the
populations has been made for the Norwegian case (Sunder, 2003).
18
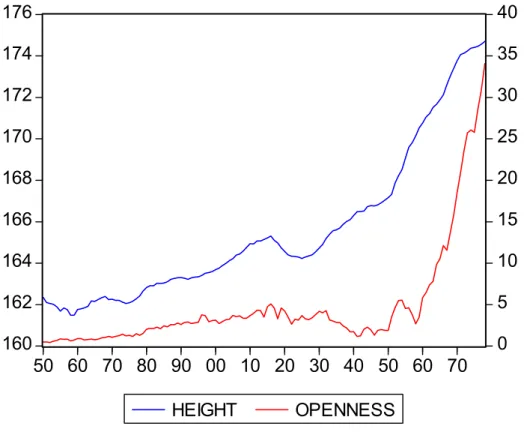
160
162 164 166 168 170 172 174 176
0 5 10 15 20 25 30 35 40
50 60 70 80 90 00 10 20 30 40 50 60 70
HEIGHT OPENNESS
Figure 7: Relationship between height and the grade of openness
Figure 7 shows the relationship between height and openness. The
annual series of the grade of openness we used come from recent estimations
of Tena (2005: 628-631). The relationship between height and openness is
positive (0.62) especially after 1959. The Stabilization Plan in 1959 ushered a
new era during the dictatorship of General Franco when Spain experienced
larger growth rates than before. This relationship was also strong during the
period 1880-89 and before the Civil War. Our data reveal that the autarky had a
negative effect in the stature of adolescents. The stature diminished in the
replacements of the 1940s, as it is appraised in cohorts of the 1920s. Others
anthropometric studies made recently with data of the Spanish National Health
Survey (2003-2006) for several generations indicate that the economic
liberalization of 1959 improve the Spaniards height of gender different (Costa-
Font and Gil, 2008; Spijker, J, Pérez, J., Cámara, A. 2008).
19
3. Determinants of changes in Spaniards stature
According to anthropometrics, the average height of a given cohort is a function of its nutritional intake during infancy and childhood, letting aside genetic factors. Attained height reflects the trade off between the amount and quality of nutrients available for growth from childhood to maturity against the demands of body maintenance, disease and work. Thus, the influence of income on height is indirect. Income affects height because the former is one of the determinants of the consumption of food and hygiene products consumption and through its relationship with child labor and disease environment.
Thus, an increase in height in economy could stem from: (i) an increase in GDP, (ii) a decrease in food prices of, (iii) an increase in the consumption of hygienic products or (iii) a decrease in mortality or infant mortality rates. Other factors that indirectly influence income could also influence height such as the grade of openness or the human capital variables, e.g. schooling rate, previously mentioned.
Following Jacobs and Tassenaar (2004), we model human stature as a Vector Autoregressive Model (VAR). We let
Htbe the average height of conscripts at age of the cohort measured in year t, which is observed from t=1,…,T. The attained height at each age is by definition equal to the increments in stature from the year of birth:
(1)
where
Hti Hti Hti1is the increment in height of the cohort of conscripts measured in year t between age -i and -i-1 , i=1,…, and
Ht0is the length at birth. We assume that the (unobserved) increments in height depend linearly on income and other explanatory variables, such as these described in section 2.
0 1
1 ... t t
t t
t H H H H
H
20
(2)
where
tiis an error term and α is the coefficient associated to the explanatory variables. Substituting in a recursive way gives:
(3)
where L is the lag operator and
etis a moving average error expression.
Estimating an equation like (3) is not exempted from problems. The main problem is that the majority of explanatory variables are endogenously linked.
Therefore, estimating a single-equation for the height by Ordinary Least Squares (OLS) is not appropriate when regressors are endogenous.
So, we propose to estimate a structural VAR model which contemplates the possibility of the existence of a cointegration relationship among the variables in the equation (3). For that purpose, our analysis is conducted by using Vector Error Correction Equilibrium (VECqM) VAR model as in (4),
t t i t p
i i
t c Y Y
Y
1 1(4)
where
Ytis a vector of endogenous variables, c is a vector of constants,
ithe matrices of autoregressive coefficients and
tthe vector of white noise processes. Identification of the structural shock is achieved by appropriately ordering the variables of interest and applying Cholesky decomposition to the variance-covariance matrix of the reduced form residuals
t.
Our baseline VAR consists of a five or six variable model. It includes height in natural logarithms (height), mortality rate (mort), consumption of hygienic products (conshig) in natural logarithms, deflator of private consumption in natural logarithms (def), real GDP in natural logarithms (gdp), and openness (open). We also include some dummy variables for the Civil War
i t i t i i
t Y
H
.
t t i
i t ti i
i t ti
t Y L Y e
H ( ) .
0 0
21
period (1936-39) and for 1918 when a flu epidemic occurred. The percentage of population without schooling is also included as explanatory variable.
The use of a recursive identification scheme implies that the identified shocks contemporaneously affect their corresponding variables and those variables that are ordered at a later stage, but have no impact on those that are ordered before. Hence, it is sensible to order the most exogenous variable (the grade of openness in our study). The degree of openness shocks may affect all other variables in the system contemporaneously through any of the other shocks. The next variables in the system are income (GDP) and deflator of private consumption. With this ordering we implicitly assume a contemporaneous impact of income shocks on the prices while also imposing a certain time lag on the impact of prices shocks on income. The consumption of hygiene products and mortality rate variables are ordered next and are thus contemporaneously affected by all the mentioned shocks. Finally, height is ordered last, allowing to react contemporaneously to all variables in the model.
3.1. Preliminary step: unit root and Cointegration Tests
A preliminary step before estimating equation (4) is to proceed to do individual cointegration analysis. Two univariate unit-root tests were conducted.
Table 5 reports the results from the augmented Dickey-Fuller test and the
Phillips-Perron (1988) test. The evidence from the tests suggests that the
variables are I(1), although, according to the Phillips-Perron test, in some cases
the null hypothesis of a unit root in the height variable is rejected in favour of
stationarity.
22
Table 5: Unit root tests
Augmented Dickey-
Fuller
Phillips- Perron
Height (logs) 1.57 3.07*
GDP pc (logs) 2.34 2.07 Mortality rate 0.31 1.36 Conshig (in
logs)
-0.23 -0.36 Deflator (in
logs)
4.40 4.34 Population
without schooling
-1.15 -0.55
Openness 8.61 8.61
*Indicates rejection of the null hypothesis of unit root test at 95% level.
We also carry out a Johansen (1991)’s cointegration test to check the possibility of a long-run cointegration relationship among the variables and estimate the cointegration vectors. According to the λ-max statistic, the null hypothesis of no cointegration versus one cointegration vector and one cointegration vector versus two was rejected at the 95% confidence level. Two cointegration vectors were suggested.
Johansen cointegration test
height= 0.003912*conshig-
0.008317*def+0.008494*gdppc+0.002607*openness
(0.022) (0.00181) (0.0047) (0.00093)
mort =-0.2964*conshig+0.1468*def-1.7673*gdppc-0.1457*openness
(0.081) (0.067) (0.3241) (0.0352)
23
3.2. Main Results
We estimate the VECqM specification and we impose the two long-run cointegration relationships derived using Johansen’s (1991) test. We observe how height depends positively on consumption of hygiene products, income and the degree of openness and negatively on the deflator of private consumption.
Table 6 offers the derived cointegration relationships. The first column lists the results for the sample period 1850-1958 (consumption of hygiene products data ends in 1958) using the first cointegration relationship and the second column for the second one.
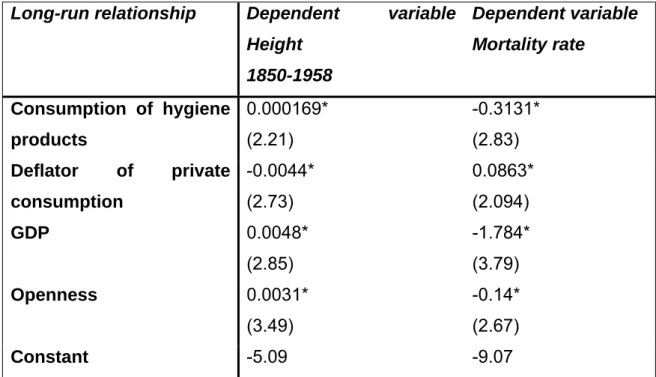
Table 6: Long-run relationships among Height and their determinants
Long-run relationship Dependent variable Height
1850-1958
Dependent variable Mortality rate
Consumption of hygiene products
0.000169*
(2.21)
-0.3131*
(2.83) Deflator of private
consumption
-0.0044*
(2.73)
0.0863*
(2.094)
GDP 0.0048*
(2.85)
-1.784*
(3.79)
Openness 0.0031*
(3.49)
-0.14*
(2.67)
Constant -5.09 -9.07
t-ratio between parentheses. * significant 5% level, ** significant 10% level
Once we have presented the long-run cointegration relationships, we
comment the main results of the VAR estimated coefficients. If we center on the
height equation we observe how the elasticity of this equation with respect to
the long-run cointegration relationships is positive and significant for the first
cointegration relationship (0.0246) and negative and significant (-0.0010) for the
24
second one. Changes in stature clearly depend on changes in the consumption of hygienic products, changes in the prices of private consumption, income and the grade of openness. Our mortality rate depends positively on the deflator of private consumption and negatively on consumption of hygiene products, GDP per head and the grade of openness. Using these variables we can explain almost 60 percent of the changes in stature during the period 1850-1958.
3.3 Impulse response functions
A convenient feature of this analysis is the possibility of representing accumulated impulse response of changes in stature to the rest of variables.
Figure 8 offers us the accumulated response to one standard deviation
innovation of height. As we can see height responds negatively to a positive
increase in the mortality rate and an increase in the deflator of private
consumption and positively to an increase in the GDP, consumption of hygiene
products, and the grade of openness.
25
-.004 -.002 .000 .002 .004 .006 .008 .010
1 2 3 4 5 6 7 8 9 10
Accumulated Response of LHEIGHT to LHEIGHT
-.004 -.002 .000 .002 .004 .006 .008 .010
1 2 3 4 5 6 7 8 9 10
Accumulated Response of LHEIGHT to LMORT
-.004 -.002 .000 .002 .004 .006 .008 .010
1 2 3 4 5 6 7 8 9 10
Accumulated Response of LHEIGHT to LCONSHIG
-.004 -.002 .000 .002 .004 .006 .008 .010
1 2 3 4 5 6 7 8 9 10
Accumulated Response of LHEIGHT to LPIB
-.004 -.002 .000 .002 .004 .006 .008 .010
1 2 3 4 5 6 7 8 9 10
Accumulated Response of LHEIGHT to LDEF
-.004 -.002 .000 .002 .004 .006 .008 .010
1 2 3 4 5 6 7 8 9 10
Accumulated Response of LHEIGHT to LOPENNESS
Accumulated Response to Cholesky One S.D. Innovations
Figure 8: Height Accumulated Impulse Response Functions
26
3.4. Variance decomposition
0 20 40 60 80 100
2 4 6 8 10 12 14 16 18 20
LHEIGHT LMORT LCONSHIG
LDEF LPIBPC OPENNESS Variance Decomposition of LHEIGHT
Figure 9: Height Variance decomposition
In which proportion do the different innovations to explanatory variables
contribute to the volatility of height? Figure 9 plots fraction of the k-step ahead
forecast error variance for height explained by the different shocks. The results
confirm that after twenty years 12.84% of variance of height is attributable to
mortality shocks, 19.26% to an openness shock and 10.67% to a GDP per head
shock. The less important component is the inflation shock (around 1.13%).
27
3.5. Robustness analysis
To assess to what extent our results are sensitive to the choice of the identification schemes and changes in the variables we re-estimate the model in a different alternative way. We adopt an alternative ordering scheme in the VAR where the price deflator is moved before the income variable. The estimated results under this scheme are very similar. Table 8 shows the derived long-term relationships in this case. An increase in the prices of private consumption decreases the growth of height, whereas increases in GDP growth, consumption of hygiene products or the grade of openness increase the rate of height growth. Figure 10 depicts the different accumulated impulse response functions of height growth to the different variables and Figure 11 the variance decomposition. Our main conclusions remain.
Table 8: Long-run relationship among Height and their determinants
Long-run relationships Dependent variable Height
Dependent variable mortality rate
Consumption of hygiene products
0.00016*
(1.90)
-0.3131*
(2.11) Deflator of private
consumption
-0.000482*
(2.06)
1.7842*
(1.85)
GDP -0.00445*
(2.73)
-0.086*
(3.30)
Openness -0.003126*
(3.53)
-0.14*
(2.76)
Constant -5.09 -9.07
t-ratio between parentheses. * significant 5% level, ** significant 10% level
28
-.01 .00 .01 .02 .03 .04 .05
2 4 6 8 10 12 14 16 18 20
Accumulated Response of LHEIGHT to LHEIGHT
-.01 .00 .01 .02 .03 .04 .05
2 4 6 8 10 12 14 16 18 20
Accumulated Response of LHEIGHT to LMORT
-.01 .00 .01 .02 .03 .04 .05
2 4 6 8 10 12 14 16 18 20
Accumulated Response of LHEIGHT to LCONSHIG
-.01 .00 .01 .02 .03 .04 .05
2 4 6 8 10 12 14 16 18 20
Accumulated Response of LHEIGHT to LPIBPC
-.01 .00 .01 .02 .03 .04 .05
2 4 6 8 10 12 14 16 18 20
Accumulated Response of LHEIGHT to LDEF
-.01 .00 .01 .02 .03 .04 .05
2 4 6 8 10 12 14 16 18 20
Accumulated Response of LHEIGHT to OPENNESS
Accumulated Response to Cholesky One S.D. Innovations
Figure 10: Height Accumulated Impulse Response Functions
29
0
20 40 60 80 100
2 4 6 8 10 12 14 16 18 20
LHEIGHT LMORT LCONSHIG
LPIBPC LDEF
OPENNESS Variance Decomposition of LHEIGHT
Figure 12: Variance decomposition of height
4. Conclusions
This paper has investigated the relationship between height and economic development in Spain for the period 1850-1958. The analysis shows that there is a long-run relationship between height, income, and other indicators of economic development in Spain such as mortality rates, consumption of hygienic products and sanitary services, deflator of private consumption, schooling rate, and the grade of openness.
We have proceeded to estimate a VAR-Vector Equilibrium Correction Model
to calculate the height response to different changes in the explanatory
variables. With variables included in our model, we got to explain almost 60
percent of the changes in stature during the period 1850-1958. From the
30
accumulated impulse response of the changes in stature to different variables we observed how height responds negatively to an increase in the deflator of private consumption and positively to an increase in GDP, consumption of hygiene products, and the degree of openness.
To assess to what extent our results are sensitive to the choice of the
identification schemes and some changes in the variables we have re-estimated
the model in a different alternative way, by adopting an alternative ordering
scheme in the VAR. Our further research should be centered on analysing the
relationship between height and economic development by using alternatives
methodologies. For instance, Den Haan (2000) suggested a procedure for
analyzing the comovement between output and prices based on correlations of
the corresponding VAR forecast errors at alternative forecast horizons which
could be easily applied in this context to check whether this correlation is
stronger in longer rather than shorter horizons.
31
References
Arcaleni E. 2006. Secular trend and regional differences in the stature of Italians, 1854–1980”. Economic and Human Biology 4, 24-38.
Arora, S. 2001. Health, Human Productivity, and Long-Term Economic Growth.
Journal of Economic History 61, 699-749.
Barciela, C. ed. 2003. Autarquía y mercado negro. El fracaso económico del primer franquismo, 1939-1959. Barcelona, Crítica.
Baten, J. 2000. Heights and Real Wages in the 18
thand 19
thCenturies: An International Overview. Jahrbuch für Wirtschaftsgeschichte 1, 17-32.
Baten, J. and Wagner, A. 2003. Autarchy, market disintegration, and health: the mortality and nutritional crisis in Nazi Germany, 1933-1937. Economics and Human Biology 1, 1-28.
Ben-David, D. 1993. Equalizing Exchange: Trade Liberalization and Income Convergence. Quarterly Journal of Economics 108 (3), 653-679.
Bosch, M., Bozzoli, C., Quintana-Climent, C. 2009. Infant mortality, income and adult stature in Spain, Documento de Trabajo 2009-27, FEDEA- La Caixa.
http://www.fedea.es/pub/papers/2009/dt2009-27.pdf
Brinkman, H.J., Drukker, J.W., Slot, B., 1988. Height and income: a new method for the estimation of historical national account series. Explor. Econ.
History 25, 227–264.
Cámara-Hueso, A.D. 2006. Fuentes documentales antropométricas en España:
problemas metodológicos para los siglos XVIII y XIX. Historia Agraria 38, 115-128.
Carreras, A., Tafunell, T. (coords.) 2005. Estadísticas Históricas de España Siglos XIX-XX. Fundación BBVA, Madrid.
Case, A., Paxson, C. 2008. Height, Health, and Cognitive Function at Older Ages. American Economic Review: Papers & Proceeding 98, 463-467.
Coll, S. 1998. The relationship between human physical stature and GDP (some experiments with European time series). In: Komlos, J., Baten, J.
(Eds.), The Biological Standard of Living in Comparative Perspective. Franz Steiner Verlag, Stuttgart, pp. 384–407.
Costa-Font, J., Gil, J. 2008. Generational effects and gender height dimorphism
in contemporary Spain. Economics and Human Biology 6, 1-18.
32
Craig, L.A., Weiss, T., 1998. Nutritional status and agricultural surpluses in the Antebellum United States. In: Komlos, J., Baten, J. (Eds.), The Biological Standard of Living in Comparative Perspective. Franz Steiner Verlag, Stuttgart, pp. 190–207.
Cussó, X. 2005. El estado nutritivo de la población española 1900-1970.
Análisis de las necesidades y las disponibilidades de nutrientes. Historia Agraria 36, 329-358.
Cussó, X. and Garrabou, R. 2007. La transición nutricional en la España contemporánea: las variaciones en el consumo de pan, patatas y legumbres (1850-2000). Investigaciones de Historia Económica 7, 69-100.
Deaton, A. 2003. Health, Inequality, and Economic Development. Journal of Economic Literature 41, 113-58.
Deaton, A. 2007. Height, health, and development. Proceedings of the National Academy of Sciences, 104, 33, 13232 – 13237.
Deaton, A. 2008. Income, Health, and Well-Being around the World: Evidence from the Gallup World Poll. Journal of Economic Perspectives 22, 53-72.
Den Haan, W.J. 2000. The comovement between output and prices. Journal of Monetary Economics 46, 3-30.
Domínguez-Martín, R. 2002. La riqueza de las regiones. Las desigualdades económicas regionales en España, 1700-2000. Madrid, Alianza.
Drukker, J.W. Tassenaar, V. 1997. Paradoxes of Modernization and Material Well-Being in the Netherlands during the Nineteenth Century. In: R. H.
Steckel and R. Floud. Health and Welfare during Industrialization. Chicago, University of Chicago Press: 331-379.
Drukker, J.W. Van Meerten, M.A. 1995. Beyond Villerme and Quetelet: The Quantitative Relation between Sex- and Age-Specific Height and Real Per Capita Income. In: J. Komlos (ed). The Biological Standard of Living on Three Continents: Further Explorations in Anthropometric History. Boulder, Westview Press, pp. 25-57.
Easterlin, R. A. 2000. The Worldwide Standard of Living since 1800. Journal of Economic Perspectives 14, 7-26.
Edwards, S. 1995. Openness, Productivity and Growth: What do We Really
Know?. Economic Journal 108 (447), 383-398.
33
Federico, G. 2003. Heights, Calories and Welfare: A New Perspective on Italian
Industrialization, 1854–1913. Economics and Human Biology 1, 289-308.
Floud, R., Wachter, K., Gregory, A., 1990. Height, Health and History:
Nutritional Status in the United Kingdom. Cambridge University Press, Cambridge, UK.
Fogel, R. W. 1994. Economic Growth, Population Theory, and Physiology: the Bearing of Long-Term Processes on the Making of Economic Policy.
American Economic Review 84 (3), 369-95.
Fogel, R. W. 2004. The Escape from Hunger and Premature Death, 1700-2100.
New York, Cambridge University Press
Frankel, J., Romer, D. 1999. Does Trade Cause Growth?. American Economic Review 89 (3), 379-399.
Garcia, J., Quintana-Domeque, K. 2007. The evolution of adult height in Europe: A brief note. Economics and Human Biology 5, 340-349.
Garcia, J., Quintana-Domeque, K. 2009. Income and body mass index in Europe. Economics and Human Biology 7, 73-83.
German, L., Llopis, E. Maluquer, J. Zapata, S. (eds) 2001. Historia Económica
regional de España. Siglos XIX y XX. Barcelona, Crítica.Gómez-Mendoza, A., Pérez-Moreda, A. 1995. Heights and Welfare in Spain 1900-1930. In: J. Komlos (Ed.), The biological standard of living on three continental. Further explorations in anthropometric history. Westview Press, Boulder, pp. 76-89.
Haines, M.R. 2004. Growing Incomes, Shrinking People – Can Economic Development Be Hazardous to Your Health? Historical Evidence for the United States, England, and the Netherlands in the Nineteenth Century.
Social Science History 28 (2), 249-270.
Haines, M.R., 1998. Health, height, nutrition, and mortality: evidence on the
‘Antebellum Puzzle’ from Union army recruits for NewYork State and the United States. In:Komlos, J., Baten, J. (Eds.), The Biological Standard of Living in Comparative Perspective. Franz Steiner Verlag, Stuttgart, pp.
155–175.
Honda, G. 1997. Differential Structure, Different health: Industrialization in
Japan, 1868-1940. In: R. Steckel and R. Floud (Eds.), Health and Welfare
During Industrialization. Chicago University Press, Chicago, pp.251-284.
34
Jacobs, J., Tassenaar, V. 2004. Height, Income, and Nutrition in the
Netherlands: the second half of the 19
thcentury. Economics and Human Biology 2 (2), 181-195.
Johansen, S. 1990. Estimation and Hypothesis Testing of Cointegration Vectors in Gaussian Vector Autorregresive Models. Econometrica 59, 1551-1580.
Kenny, C. 2005. Why Are We Worried About Income? Nearly Everything that Matters is Converging. World Development 33, 1-19.
Komlos, J. (Ed.) 1994. Stature, Living Standard, and Economic Development.
Essays in Anthropometric History. The University of Chicago Press, Chicago.
Komlos, J. (Ed.) 1995a. The Biological Standard of Living in Europe and America, 1700-1900: Studies in Anthropometric History. Brookfield, Vt., Variorum.
Komlos, J. (Ed.) 1995b. The biological standard of living on three continental.
Further explorations in anthropometric history, Westview Press, Boulder.
Komlos, J. 1998. Shrinking in a Growing Economy: the Mistery of Physical Stature During the Industrial Revolution. Journal of Economic History 58 (3), 779-802.
Komlos, J. 2003. An anthropometric history of early-modern France. European Review of Economic History 7 (2), 159-189.
Komlos, J., Baten, J. (Eds.) 1998. The Biological Standard of Living in Comparative Perspective, Franz Steiner, Stuttgart.
Komlos, J., Lauderale, B.E., 2007. Underperformance in affluence: The remarkable relative decline in U.S. heights in the second half of the 20th Century. Soc. Sci. Quart. 88, 283–305.
Laska-Mierzejewska, T. and Olszewska, E. 2007. Anthropological assessment of changes in living conditions of the rural population in Poland in the period 1967–2001. Annals of Human Biology 34 (3): 362–376
López-Casanovas, G., Ribera, B., Currais, L. 2005. Health and Economic Growth. Finding and policy implications. The MIT Press, Cambridge.
Margo, R., Steckel, R.H. 1983. Heights of Native Born Whites During the Antebellum Period. Journal of Economic History 43, 167-174.
Martínez-Belmonte, L. 1983. La talla media de los españoles varones crece
cada año. Estadística Española 101, p. 121-125.
35
Martínez-Carrión, J.M. 1994. Niveles de vida y desarrollo económico en la
España contemporánea: Una visión antropométrica. Revista de Historia Económica - Journal of Iberian and Latin American Economic History 12 (3), 685-716.
Martínez-Carrión, J.M. 2009. Anthropometric History and Ibero-American Historiography. Historia Agraria 47, pp. 11-18.
Martínez-Carrión, J.M. ed. 2002. El nivel de vida en la España rural, siglos XVIII-XX. Alicante, Universidad de Alicante.
Martínez-Carrión, J.M., Gil-Puche, J. 2009. Literacy, Biological Welfare, and Inequality: Region of Valencia (Spain), 1850-1970. Historia Agraria 47, 167- 186.
Martínez-Carrión, J.M., Moreno-Lázaro, J. 2007. Was There an Urban Height Penalty in Spain, 1840-1913?. Economics and Human Biology 5, 144-164.
Martínez-Carrión, J.M., Pérez-Castejón, J. J. 1998b. Height and standard of living in Spain, 1860-1969: Evidence from the Southeastern Region. In:
Komlos, J. J. Baten (Eds.), The Biological Standard of Living in Comparative Perspective, Franz Steiner, Stuttgart. pp. 344-358.
Martínez-Carrión, J.M., Pérez-Castejón, J.J. 2000. On the Height of Spanish Recruits During the Early Phases of Modern Economic Growth. Jahrbuch für Wirtschaftsgeschichte 11(1), 95-112.
Meyer, H.E., Selmer, R. 1999. Income, educational level and body height.
Annals of Human Biology 26 (3), 219-227.
Moradi, A. 2010. Nutritional status and economic development in sub-Saharan Africa, 1950–1980. Economics & Human Biology8 (1), 16-29.
Nicolau, R. 2005. Población, salud y actividad. In: A. Carreras, X. Tafunell (Eds.), Estadísticas históricas de España, siglos XIX-XX. Bilbao, Fundación BBVA, pp. 77-154.
Núñez, C.E. 2003. Within the European Periphery: Education and Labor Mibility in Twentieth-Century Spain. Paedagógica Historica 39 (5), 535-558.
Núñez, C.E. 2005. La educación. In: A. Carreras, X. Tafunell (Eds.), Estadísticas Históricas de España, Bilbao, Fundación BBVA, pp. 157-244.
Peracchi, F. 2008. Height and Economic Development in Italy, 1730-1980.
American Economic Review 98 (1), 475-481.
36
Persico, N., Postlewaite, A., Silverman, D., 2004. The effect of adolescent
experience on labour market outcomes: the case of height. J. Pol. Econ.
2004 (112), 1019–1053.
Phillips, P., Perron, P. (1988). Testing for a unit root in time series regression.
Biometrika 75, 335-346.
Prados de la Escosura, L. 2003. El Progreso Económico de España (1850- 2000). Fundación BBVA, Madrid.
Prados de la Escosura, L. 2007. Growth and Structural Change in Spain, 1850- 2000: A European Perspective. Revista de Historia Económica / Journal of Iberian and Latin American Economic History 25 (1), 147-181.
Prados de la Escosura, L. 2008. Inequality, poverty and the Kuznets curve in Spain, 1850–2000. European Review of Economic History 12 (3), 287-324.
Prados de la Escosura, L. y Rosés, J. R. 2009. The Sources of Long-Run Growth in Spain, 1850-2000. The Journal of Economic History 69, 4, pp.
1063-1091.
Puche-Gil, J. 2009. La evolución del los niveles de vida biológicos en la Comunidad Valenciana, 1840-1948. Ph.D. Diss. Universidad Pablo Olavide de Sevilla.
Quiroga Valle, G., Coll, S. 2000. Income Distribution in the Mirror of Height Differences: The Case of Spain 1895-1950. Journal of Income Distribution 9, 107-131.
Quiroga, G. 2001. Estatura, diferencias regionales y sociales y niveles de vida en España (1893-1954), Revista de Historia Económica / Journal of Iberian and Latin American Economic History XIX, 19, 175-200.
Quiroga, G. 2003a. Medidas antropométricas y condiciones de vida en la España del siglo XX. PhD Diss. Universidad Alcalá de Henares.
Quiroga, G. 2003b. Literacy, Education and Welfare in Spain. Peadagogica Historica 39 (5), 599-619.
Rebato, E. 1998. The Studies on secular trend in Spain: a review. In: Bodzsár, Éva B; Susanne, Charles, eds. Secular growth changes in Europe.
Budapest: Eötvös University Press, p. 297-315.
Rodrik, D. 1997. Trade, social insurance, and the limits to globalization. NBER
Working Paper 5905.
37
Rodrick, D. 1999. Making Openness Work: The New Global Economy and the
Developing Countries. Overseas Development Council, Washington, DC.
Sacks, J., Warner, D. 1995. Economic Reform and the Process of Global Integration. Brooking Papers on Economic Activity 1995 (1), 1-18.
Sandberg, L.G., Steckel, R.H. 1997. Is Industrialization Hazardous to Your Health? Not in Sweden In. Steckel, R.H., Floud, R. (eds) Health and Welfare During Industrialization. Chicago University Press, Chicago, 127- 160.
Schultz, T.P. 2003. Human capital, scholing and health. Economic and Human Biology 1, 207-221.
Shay, T. 1994. The Level of Living in Japan, 1885-1938: New Evidence. In:
Komlos (Ed.), Stature, Living Standards, and Economic Development:
Essays in Anthropometric History. The University of Chicago Press, Chicago, pp.173-201.
Shutkowski, H. 2008. Between Biology and Culture. Cambridge University Press, Cambridge.
Spijker, J, Pérez, J., Cámara, A. 2008. Cambios generacionales de la estatura en la España del siglo XX a partir de la Encuesta Nacional de Salud.
Revista de Estadística Española 50, 571-604.
Steckel, R.H. 1979. Slave Height Profiles from Coastwise Manifiests.
Explorations Economics History 16, 363-380.
Steckel, R.H. 1983. Height and per capita income. Historical Methods, 16, 1-7.
Steckel, R.H. 1995. Stature and Standard of Living. Journal of Economic Literature 33, 1903-1940.
Steckel, R.H. 2008. Biological Measures of the Standard of Living. Journal of Economic Perspectives 22 (1), 129-152.
Steckel, R.H. 2009. Heights and human welfare: Recent developments and new directions. Explorations in Economic History 46, 1-23.
Steckel, R.H., Floud, R. 1997. Health and Welfare During Industrialization.
Chicago, University of Chicago Press.
Sunder, M., 2003. The making of giants in a welfare state: the Norwegian experience in the 20th century. Econ. Hum. Biol. 1, 267–276.
Tena, A. 2005. El sector exterior. In: A. Carreras, X. Tafunell (Eds.),
Estadísticas Históricas de España. Barcelona, FBBVA, pp. 573-644.
38
Vecchi, G., Coppola, M. 2006. Nutrition and Growth in Italy, 1861- 1911: What Macroeconomic Data Hide. Explorations in Economic History 43 (3), 438- 464.
Weir, D.R. 1997. Economic Welfare and Physical Well-Being in France, 1750- 1990. Health and Welfare During Industrialization. In: R.H. Steckel, R.
Floud. Chicago, University of Chicago Press, pp. 161-200.
F UNDACIÓN DE LAS C AJAS DE A HORROS DOCUMENTOS DE TRABAJO
Últimos números publicados
159/2000 Participación privada en la construcción y explotación de carreteras de peaje Ginés de Rus, Manuel Romero y Lourdes Trujillo
160/2000 Errores y posibles soluciones en la aplicación del Value at Risk Mariano González Sánchez
161/2000 Tax neutrality on saving assets. The spahish case before and after the tax reform Cristina Ruza y de Paz-Curbera
162/2000 Private rates of return to human capital in Spain: new evidence F. Barceinas, J. Oliver-Alonso, J.L. Raymond y J.L. Roig-Sabaté 163/2000 El control interno del riesgo. Una propuesta de sistema de límites
riesgo neutral
Mariano González Sánchez
164/2001 La evolución de las políticas de gasto de las Administraciones Públicas en los años 90 Alfonso Utrilla de la Hoz y Carmen Pérez Esparrells
165/2001 Bank cost efficiency and output specification Emili Tortosa-Ausina
166/2001 Recent trends in Spanish income distribution: A robust picture of falling income inequ