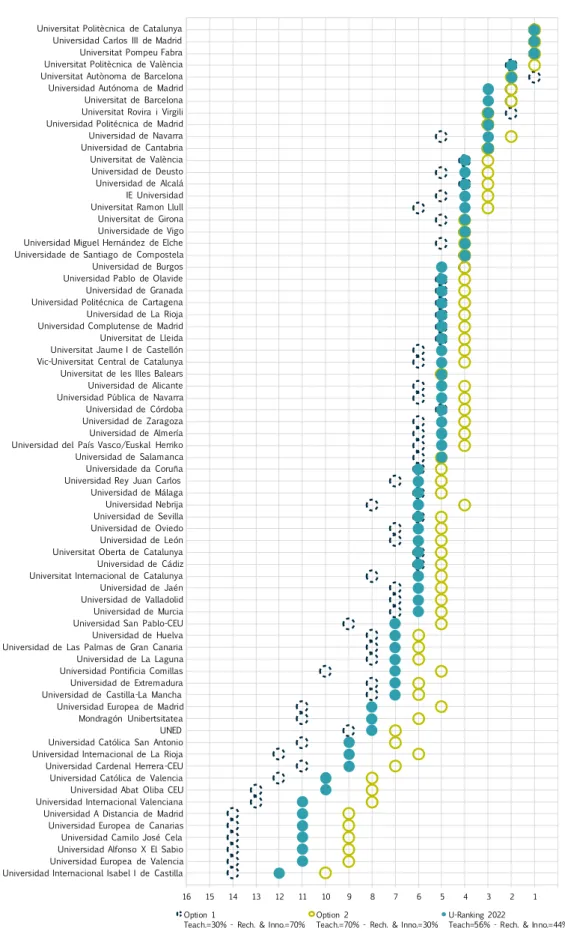
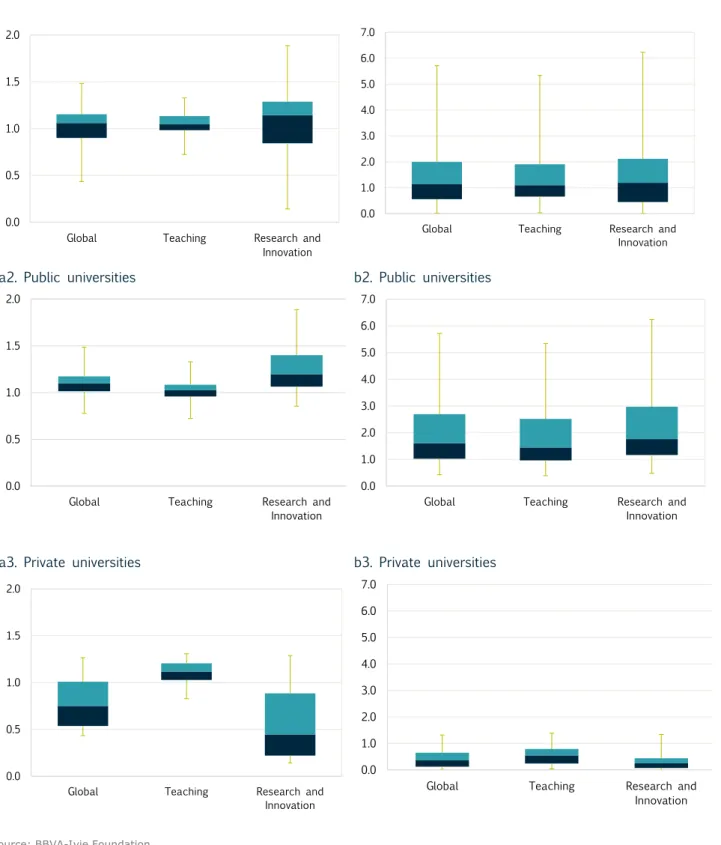
The effects of a change in the weight assigned to research in the U-ranking on top-tier universities. Given the total weight of public universities in the university system, this sample is considered to be the system average.
Introduction
Methodology
- The design of rankings
- Activities studies
- Disaggregation of activities
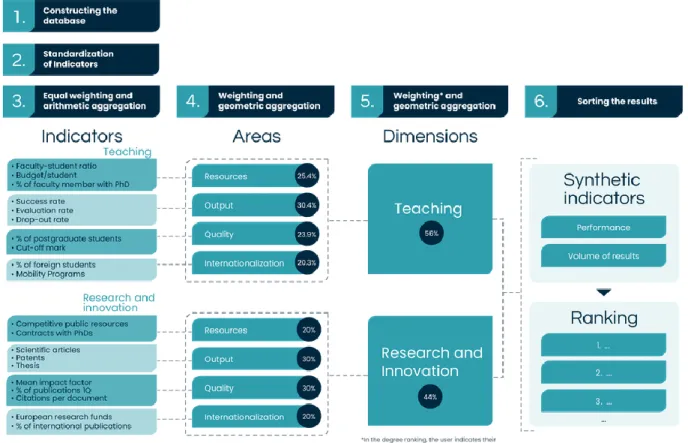
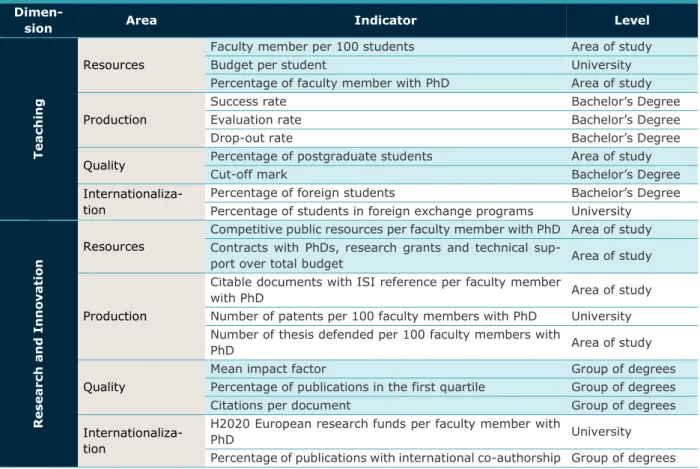
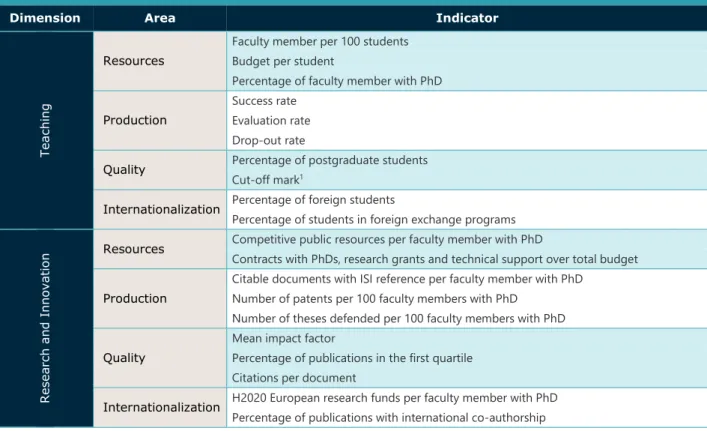
- Indicators, areas and dimensions
- Period covered by the data
- Criteria for the construction of indicators
- Performance rankings vs. Volume rankings
- Private universities
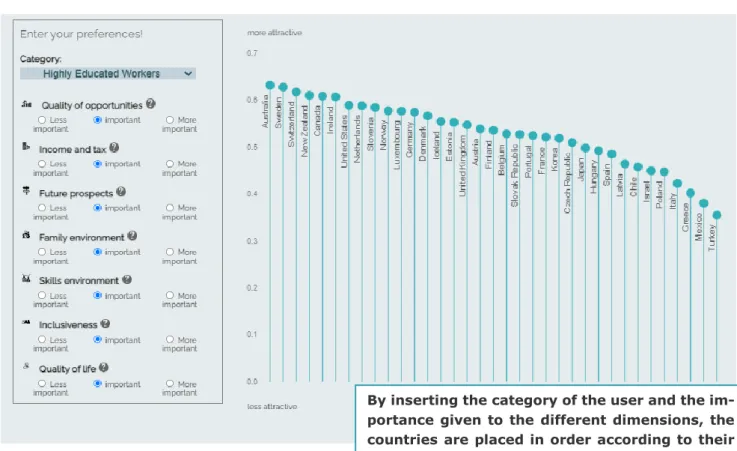
Spain appears in seventh position in the figure when considering the 1,000 universities in the ranking. At the private universities, doctoral students make up only 1.5% of the total, compared to 6.4% in the public universities.
User personalized rankings
Examples of personalized rankings
To calculate the index, the user must specify the importance attached to each of the dimensions considered. By inserting the user category and the importance of the different dimensions, the countries are ranked in order of their attractiveness.
Description of the web tool for generating personalized rankings of degrees
In this case, their interest will be to know which of the studies offered are most valued in the areas considered. In these cases, the degrees are ordered by the value of the index, taking into account all the decimal places. Last year's cut-off mark, the price per credit at first registration and information about the candidate's employability, which will be described in the next section.
Thus, 9 of the 20 indicators included in the calculation of the synthetic index of each degree correspond to a degree or group of degrees.

Complementary information on graduate employability
The median of the total number of universities in the index distribution is 1 (see Figure 4.12, panels a1 and b1). If we did this, it could lead to a bias in the analysis of the reality of the university system. Adding information about university performance in different fields has its own challenges.
Total dropout in undergraduate studies: sum of dropouts in the first, second and.

Main results
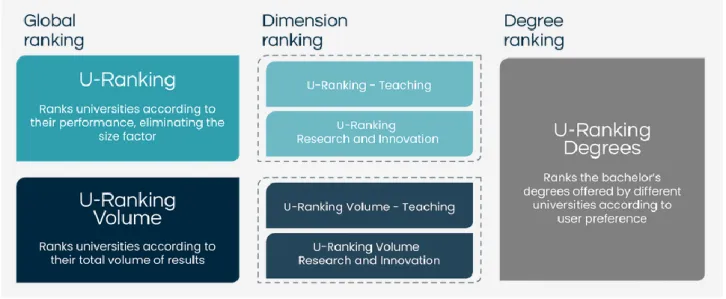
U-Ranking
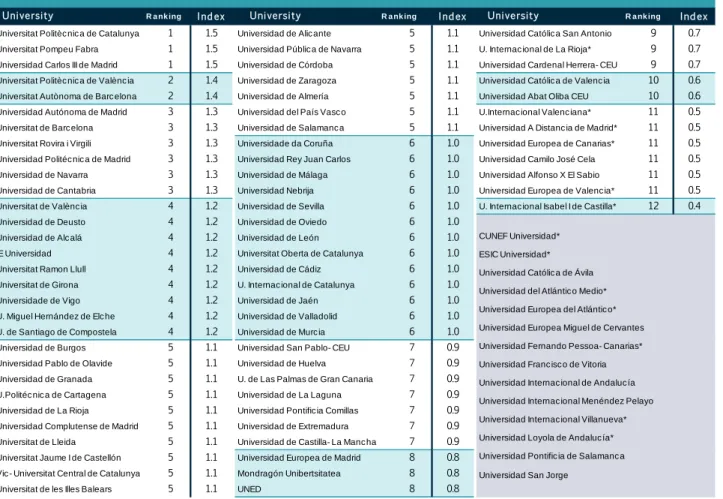
The order is based on the value of the synthetic indicator obtained for each university, which is offered in the second column. Universities that are 15 years or younger are marked with an asterisk (*) so that the reader can put the results into context in the following sense. Universitat Politècnica de Catalunya, Pompeu Fabra and Universidad Carlos III de Madrid share first place as in the previous edition.
The twenty universities in the top four are in principle the same universities as in the 202120 edition.
U-Ranking Volume
Ti Unibersidad ti Navarra ket maikatlo, a maikuyog kadagiti lima pay a publiko nga unibersidad: dagiti Autonomo ken Politekniko nga Unibersidad ti Madrid, ti Unibersidad ti Rovira ken Virgili, ti Unibersidad ti Barcelona ken ti Unibersidad ti Cantabria. Dagiti kapatgan a panagbalbaliw ket ti panagbaba ti maysa a posision manipud iti Unibersidad ti Deusto, nga umakar iti. Iti sabali a bangir, ti Unibersidad ni Miguel Hernandez de Elche, ti Unibersidad ti Santiago de Compostela ken ti Unibersidad ti Vigo ket immakar iti maysa a puesto manipud maikalima agingga iti maikapat.
The highest ranked private universities in terms of result volume when combining better results and larger size are Universidad de Navarra and Universitat Ramon Llull in twenty-second place.

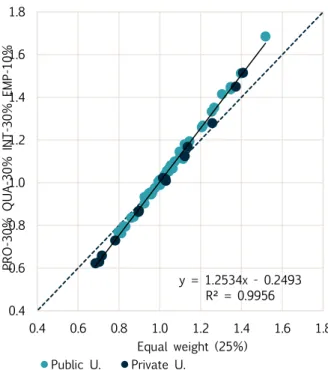
U-Ranking volume vs. U-Ranking performance
Note: The size indicator is a standard arithmetic average of each university's teachers, students and budget. 21 As previously mentioned, the size indicator is the result of the calculation of the standardized arithmetic mean of the number. In fact, examples of higher or lower performance can be found among universities of very different sizes.21 Figure 4.2 shows the correlation in panel a (all the universities) and b (universities with U-).
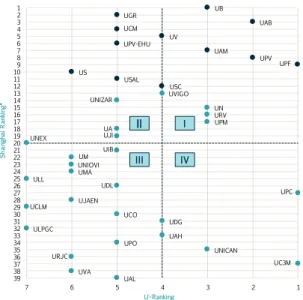
U-Ranking vs. Shanghai Ranking
In the latest edition, as can be seen in Figure 4.3, 12 Spanish universities appear in the top 500. Universities in zone II, however, are relatively better ranked in the Shanghai ranking. Both were included in the Top 500 of the 2021 Shanghai Ranking this year and are in intermediate positions in the U-ranking.
Note: Includes the 12 Spanish universities in the Shanghai Top 500 2021 ranking and the first 18 and 20 universities in the Volume and U Ranking.

Comparison of results with other international rankings
In the middle part of the diagram (Figure 4.7) appear the six universities that are in the first quartile of the three rankings, namely Universitat de Barcelona, Universitat de València, Universitat Politècnica de València, Universidad Autónoma de Barcelona en Madrid and Universidade de San -tiago de Compostela. Ten other universities are in the first quartile of two rankings: Universitat Pompeu Fabra, in Shanghai and U-Ranking; Universidad Complutense de Madrid, Universidad de Santiago de Compostela, Universidad de Granada, Universidad de Sevilla and Universidad del País Vasco-EHU, in Shanghai and U-Ranking Volume; It is particularly interesting to see that of the twelve Spanish universities that the Shanghai Ranking places in the Top 500, six also appear in the first quartile of our two rankings, at the intersection of the three circles of the diagram;
Therefore, we can say that of the twelve Spanish universities included in the Shanghai Top 500, ten are in our first quartile due to their higher volume of results in terms of U-Ranking Volume, and seven are among our most productive universities. according to the U-classification of performance.
Research vs. Teaching: sensitivity analysis
Universidad Cardenal Herrera-CEU Universidad Católica de Valencia Universidad de La Laguna Universidad Pontificia Comillas. UNED Universidad Católica San Antonio Universidad Internacional de La Rioja Universidad de Extremadura Universidad de Castilla-La Mancha Universidad Europea de Madrid Mondragón Unibertsitatea Universitat Rovira i Virgili Universidad Politécnica de Madrid Universidad Politécnica de Valencia. En el caso extremo de que se dé poco valor a la investigación y la innovación (30%), una universidad, la Universidad de Navarra, caería de los primeros puestos.
Ambue hendáicha, oñeme’ẽvévape peso investigación-pe, ko mbo’ehaovusu ári, Universitat de Valencia, Universidad de Alcala, Deusto, Universidad IE ha Ramón Llull oĩta avei umi tenda yvatevéva apytépe.
Teaching and research and innovation rankings
Universitat Politècnica de València 1 1,3 Universitat del País Basc 3 1,1 Universitat de les Illes Balears 5 0,9. Universitat Autònoma de Barcelona 2 1,8 Universitat Oberta de Catalunya 9 1,1 Universitat Camilo José Cela 18 0,2 Universitat Politècnica de Catalunya 2 1,8 Universitat de Cadis 9 1,1 Universitat a distància de Madrid* 18 0,2. Universitat Autònoma de Madrid 4 1,6 Universitat Pública de Navarra 9 1,1 Universitat Europea de València ia* 19 0,1 Universitat Politècnica de Madrid 4 1,6 Universidad Rey Juan Carlos 9 1.1.
Public and private universities’ results compared
However, the growth trend of the demand for master's programs differs between public and private universities. The proportion of masters in engineering and architecture is also much lower at private universities (7.3%) than at public ones (17.1%). In master's programs, the percentage is higher in private universities, while in doctoral programs it is higher in public universities.
Average by type of university and field of study (percentage). b) Percentage of registered employees in the 'graduate' category. The number of master's programs has grown at both public and private universities, but especially at the latter. Study area Percentage of publications in the first quartile: Publications corresponding to journals in the first quartile.

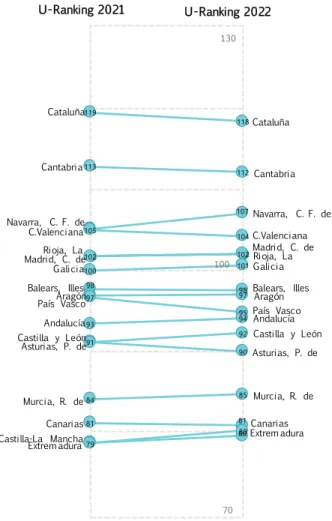
U-Rankings 2021 y 2022
Regional university systems
The fields of Social and Legal Sciences account for the majority of master's graduates, as well as a much larger share of the total at private universities (80.2%) than at public universities (54.1%). Transition percentage from bachelor's to master's program within the same university: percentage of graduated bachelor's students who register for a master's program at the same university in the year immediately after graduation. Overall, almost three quarters of master's students complete their studies on time (on-time completion rate), with this percentage being slightly higher at private universities (80%) than at public universities (72.6%).
At private universities, master's students account for almost one-third of the total, compared to 11.1% at public universities, indicating a strong specialization in master's programs in the private sector. While social and legal sciences account for the majority of master's graduates of both types of universities, the proportion is much higher at private universities (80.2% vs. 65%). The graduate ranking uses 12 indicators of university performance in the areas of process (on-time completion and non-continuation), quality (loyalty and percentage of PhD students), internationalization (international students and faculty) and employment outcomes (employment, income and job skills matches).
Postgraduate rankings
Introduction
Trends in postgraduate education
On the one hand, most private universities are small (small market share of the total number of bachelor's, master's and doctoral students), yet the share of master's students in these universities is very large. Note: The figures for Cantabria do not include master's students enrolled at the European University of the Atlantic, as 80% (12 out of 15) of this university's programs do not take place on site. The figures for Cantabria do not include master's students at the European University of the Atlantic, as 80% of the programs at this university do not take place on site.
Panel b of figure 5.7 provides a breakdown of the students who complete a master's degree at each type of university by field of study.

Methodology for preparing the postgraduate ranking
Connection rate: percentage of graduates in the 2015-2016 academic year who are connected to the Spanish social security system and employed in relation to the total number of graduates. Both the transfer rate and the loyalty rate are higher at the public universities. To provide an overview, panel a of Table 5.11 shows each university's level in the overall ranking and in each field of study, with the universities listed in order of overall ranking.
Universities that do not appear in the overall ranking, because they do not appear in at least three rankings of the fields of study, are shown in panel b of Table 5.11.

Consistency of the postgraduate ranking and relationship with U-Ranking
The private universities have more students studying remotely (25.4% of the total number of postgraduate students in Spain) than on-site (19.0%). The composition of the postgraduate programs offered by the public and private universities is very different from subject to field of study. Of the eight universities occupying the first three levels, only one, the Universidad de Navarra, is private.
Budget per students: The university's effective income by number of full-time equivalent students in 1st and 2nd cycle studies, bachelor's and master's programs and of students in PhD degrees (all these students are registered in centers belonging to the university).
Conclusions
List of University Abbreviations
Disponible en: https://www.observatoriuniversitari.org/es/files/2019/03/Informe-grados.pdf CWCU (Centro de Universidades de Clase Mundial de la Universidad Jiao Tong de Shanghai). Modelos de gestión estratégica en las universidades españolas de alto rendimiento. https://www.fbbva.es/publica-. ciones/modelos-de-gestión-estratégica-en-las-universidades-españolas-de-alto-rendimiento-2/. Real Decreto 96/2014, de 14 de febrero, por el que se modifican los Reales Decretos, de 15 de julio, por los que se establece el Marco Español de Cualificaciones para la Educación Superior. Disponible en: https://www.topuniversity-ties.com/qs-world-university-rankings/methodology?check_logged_in=1.
Available at: https://www.topuniversities.com/university-rankings/world-university-rankings/2022 [date of reference: May 2022].