REGULATION AS A WAY TO FORCE INNOVATION:
THE BIODIESEL CASE
JORDI PERDIGUERO JUAN LUIS JIMÉNEZ
FUNDACIÓN DE LAS CAJAS DE AHORROS DOCUMENTO DE TRABAJO
Nº 540/2010
De conformidad con la base quinta de la convocatoria del Programa de Estímulo a la Investigación, este trabajo ha sido sometido a eva- luación externa anónima de especialistas cualificados a fin de con- trastar su nivel técnico.
ISSN: 1988-8767
La serie DOCUMENTOS DE TRABAJO incluye avances y resultados de investigaciones dentro de los pro- gramas de la Fundación de las Cajas de Ahorros.
Las opiniones son responsabilidad de los autores.
Regulation as a way to force innovation: the biodiesel case
Jordi Perdiguero
*Juan Luis Jiménez
*Abstract
The introduction of biofuels is one of the objectives of the European Union. For this reason, measures to promote the production and consumption of this product have been implemented, such as tax exemptions and fixing a minimum amount of mixture. In this paper, we test the level of competition as a factor that can significantly affect the introduction of this new product. The empirical analysis conducted of the biodiesel market in Spain shows a non-linear and inverted U among the level of competition in the market and the introduction of biodiesel by petrol stations. This result justifies the adoption of measures to promote competition in order to improve the commercialization of biofuels.
Keywords: Regulation; Innovation; Competition; Biodiesel JEL classification: L52; O32; Q42; Q48
* Corresponding author: Jordi Perdiguero. Departamento de Política Económica. Grup de Recerca en Polítiques Públiques i Regulació Econòmica (PRE). Institut de Recerca en Economia Aplicada (IREA). Avda. Diagonal 690. 08034. Barcelona. E-mail: [email protected]
** Departamento de Análisis Económico Aplicado. Grupo de Economía de las Infraestructuras y el Transporte (EIT). Universidad de Las Palmas de Gran Canaria. Facultad de Economía, Empresa y Turismo. Despacho D. 2-12. Campus de Tafira. 35017. Las Palmas. E-mail:
[email protected]; tlf: +34 928458191.
1. Introduction
The introduction of biofuels to the automotive market is a clear objective within the European Community. In fact, it has established a policy that sets minimum levels of biofuels sold in each member state. The objective of the European Community to replace fossil fuels with biofuels is twofold: firstly, to reduce its reliance on foreign energy (since it has virtually no oil production) and, secondly, to reduce the emission of pollutants to help limit climate change. Therefore, the EU set 2% of all petrol and diesel at 31 December 2005 and 5.75% at 31 December 2010 as targets for biofuels.
1Member states can themselves introduce measures to encourage the consumption of biofuels to reach this objective. These measures have focused on tax exception for firms that invest in technology to produce biofuels as well as the charging of a lower consumption tax for biofuels.
In Spain, a fiscal deduction of 10% for renewable energy investments in corporation tax and the removal of the special tax on fuel until 2013 have been introduced as a national policy measure.
2Besides, the Ministry of Industry, Tourism and Trade is considering the introduction of new measures to encourage the consumption of biofuels, introducing in the draft Law on Energy Efficiency and Renewable Energy the requirement to have a biofuel pump at all those service stations that sell more than 3 million gallons per year.
In this paper, we analyse the role market structure plays in the penetration of biofuels and how the promotion of competition and the use of regulation may be relevant instruments to encourage its implementation. To this, we link the introduction of a new product to the market, such as biodiesel, as an innovation by the company, and therefore it is a decision affected by market structure, among other things.
3The literature on industrial organization has analysed the relationship between the level of competition in the market and the level of innovation. The first empirical evidence followed the idea proposed by Schumpeter (1939), which specified a negative relationship between the level of competition and innovation processes. Other authors have found, however, positive relationships between competition and innovation, such as Nickell (1996) and Blundell, Griffith and van Reenen (1999).
1 Directive 2003/30/EC of the European Parliament and the Council of 8 May 2003.
2 These measures are included in the Order of the Ministry of Industry, Tourism and Trade ITC/2877/2008.
3 Schumpeter (1934) defines innovation as: “The introduction of a new good – that is one with which consumers are not yet familiar – or of a new quality of a good”.
In both cases, the authors use linear approximations, although Scherer (1967) had already demonstrated that the relationship between these two variables is not linear but presents an inverted U shape: it grows in the presence of relatively few competitors to reach a peak from which, by introducing more firms, the level of innovation is reduced. This empirical evidence has been contrasted by Aghion et al. (2005) for a large panel of firms in the UK.
Surprisingly, there is not a large number of empirical articles analysing the existence of this nonlinear relationship between competition and innovation and even fewer in an energy industry such as biofuels. Gilbert (2006) summarizes papers that analyze relationship between competition and innovation. He finds that exclusive rights generally lead to greater innovation incentives in more competitive markets, and viceversa.
Nevertheless, a cornerstone in this case is how to evaluate the innovation. Typically, these measures have involved either some measure of an input into the innovative process, such as R&D (Scherer, 1965), or else a proxy measure of innovative output, such as patented inventions (Acs y Audretsch, 1987). In our case we assume that the introduction of biodiesel in each of the pumps could be understood as a process of innovation. In fact, retail petrol market is a low-innovative sector: biodiesel and next electric cars are the unique product changes in last 50 years.
As already proposed, the objective of this paper is to cover this absence, to analyse the relationship between the level of competition and the introduction of biodiesel to the retail petrol market. We use data from the retail of biodiesel in the four major Spanish cities, analysing how it depends on the decision from service stations to offer biodiesel (or not).
4This article makes two main contributions to the economic literature. First, we obtain empirical evidence on the relationship between the market structure and the introduction of a new product to an energy market. Secondly, it shows first empirical evidence of how the level of competition may affect the penetration of biofuels in the market. Thus, we can draw conclusions about whether economic policy affecting the market structure can be an effective mechanism to promote the penetration of biofuels, or, conversely, whether administrative regulation is the only option available.
The empirical results confirm the existence of a nonlinear, inverted U between the introduction of this new product and the level of competition in this market. Therefore,
4 Keep in mind that a percentage of service stations are vertically integrated and therefore, the decision of this set of stations is made by the same agent, the wholesale operator. However, the fact that the wholesale operator can decide to placing the product of an individual point of sale, the agent makes it relevant to analyze the service station and not the company.
policies to promote competition lead to an increase in the penetration of biodiesel, and other measures would help achieve the objectives of using biofuels.
Although in recent years the effect of biofuel production on economic development has been deeply analysed (Ryan et al., 2006; Frondel and Peters, 2007; Charles et al., 2007;
Hahn and Cecot, 2009), regarding the effect of fiscal policy on the development of industry (Wassell and Dittmer, 2006; Vedenov and Wetzstein, 2008) and the effect on countries producing raw materials (Pousa et al., 2007; Peters and Thielmann, 2008; Lamers et al., 2008; Gucciardi and de Souza, 2009; Leite et al., 2009; Bastian-Pinto et al., 2009; Mathews and Goldsztein, 2009)
5, there is no, as far as we know, analysis of what promotes the penetration of biofuels in retail sales, a key element to ensuring the survival of the industry.
6After this introduction, the rest of the paper is structured as follows: the main characteristics of the biodiesel market in Spain are explained in section 2; section 3 includes the database used in the econometric specification, which is developed in section 4. The results are shown in section 5. The article ends by presenting the main conclusions and policy recommendations.
2. The biodiesel market in Spain
In the market for biofuels, biodiesel plays a predominant role in the Spanish market, since the production and consumption of bioethanol are much smaller than in the U.S. Most European countries, contrary to what happens in America, share this feature. For this reason, we focus on the biodiesel market.
In this market, as pointed out by the report of the Spanish regulator Comisión Nacional de la
Energía (CNE) (2005), there are numerous barriers that limit development, both withtechnical and related characteristics. With respect to the technical aspect, we find the crystallization and solidification of fuel microbial growth during pipeline transport, instability in storage and solvent power and the incompatibility with some plastic components in the retail market.
Papers related to the characteristics of the biofuel market identify some problems: the high costs of raw materials and production; regulatory uncertainties, mainly in agriculture, which
5 An example on the environmental effect of the adoption of such fuels is Sartzetakis, S., and Tsigaris, P.
(2005).
6 Articles like those of Rask (1998) and Luchansky and Monks (2009) have analysed the behaviour of supply and demand for bioethanol in the U.S., while focusing on the analysis of its elasticity and not on the diffusion or penetration of the product fuel retail market.
creates uncertainty about the availability of raw materials in the future; the absence of assurances from the producers of vehicles on the proper functioning of the engines; the lack of information for users; and, finally, the poor integration of biofuels into the distribution chain of conventional fuels.
As also indicated by CNE (2005), technical barriers should not be insurmountable for market development, as they can be solved relatively easily in the production, transportation and marketing of biodiesel blended with conventional fuel in percentages of up to 30%, as is the case of Spain.
Concerning the second type of barrier, the high costs of raw materials and production as well as the poor integration of biofuels into the distribution chain of conventional fuels are, without doubt, the most important.
7Major steps taken by European countries to compensate for the high costs of raw materials and production, as we noted, have been tax exemption, partial or total. For the specific case of Spain, the main legislative reference is the Order of the Ministry of Industry, Tourism and Commerce ITC/2877/2008 to regulate a mechanism for promoting the use of biofuels and the like for transport, making sense, and the Law 34/1998, which established annual targets for biofuel use in the Spanish territory. Among the tax measures introduced in this Order are the establishment of a zero tax rate on biofuels until 31 December 2012.
8This exemption seeks to compensate for the higher cost of biofuel production with respect to traditional fuels and it takes into account their lower polluting capacity.
Measures to promote research and development techniques that reduce production costs have been established in the production segment.
9Also, firms with a turnover level below 5 million are entitled to a deduction in the full quota of 10% of investments in equipment for renewable energy use and to purchase equipment for processing agricultural, forestry or waste oil into biofuels.
107 Although there is some uncertainty about the future availability of raw materials, the existence of an international market to some extent helps to overcome that barrier. Similarly, there are already many automobile manufacturers that ensure the smooth operation of their vehicles in the case of using biofuels.
Concerning the lack of information, measures to identify suppliers of biofuel and diffusion measures of the environmental benefits of biofuels have been instituted.
8 Article 6.5 of Law 53/2002 of 30 December.
9 The latter stresses Law 55/1999 of 29 December on fiscal administrative and social order, where amending Articles 33 and 35.4 of Law 43/1995 on corporate income tax look at the tax deductions for activities of research, development and technological innovation and investment in environmental protection.
10 Law 24/2001 of 27 December on fiscal, administrative and social order amending Article 122 of Law 43/1995.
In addition to these tax measures, a regulation that set the minimum amounts of biofuels that operators must compulsorily consume has been passed. These biofuels are consumed by mixing with conventional fossil fuels.
Due to these measures production capacity shows a remarkable increase in recent years.
11However, they have not yielded a competitive Spanish market for biodiesel, so it has lost market share in recent years, leading the ratio utilization rates/capacity of producing plants to the lowest levels in history, making it in most cases economically untenable.
Figure I. Capacity, production and biodiesel imports in Spain. Tonnes per year
0 500000 1000000 1500000 2000000
2005 2006 2007 2008
Production
Capacity
Total consumption
Consumption of domestically produced Imports
Source: APPA Biocarburantes
From Figure I and in Annex I, we can discern that only 4 of the 36 plants in 2008 (11%) are at a capacity utilization above 50%. Another 9 plants (25%) produced with a level of capacity between 10 and 50%, while the remaining 64% (23 plants) used between 0 and 10% of their available capacity.
One of the main reasons that consumption does not follow the path of production capacity is its limited inclusion in the distribution chain of conventional fuels. Thus, the percentage of service stations that dispense fuel is very small: only 8.6% of gas stations in our sample.
11 Annex I includes the list of biodiesel production plants operating in Spain during 2008 and those planned for launch during 2009.
This aspect can also be inferred from the trend in the consumption of biodiesel in the past 2 years.
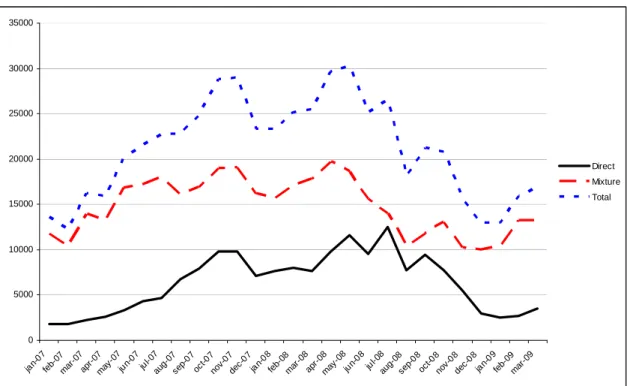
Figure II. Monthly evolution of the consumption of biodiesel. Spain. 2007–2009
0 5000 10000 15000 20000 25000 30000 35000
jan-07 feb-07
mar-07 apr-07
ma y-07
jun-07 jul-07
aug-07 sep
-07 oct-07
nov-07 dec-07
jan-08 feb-08
ma r-08
apr-08 ma
y-08 jun-08
jul-08 aug-08
sep-08 oct-08
nov-08 dec-08
jan-09 feb-09
mar-09
Direct Mixture Total
Source: Corporación de Reservas Estratégicas de Productos Petrolíferos (CORES)
As shown in Figure II, the total consumption of this biofuel has fallen since mid 2008 at a monthly negative average rate change of 4.7%, especially in direct sales, although its use for increasing the octane of conventional diesel has also suffered a substantial reduction.
We can summarize that the biodiesel market outlook for Spain is not encouraging. The production segment is oversized, with a production capacity of 2,070,020 tons per year in 2008, 12 times the consumption that occurred in that year. Also, the segment is clearly not competitive with foreign producers, as evidenced by the increase in imports in recent years.
These facts result in the economic infeasibility of a large number of existing plants, except if consumption increases further in the coming years, both in Spain and Europe.
In the retail marketing segment, the integration of biodiesel into channels of conventional
fuels is almost zero, limiting the consumption of this fuel and decreasing the viability of the
productive segment. As we shall see later, an element that may be helping the lack of
penetration of biodiesel in the retail segment is the reduced competition in the Spanish
gasoline market, as stated by Perdiguero (2010), Perdiguero and Jiménez (2009) and
Jiménez and Perdiguero (2009).
3. Data
In order to estimate how the level of competition may affect the adoption of a new product such as biodiesel, we have information on all the service stations operating in the four major Spanish cities: Madrid, Barcelona, Seville and Bilbao.
12For the construction of the key variable, the level of competition in the market, we followed the strategy for the sector described by Shepard (1993), and Perdiguero and Borrell (2009), estimating the number of competitors that exist within a distance of half a mile. This calculation required the georeferencing of each of the 245 petrol stations, fixing the longitude and latitude and calculating the Euclidean distance to other stations of different brands, as a proxy for competition in the market.
13This calculation was performed using the Matlab software.
14Once we had calculated this distance, we obtained the number of service stations within half a mile.
15Similarly, for each of the stations, we have information on whether or not biodiesel is sold and if it provides (or not) the following services: grocery store, open 24 hours, car wash, self-service, workshop repair, the sale of gas canisters and/or bread and if there is a bar/restaurant.
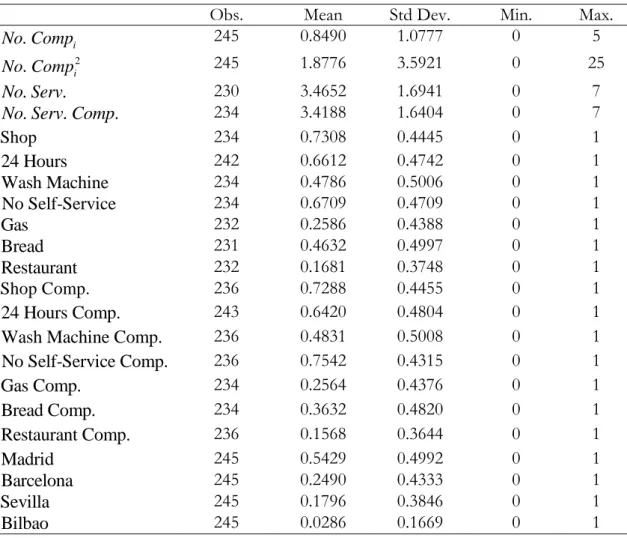
This information has been obtained from the websites of different companies. We contacted those service stations that had no website by telephone and in the case of no response we visited the point of sale for such information, in the cases where it was possible. Despite these efforts we do not have information for all the service stations, which makes the sample slightly reduced in some of the estimates, but it is always above 90% of service stations. The next table shows the descriptive statistics of the variables mentioned above:
12 We have information on the ten biggest cities in Spain in terms of population but only in the four mentioned is there any retailer that provides biodiesel.
13 In the Spanish gasoline market, there is no competition between the stations of the same brand as the company's wholesale fixes the final retail price directly or indirectly. Thus, only the number of stations that are of different brands were calculated.
14 The Matlab code for the calculation of these distances is available on request from the authors’.
15 1/2 mile = 804.672 metres.
Table I. Descriptive statistics
Obs. Mean Std Dev. Min. Max.
. i
No Comp
245 0.8490 1.0777 0 5
. i2
No Comp
245 1.8776 3.5921 0 25
. .
No Serv
230 3.4652 1.6941 0 7
. . .
No Serv Comp
234 3.4188 1.6404 0 7
Shop
234 0.7308 0.4445 0 1
24 Hours
242 0.6612 0.4742 0 1
Wash Machine
234 0.4786 0.5006 0 1
No Self-Service
234 0.6709 0.4709 0 1
Gas
232 0.2586 0.4388 0 1
Bread
231 0.4632 0.4997 0 1
Restaurant
232 0.1681 0.3748 0 1
Shop Comp.
236 0.7288 0.4455 0 1
24 Hours Comp.
243 0.6420 0.4804 0 1
Wash Machine Comp.
236 0.4831 0.5008 0 1
No Self-Service Comp.
236 0.7542 0.4315 0 1
Gas Comp.
234 0.2564 0.4376 0 1
Bread Comp.
234 0.3632 0.4820 0 1
Restaurant Comp.
236 0.1568 0.3644 0 1
Madrid
245 0.5429 0.4992 0 1
Barcelona
245 0.2490 0.4333 0 1
Sevilla
245 0.1796 0.3846 0 1
Bilbao
245 0.0286 0.1669 0 1
Source: Own elaboration
Of the total of 245 service stations in the 4 cities considered, an average of 1 competitor in half a mile (0.849) is not achieved. The minimum number of competitors in that distance is 0 and the maximum is 5. The stations have more than 3 of the 7 characteristics analysed, being shop the feature more present. Regarding the distribution by city, Madrid has more than half the stations, followed by Barcelona, Seville and Bilbao.
4. Hypothesis and empirical approximation
As described above, the introduction of biodiesel have been a product innovation in this market and also for retailers. According to our hypothesis, it is influenced by the number of competitors that each outlet has in a predetermined radius that the literature determines as effective competition. To approximate this we estimate a logit model explaining the probability of selling biodiesel from the following expression:
2
0 1 . 2 .
i i i j ij
Y
No Comp
No Comp
X
where
Yiis a dummy variable that takes the value 1 if the service station i sells biodiesel and 0 otherwise. This decision depends on the number of rivals who have a service station within half a mile (
No Comp. i) and its square (
No Comp. i2) and a set of control variables (
Xij). To satisfy the inverted U relationship described in the literature, we should observe a positive sign in the coefficient of the number of rivals in half a mile (
1 0) and a negative coefficient for its square (
2 0). These are the two hypotheses that we test empirically.
Among the control variables (
Xij), we include dummies for the different cities, the different services offered by each retail outlet and the services offered by the nearest competitor. The variables in the different cities take the value 1 if the station is located in the city and 0 otherwise. These variables should pick up possible differences in local legislation or in the sensitivity of consumers faced by the innovation of introducing this new product.
Regarding services offered by the petrol station, the possibility that these variables are considered as strategic for the competition should be set out, so that each station could include other services to compete with their rivals, rather than offering the new product.
However, the service stations that have introduced other services in the past and therefore do not have many more services to add may have a greater predisposition to introduce this new product at the point of sale. As already indicated by Grabowski (1968), companies that succeed in introducing innovations to the market have a greater willingness to innovate.
Therefore, the relationship between other services offered by the service station and the probability of selling biodiesel is a matter to be determined empirically. To the services described above we introduce both the grouped shape (the number of services offered by the station or the nearest rival) and an individual one (a dummy variable for each service, which takes the value 1 if the petrol station offers the service and 0 otherwise).
We must note that, in addition to the institutional differences that may exist between regions and that would be reflected in the dummy variables for the cities, there may be heterogeneity among the service stations in the regions. To solve this problem of heteroskedasticity and to obtain a robust variance–covariance matrix, we introduce a cluster in a city that takes into account this feature of the data.
Finally, we note that the sample is a small number of positive cases. In fact, 8.6% of the
total number of service stations in these 4 cities offers biodiesel (21 outlets). This low level
of values can lead to the logit estimator reaching results that might not be efficient. To
solve this problem, we estimate the model described by a "complementary log-log model".
This type of logistic model takes into account that the database can be unbalanced, because there is either a low probability of occurrence or a high probability. Thus, the estimate would be efficient. The results obtained are shown in the following section.
5. Results
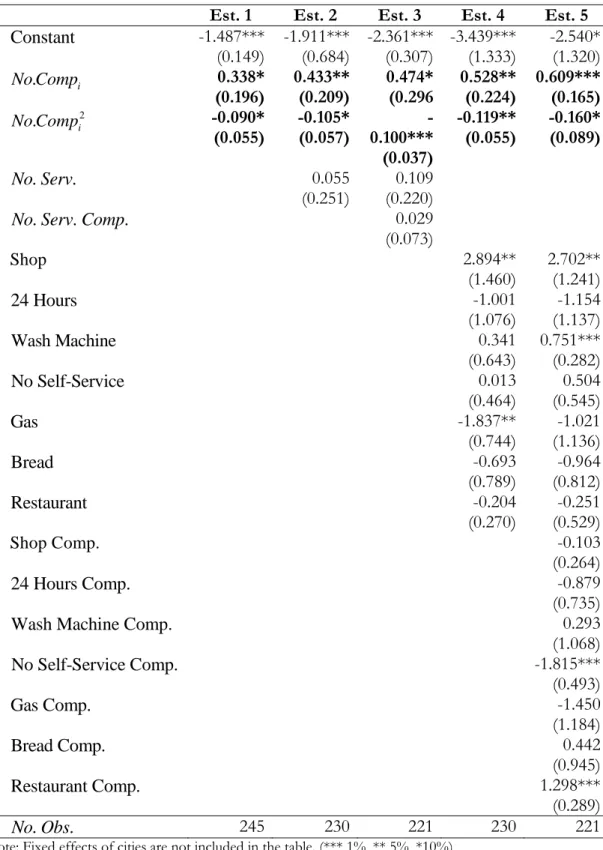
Table II contains the estimation using the "complementary log-log model",
16in five different specifications depending on the number of variables included: the first only includes the number of rivals, the second includes the number of available services in aggregate, the third adds the number of services of the rivals, the fourth estimation includes the number of rivals and the services of the petrol stations in disaggregate and, finally, the fifth also adds the services of rival stations. These different specifications will help us verify the robustness of our analysis and show that there are problems of omission of relevant variables that might bias our results.
16 Annex 2 presents the empirical results of applying a logit estimator. We can see that the results did not change significantly.
Table II. Complementary log-log models, robust
Est. 1 Est. 2 Est. 3 Est. 4 Est. 5
Constant
-1.487***
(0.149) -1.911***
(0.684) -2.361***
(0.307) -3.439***
(1.333) -2.540*
(1.320)
. i
No Comp
0.338*
(0.196) 0.433**
(0.209) 0.474*
(0.296 0.528**
(0.224) 0.609***
(0.165)
. i2No Comp
-0.090*
(0.055) -0.105*
(0.057) - 0.100***
(0.037)
-0.119**
(0.055) -0.160*
(0.089)
. .No Serv
0.055
(0.251) 0.109 (0.220)
. . .No Serv Comp
0.029
(0.073)
Shop
2.894**
(1.460) 2.702**
(1.241)
24 Hours
-1.001
(1.076)
-1.154 (1.137)
Wash Machine
0.341
(0.643) 0.751***
(0.282)
No Self-Service
0.013
(0.464)
0.504 (0.545)
Gas
-1.837**
(0.744) -1.021 (1.136)
Bread
-0.693
(0.789)
-0.964 (0.812)
Restaurant
-0.204
(0.270) -0.251 (0.529)
Shop Comp.
-0.103
(0.264)
24 Hours Comp.
-0.879
(0.735)
Wash Machine Comp.
0.293
(1.068)
No Self-Service Comp.
-1.815***
(0.493)
Gas Comp.
-1.450
(1.184)
Bread Comp.
0.442
(0.945)
Restaurant Comp.
1.298***
(0.289)
. .No Obs
245 230 221 230 221
Note: Fixed effects of cities are not included in the table. (*** 1%, ** 5%, *10%)
The estimations show that the coefficient of the number of rivals who are half a mile away is positive and significant in all cases as well as its square being negative and significant.
This empirical evidence indicates that there seems to be an inverted U-shaped relationship
between competition and opportunities to innovate in the market, as indicated by Aghion et al (2005).
Also, they show that the services offered by the outlet do not have a significant effect on the possibility of selling biodiesel, as well as the services offered by the nearest rival. Most of the services variables are not significant, and those that are show both positive and negative signs. Only in specification five can we observe that two services offered by the gas station are significant and positive (shop and car wash). This result would support the idea that service stations that have introduced other goods or services before are more likely to introduce biodiesel.
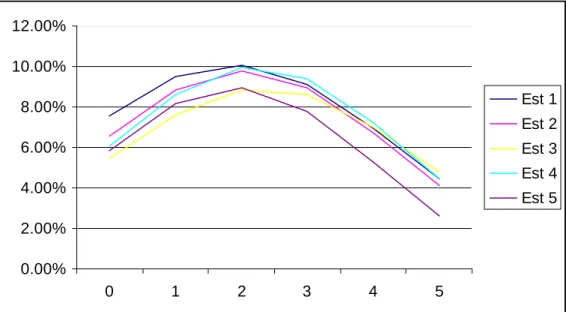
To show more clearly the inverted U relationship between the incorporation of biodiesel and the number of competitors in half a mile, we perform a series of simulations to determine the likelihood of its existence, as summarized in the figure below.
Figure III. Evolution of the probability of selling biodiesel depending on the number of competitors in half a mile
0.00%
2.00%
4.00%
6.00%
8.00%
10.00%
12.00%
0 1 2 3 4 5
Est 1 Est 2 Est 3 Est 4 Est 5
Source: Own elaboration
As seen in Figure III, in all the specifications, the maximum probability is reached in a
market structure with 2 opponents in less than half mile. Considering that the average rivals
in our sample do not reach 0.9, we conclude that there is indeed potential for increasing the
marketing of biodiesel incident to market structure, i.e. increasing the level of competition
that exists today. We should note that Spain has one of the lowest densities of petrol per
thousand inhabitants in all of Europe, which we estimate would explain, at least in part, the low level of commercialization of biodiesel.
It should be noted, however, that the chances of introducing the new product are low in all cases. Even with the number of rivals that maximizes the probability of introducing innovation (2 competitors), this probability barely reaches 10%. Therefore, the increased competition would be a measure that helps increase the penetration of biodiesel in Spain, and thus complements fiscal and regulatory measures put in place today.
6. Concluding remarks
The introduction of renewable energy to help reduce CO
2emissions and therefore to comply with environmental commitments is a primary objective in Europe. Both in Europe and in Spain several incentives have been introduced for the development of the biofuel industry and more specifically biodiesel. As a result of these measures, there has been a steady increase in production capacity in Spain, which contrasts with the moderate growth in demand and the strong increase in the percentage of imports. This fact causes many plants to operate below 10% of their capacity, a threshold that make the continuity in the market unviable.
To explain the low penetration of biodiesel consumption in Spain, we have discussed how service stations make the decision to offer this new product. Following the industrial economics literature, where empirical evidence exists on the effect of the market structure on innovation, we based the study on the existence of a nonlinear effect in an inverted U- shaped form: the greater the number of competitors in a market increases the probability of innovation, but beyond a certain level, this probability decreases.
The application of this approach to the four major Spanish cities shows that for biodiesel this functional form actually exists. The presence of one or two competitors within half a mile increases the probability of introducing the new fuel while having greater competitive pressure reduces the chance of having it.
Considering that Spain has one of the lowest densities of petrol stations in Europe, and
that the transition from public monopoly to the free market cannot yet generate effective
competition in the market, Spain can provide consumption levels of biofuels that are too
low, at least in part, in relation to its market structure. Promoting the consumption of this
type of fuel is key to maintaining a recently established bloated generation industry and the
current levels of consumption are completely unsustainable.
Given the empirical results obtained in this study, a way to promote the consumption of
such fuel would be to introduce more competition into the market, either through new
entrants or by facilitating a change of brand of the retailers established in the market, which
would mean that there are traders of different brands in each market. However, these
measures would probably have a limited effect, since even with the optimal level of
competitors the probability of selling biodiesel only reaches 10%. Therefore, measures to
promote competition can help increase the penetration of biodiesel in Spain, but there
should be accompanying measures, fiscal and regulatory measures already introduced in the
market, if we are to achieve the objectives proposed by the European Union.
References
Acs, Z.J. & Audretsch, D. B. (1987). Innovation, Market Structure and Firm Size. Review of
Economics & Statistics, Vol. LXIX (4), 567-574.Aghion, P., Bloom, N., Blundell, R., Griffith, R., & Howitt, P. (2005). Competition and innovation: An inverted-U relationship. The Quarterly Journal of Economics, Vol. 2(120), 701–728.
Bastian-Pinto, C., Brandao, L., & Hahn, W.J. (2009). Flexibility as a source of value in the production of alternative fuels: The ethanol case. Energy Economics, forthcoming.
Blundell, R., Griffith, R., & van Reenen, J. (1999). Market share, market value and innovation in a panel of British manufacturing firms. Review of Economic Studies, Vol. 66, 529–554.
Charles, M.B., Ryan, R., Ryan, N., & Oloruntoba, R. (2007). Public policy and biofuels: The way forward? Energy Policy, Vol. 35, 5737–5746.
Comisión Nacional de la Energía (2005) Informe sobre el marco regulatorio de los biocarburantes,
con identificación de barreras para su desarrollo en España y especial consideración de los aspectos asociados a las actividades de logística y distribución. Madrid: Comisión Nacional de Energía.Frondel, M., & Peters, J. (2007). Biodiesel: A new Oildorado? Energy Policy, Vol. 35, 1675–
1684.
Gilbert, R. (2006). Looking for Mr. Schumpeter: Where are we in the competition- innovation debate? Innovation Policy and the Economy, Vol. 6, 159-215.
Grabowski, H.G. (1968). The determinants of industrial research and development: A study of the chemical, drug, and petroleum industries. Journal of Political Economy, Vol.
76(2), 292–306.
Gucciardi, C.A., & Nildo de Souza, J. (2009). Brazilian biodiesel policy: Social and environmental considerations of sustainability. Energy, forthcoming.
Hahn, R., & Cecot, C. (2009). The benefits and costs of ethanol: An evaluation of the government's analysis. Journal of Regulatory Economics, Vol. 35, 275–295.
Jiménez, J.L. & Perdiguero, J. (2009). (No) Competition in the Spanish retailing gasoline market: A variance filter approach. IREA Working paper. Available at:
http://www.pcb.ub.es/xreap/aplicacio/fitxers/XREAP2009-5.pdf
Lamers, P., McCormick, K., & Hilbert, J.A. (2008). The emerging liquid biofuel market in Argentina: Implications for domestic demand and international trade. Energy Policy, Vol.
36, 1479–1490.
Leite, R.C., Leal, M.R., Cortez, L.A., Griffin, W.M., & Scandiffio, M.I. (2009). Can Brazil replace 5% of the 2025 gasoline world demand with ethanol? Energy, forthcoming.
Luchansky, M.L., & Monks, J. (2009). Supply and demand elasticities in the U.S. ethanol fuel market. Energy Economics, forthcoming.
Mathews, J.A., & Goldsztein, H. (2009). Capturing latecomer advantages in the adoption of biofuels: The case of Argentina. Energy Policy, Vol. 37, 326–337.
Nickell, S. (1996). Competition and corporate performance. Journal of Political Economy, Vol.
104, 724–746.
Perdiguero, J. (2010) Dynamic Pricing in the Spanish Gasoline Market: A Tacit Collusion Equilibrium. Energy Policy, Vol. 38(4), 1931-1937.
Perdiguero, J., & Borrell, J.R. (2009). Driving competition in local markets. Mimeo.
Perdiguero, J., & Jiménez, J.L. (2009). ¿Competencia o colusión en el mercado de gasolina?
Una aproximación a través del parámetro de conducta. Revista de Economía Aplicada, Vol.
17(50), 27–45.
Peters, J., & Thielmann, S. (2008). Promoting biofuels: Implications for developing countries. Energy Policy, Vol. 36, 1538–1544.
Pousa, G., Santos, A., & Suarez, P. (2007). History and policy of biodiesel in Brazil. Energy
Policy, Vol. 35, 5393–5398.Rask, K. (1998). Clean air and renewable fuels: The market for fuel ethanol in the US from 1984 to 1993. Energy Economics, Vol. 20, 325–345.
Ryan, L., Convery, F., & Ferreira, S. (2006). Stimulating the use of biofuels in the European Union: Implications for climate change policy. Energy Policy, Vol. 34, 3184–3194.
Sartzetakis, S., & Tsigaris, P. (2005). Environmental externalities in the presence of network effects: Adoption of low emission technologies in the automobile market.
Journal of Regulatory Economics, Vol. 28(3), 309–326.
Scherer, F. (1967). Market structure and the employment of scientists and engineers.
American Economic Review, Vol. 73, 61–66.
Schumpeter, J. (1934). The theory of economic development. Cambridge, MA: Harvard University Press.
Schumpeter, J. (1939). Business cycles: A theoretical, historical and statistical analysis of the Capitalist
process. London: Allen and Unwin.Shepard, A. (1993). Contractual form, retail price, and asset characteristics in gasoline retailing. The RAND Journal of Economics, Vol. 24(1), 58–77.
Vedenov, D., & Wetzstein, M. (2008). Toward an optimal U.S. ethanol fuel subsidy. Energy
Economics, Vol. 30, 2073–2090.Wassell Jr., Ch.S., & Dittmer, T.P. (2006). Are subsidies for biodiesel economically
efficient? Energy Policy, Vol. 34, 3993–4001.
Annex I. Production and projections of biodiesel production in Spain Table A.I.1. Biodiesel plants in Spain on 31 December 2008
Firm Locality Province Capacity (t)
Infinita Renovables Castellón Castellón 300000
Bioenergética Extremeña 2020 Valdetorres Badajoz 250000
Bio-Oils Huelva I Palos de la Frontera Huelva 250000
Combustibles Ecológicos Biotel Barajas de Melo Cuenca 150000
Biocarburantes CLM Ocaña Toledo 105000
Biodiesel Aragón Altorricón Huesca 100000
Linares Biodiesel Technology Linares Jaén 100000
Biocom Energía Algemesí Valencia 75000
Biodiesel Caparroso Caparroso Navarra 70000
Biocombustible de Cuenca Cuenca Cuenca 50000
Ecoproductos Cast. La Mancha Montalbo Cuenca 50000
Bionet Europa Reus Tarragona 50000
Entabán Biocomb. Guadalquiv. Sevilla Sevilla 50000
Biodiesel Castilla la Mancha Santa Olalla Toledo 45000
Biodiesel de Andalucía 2004 Fuentes de Andalucía Sevilla 40700
Combunet Monzón Huesca 40000
Energía Gallega Alternativa Cerceda A Coruña 40000
Bionor Berantevilla Berantevilla Álava 35320
Biocarburantes de Galicia Begonte Lugo 35000
Grupo Ecológico Natural Llucmajor Baleares 33000
Stocks del Vallés Montmeló Barcelona 31000
Hispanergy Puertollano Puertollano Ciudad Real 25000
Entabán Biocomb. Del Pirineo Alcalá de Gurrea Huesca 25000
Biocarburante Almadén Almadén Ciudad Real 21000
Biocarburante de Castilla Valdescorriel Zamora 20000
Diesol Alcalá de Henares Madrid 15000
Bioteruel Albalate del Arzobispo Teruel 10000
Comb. Ecol. Mediterráneo Elda Alicante 10000
Albabío Andalucía Níjar Almería 6000
Biocarburos de Almanzora Cuevas de Almanzora Almería 6000
Biodiesel Carburantes Carranque Toledo 6000
Bercam Los Yébenes Toledo 6000
Bionorte San Martín del Rei Asturias 5000
Biocomb. De Castilla y León San Cristóbal de Entrevías Zamora 6000
Transportes Ceferino Martínez Vilafant Girona 5000
Asthor Biodiesel Gijón Asturias 4000
TOTAL 2070020
Source: APPA Biocarburantes
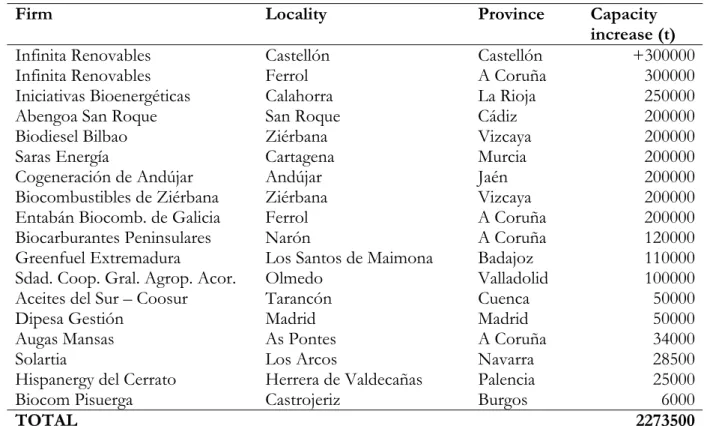
Table A.I.2. New biodiesel production capacity in Spain. Year 2009
Firm Locality Province Capacity
increase (t)
Infinita Renovables Castellón Castellón +300000
Infinita Renovables Ferrol A Coruña 300000
Iniciativas Bioenergéticas Calahorra La Rioja 250000
Abengoa San Roque San Roque Cádiz 200000
Biodiesel Bilbao Ziérbana Vizcaya 200000
Saras Energía Cartagena Murcia 200000
Cogeneración de Andújar Andújar Jaén 200000
Biocombustibles de Ziérbana Ziérbana Vizcaya 200000
Entabán Biocomb. de Galicia Ferrol A Coruña 200000
Biocarburantes Peninsulares Narón A Coruña 120000
Greenfuel Extremadura Los Santos de Maimona Badajoz 110000
Sdad. Coop. Gral. Agrop. Acor. Olmedo Valladolid 100000
Aceites del Sur – Coosur Tarancón Cuenca 50000
Dipesa Gestión Madrid Madrid 50000
Augas Mansas As Pontes A Coruña 34000
Solartia Los Arcos Navarra 28500
Hispanergy del Cerrato Herrera de Valdecañas Palencia 25000
Biocom Pisuerga Castrojeriz Burgos 6000
TOTAL 2273500
Source: APPA Biocarburantes
Table A.I.3. New biodiesel production capacity in Spain projected to 2010
Firm Locality Province Capacity
increase (t)
Bio-Oils Huelva II Palos Huelva 250000
Greenfuel Aragón Andorra Teruel 110000
Biodiesel de la Ribera Milagro Navarra 16100
TOTAL 376100
Source: APPA Biocarburantes
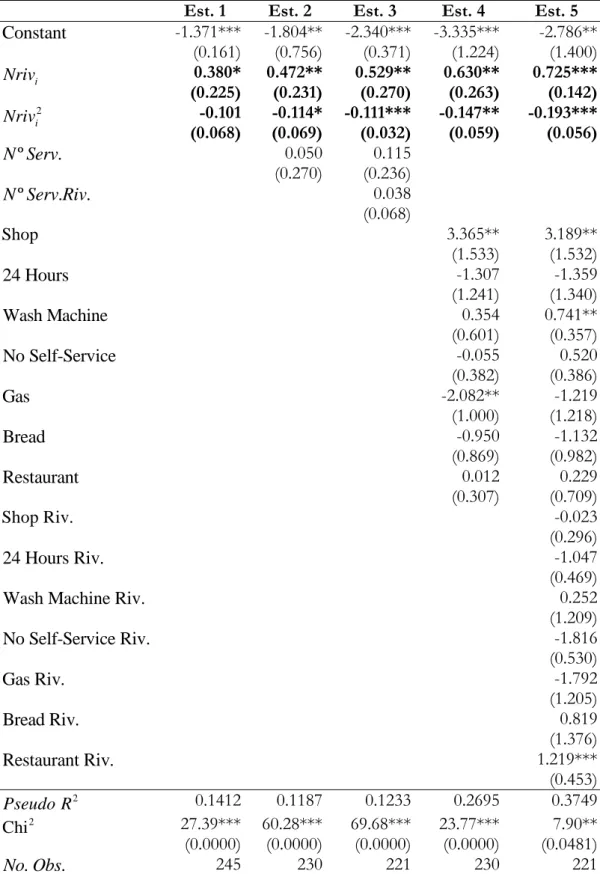
Annex II. Estimated logit model
Table A.II.1. Econometric estimation. Logit model, robust
Est. 1 Est. 2 Est. 3 Est. 4 Est. 5
Constant
-1.371***
(0.161) -1.804**
(0.756) -2.340***
(0.371) -3.335***
(1.224) -2.786**
(1.400)
Nrivi
0.380*
(0.225) 0.472**
(0.231) 0.529**
(0.270) 0.630**
(0.263) 0.725***
(0.142)
2
Nrivi
-0.101
(0.068) -0.114*
(0.069) -0.111***
(0.032) -0.147**
(0.059) -0.193***
(0.056)
º .
N Serv
0.050
(0.270) 0.115 (0.236)
º . .
N Serv Riv
0.038
(0.068)
Shop
3.365**
(1.533) 3.189**
(1.532)
24 Hours
-1.307
(1.241) -1.359 (1.340)
Wash Machine
0.354
(0.601) 0.741**
(0.357)
No Self-Service
-0.055
(0.382) 0.520 (0.386)
Gas
-2.082**
(1.000) -1.219 (1.218)
Bread
-0.950
(0.869) -1.132 (0.982)
Restaurant
0.012
(0.307) 0.229 (0.709)
Shop Riv.
-0.023
(0.296)
24 Hours Riv.
-1.047
(0.469)
Wash Machine Riv.
0.252
(1.209)
No Self-Service Riv.
-1.816
(0.530)
Gas Riv.
-1.792
(1.205)
Bread Riv.
0.819
(1.376)
Restaurant Riv.
1.219***
(0.453)
Pseudo R20.1412 0.1187 0.1233 0.2695 0.3749
Chi2
27.39***
(0.0000) 60.28***
(0.0000) 69.68***
(0.0000) 23.77***
(0.0000) 7.90**
(0.0481)
. .No Obs
245 230 221 230 221
Note: Fixed effects of cities are not reported. (*** 1%, ** 5%, *10%)
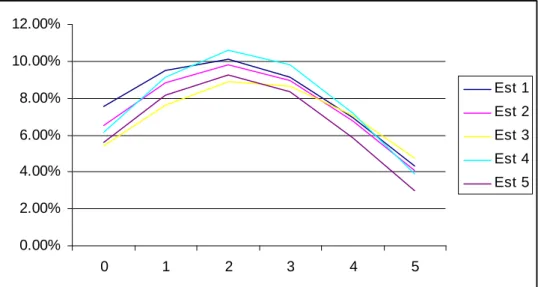
Figure A.II.1. Simulation of the effect of rivals on the probability of introducing biodiesel
0.00%
2.00%
4.00%
6.00%
8.00%
10.00%
12.00%
0 1 2 3 4 5
Est 1 Est 2 Est 3 Est 4 Est 5
Source: Own elaboration
F
UNDACIÓN DE LASC
AJAS DEA
HORROS DOCUMENTOS DE TRABAJOÚltimos números publicados
159/2000 Participación privada en la construcción y explotación de carreteras de peaje Ginés de Rus, Manuel Romero y Lourdes Trujillo
160/2000 Errores y posibles soluciones en la aplicación del Value at Risk Mariano González Sánchez
161/2000 Tax neutrality on saving assets. The spahish case before and after the tax reform Cristina Ruza y de Paz-Curbera
162/2000 Private rates of return to human capital in Spain: new evidence F. Barceinas, J. Oliver-Alonso, J.L. Raymond y J.L. Roig-Sabaté 163/2000 El control interno del riesgo. Una propuesta de sistema de límites
riesgo neutral
Mariano González Sánchez
164/2001 La evolución de las políticas de gasto de las Administraciones Públicas en los años 90 Alfonso Utrilla de la Hoz y Carmen Pérez Esparrells
165/2001 Bank cost efficiency and output specification Emili Tortosa-Ausina
166/2001 Recent trends in Spanish income distribution: A robust picture of falling income inequality Josep Oliver-Alonso, Xavier Ramos y José Luis Raymond-Bara
167/2001 Efectos redistributivos y sobre el bienestar social del tratamiento de las cargas familiares en el nuevo IRPF
Nuria Badenes Plá, Julio López Laborda, Jorge Onrubia Fernández
168/2001 The Effects of Bank Debt on Financial Structure of Small and Medium Firms in some Euro- pean Countries
Mónica Melle-Hernández
169/2001 La política de cohesión de la UE ampliada: la perspectiva de España Ismael Sanz Labrador
170/2002 Riesgo de liquidez de Mercado Mariano González Sánchez
171/2002 Los costes de administración para el afiliado en los sistemas de pensiones basados en cuentas de capitalización individual: medida y comparación internacional.
José Enrique Devesa Carpio, Rosa Rodríguez Barrera, Carlos Vidal Meliá
172/2002 La encuesta continua de presupuestos familiares (1985-1996): descripción, representatividad y propuestas de metodología para la explotación de la información de los ingresos y el gasto.
Llorenc Pou, Joaquín Alegre
173/2002 Modelos paramétricos y no paramétricos en problemas de concesión de tarjetas de credito.
Rosa Puertas, María Bonilla, Ignacio Olmeda
174/2002 Mercado único, comercio intra-industrial y costes de ajuste en las manufacturas españolas.
José Vicente Blanes Cristóbal
175/2003 La Administración tributaria en España. Un análisis de la gestión a través de los ingresos y de los gastos.
Juan de Dios Jiménez Aguilera, Pedro Enrique Barrilao González 176/2003 The Falling Share of Cash Payments in Spain.
Santiago Carbó Valverde, Rafael López del Paso, David B. Humphrey Publicado en “Moneda y Crédito” nº 217, pags. 167-189.
177/2003 Effects of ATMs and Electronic Payments on Banking Costs: The Spanish Case.
Santiago Carbó Valverde, Rafael López del Paso, David B. Humphrey
178/2003 Factors explaining the interest margin in the banking sectors of the European Union.
Joaquín Maudos y Juan Fernández Guevara
179/2003 Los planes de stock options para directivos y consejeros y su valoración por el mercado de valores en España.
Mónica Melle Hernández
180/2003 Ownership and Performance in Europe and US Banking – A comparison of Commercial, Co- operative & Savings Banks.
Yener Altunbas, Santiago Carbó y Phil Molyneux
181/2003 The Euro effect on the integration of the European stock markets.
Mónica Melle Hernández
182/2004 In search of complementarity in the innovation strategy: international R&D and external knowledge acquisition.
Bruno Cassiman, Reinhilde Veugelers
183/2004 Fijación de precios en el sector público: una aplicación para el servicio municipal de sumi- nistro de agua.
Mª Ángeles García Valiñas
184/2004 Estimación de la economía sumergida es España: un modelo estructural de variables latentes.
Ángel Alañón Pardo, Miguel Gómez de Antonio
185/2004 Causas políticas y consecuencias sociales de la corrupción.
Joan Oriol Prats Cabrera
186/2004 Loan bankers’ decisions and sensitivity to the audit report using the belief revision model.
Andrés Guiral Contreras and José A. Gonzalo Angulo
187/2004 El modelo de Black, Derman y Toy en la práctica. Aplicación al mercado español.
Marta Tolentino García-Abadillo y Antonio Díaz Pérez 188/2004 Does market competition make banks perform well?.
Mónica Melle
189/2004 Efficiency differences among banks: external, technical, internal, and managerial Santiago Carbó Valverde, David B. Humphrey y Rafael López del Paso
190/2004 Una aproximación al análisis de los costes de la esquizofrenia en españa: los modelos jerár- quicos bayesianos
F. J. Vázquez-Polo, M. A. Negrín, J. M. Cavasés, E. Sánchez y grupo RIRAG 191/2004 Environmental proactivity and business performance: an empirical analysis
Javier González-Benito y Óscar González-Benito
192/2004 Economic risk to beneficiaries in notional defined contribution accounts (NDCs) Carlos Vidal-Meliá, Inmaculada Domínguez-Fabian y José Enrique Devesa-Carpio
193/2004 Sources of efficiency gains in port reform: non parametric malmquist decomposition tfp in- dex for Mexico
Antonio Estache, Beatriz Tovar de la Fé y Lourdes Trujillo 194/2004 Persistencia de resultados en los fondos de inversión españoles
Alfredo Ciriaco Fernández y Rafael Santamaría Aquilué
195/2005 El modelo de revisión de creencias como aproximación psicológica a la formación del juicio del auditor sobre la gestión continuada
Andrés Guiral Contreras y Francisco Esteso Sánchez
196/2005 La nueva financiación sanitaria en España: descentralización y prospectiva David Cantarero Prieto
197/2005 A cointegration analysis of the Long-Run supply response of Spanish agriculture to the com- mon agricultural policy
José A. Mendez, Ricardo Mora y Carlos San Juan
198/2005 ¿Refleja la estructura temporal de los tipos de interés del mercado español preferencia por la li- quidez?
Magdalena Massot Perelló y Juan M. Nave
199/2005 Análisis de impacto de los Fondos Estructurales Europeos recibidos por una economía regional:
Un enfoque a través de Matrices de Contabilidad Social M. Carmen Lima y M. Alejandro Cardenete
200/2005 Does the development of non-cash payments affect monetary policy transmission?
Santiago Carbó Valverde y Rafael López del Paso
201/2005 Firm and time varying technical and allocative efficiency: an application for port cargo han- dling firms
Ana Rodríguez-Álvarez, Beatriz Tovar de la Fe y Lourdes Trujillo 202/2005 Contractual complexity in strategic alliances
Jeffrey J. Reuer y Africa Ariño
203/2005 Factores determinantes de la evolución del empleo en las empresas adquiridas por opa Nuria Alcalde Fradejas y Inés Pérez-Soba Aguilar
204/2005 Nonlinear Forecasting in Economics: a comparison between Comprehension Approach versus Learning Approach. An Application to Spanish Time Series
Elena Olmedo, Juan M. Valderas, Ricardo Gimeno and Lorenzo Escot
205/2005 Precio de la tierra con presión urbana: un modelo para España Esther Decimavilla, Carlos San Juan y Stefan Sperlich
206/2005 Interregional migration in Spain: a semiparametric analysis Adolfo Maza y José Villaverde
207/2005 Productivity growth in European banking
Carmen Murillo-Melchor, José Manuel Pastor y Emili Tortosa-Ausina
208/2005 Explaining Bank Cost Efficiency in Europe: Environmental and Productivity Influences.
Santiago Carbó Valverde, David B. Humphrey y Rafael López del Paso
209/2005 La elasticidad de sustitución intertemporal con preferencias no separables intratemporalmente: los casos de Alemania, España y Francia.
Elena Márquez de la Cruz, Ana R. Martínez Cañete y Inés Pérez-Soba Aguilar
210/2005 Contribución de los efectos tamaño, book-to-market y momentum a la valoración de activos: el caso español.
Begoña Font-Belaire y Alfredo Juan Grau-Grau
211/2005 Permanent income, convergence and inequality among countries José M. Pastor and Lorenzo Serrano
212/2005 The Latin Model of Welfare: Do ‘Insertion Contracts’ Reduce Long-Term Dependence?
Luis Ayala and Magdalena Rodríguez
213/2005 The effect of geographic expansion on the productivity of Spanish savings banks Manuel Illueca, José M. Pastor and Emili Tortosa-Ausina
214/2005 Dynamic network interconnection under consumer switching costs Ángel Luis López Rodríguez
215/2005 La influencia del entorno socioeconómico en la realización de estudios universitarios: una aproxi- mación al caso español en la década de los noventa
Marta Rahona López
216/2005 The valuation of spanish ipos: efficiency analysis Susana Álvarez Otero
217/2005 On the generation of a regular multi-input multi-output technology using parametric output dis- tance functions
Sergio Perelman and Daniel Santin
218/2005 La gobernanza de los procesos parlamentarios: la organización industrial del congreso de los di- putados en España
Gonzalo Caballero Miguez
219/2005 Determinants of bank market structure: Efficiency and political economy variables Francisco González
220/2005 Agresividad de las órdenes introducidas en el mercado español: estrategias, determinantes y me- didas de performance
David Abad Díaz
221/2005 Tendencia post-anuncio de resultados contables: evidencia para el mercado español Carlos Forner Rodríguez, Joaquín Marhuenda Fructuoso y Sonia Sanabria García 222/2005 Human capital accumulation and geography: empirical evidence in the European Union
Jesús López-Rodríguez, J. Andrés Faíña y Jose Lopez Rodríguez
223/2005 Auditors' Forecasting in Going Concern Decisions: Framing, Confidence and Information Proc- essing
Waymond Rodgers and Andrés Guiral
224/2005 The effect of Structural Fund spending on the Galician region: an assessment of the 1994-1999 and 2000-2006 Galician CSFs
José Ramón Cancelo de la Torre, J. Andrés Faíña and Jesús López-Rodríguez
225/2005 The effects of ownership structure and board composition on the audit committee activity: Span- ish evidence
Carlos Fernández Méndez and Rubén Arrondo García
226/2005 Cross-country determinants of bank income smoothing by managing loan loss provisions Ana Rosa Fonseca and Francisco González
227/2005 Incumplimiento fiscal en el irpf (1993-2000): un análisis de sus factores determinantes Alejandro Estellér Moré
228/2005 Region versus Industry effects: volatility transmission Pilar Soriano Felipe and Francisco J. Climent Diranzo
229/2005 Concurrent Engineering: The Moderating Effect Of Uncertainty On New Product Development Success
Daniel Vázquez-Bustelo and Sandra Valle
230/2005 On zero lower bound traps: a framework for the analysis of monetary policy in the ‘age’ of cen- tral banks
Alfonso Palacio-Vera
231/2005 Reconciling Sustainability and Discounting in Cost Benefit Analysis: a methodological proposal M. Carmen Almansa Sáez and Javier Calatrava Requena
232/2005 Can The Excess Of Liquidity Affect The Effectiveness Of The European Monetary Policy?
Santiago Carbó Valverde and Rafael López del Paso
233/2005 Inheritance Taxes In The Eu Fiscal Systems: The Present Situation And Future Perspectives.
Miguel Angel Barberán Lahuerta
234/2006 Bank Ownership And Informativeness Of Earnings.
Víctor M. González
235/2006 Developing A Predictive Method: A Comparative Study Of The Partial Least Squares Vs Maxi- mum Likelihood Techniques.
Waymond Rodgers, Paul Pavlou and Andres Guiral.
236/2006 Using Compromise Programming for Macroeconomic Policy Making in a General Equilibrium Framework: Theory and Application to the Spanish Economy.
Francisco J. André, M. Alejandro Cardenete y Carlos Romero.
237/2006 Bank Market Power And Sme Financing Constraints.
Santiago Carbó-Valverde, Francisco Rodríguez-Fernández y Gregory F. Udell.
238/2006 Trade Effects Of Monetary Agreements: Evidence For Oecd Countries.
Salvador Gil-Pareja, Rafael Llorca-Vivero y José Antonio Martínez-Serrano.
239/2006 The Quality Of Institutions: A Genetic Programming Approach.
Marcos Álvarez-Díaz y Gonzalo Caballero Miguez.
240/2006 La interacción entre el éxito competitivo y las condiciones del mercado doméstico como deter- minantes de la decisión de exportación en las Pymes.
Francisco García Pérez.
241/2006 Una estimación de la depreciación del capital humano por sectores, por ocupación y en el tiempo.
Inés P. Murillo.
242/2006 Consumption And Leisure Externalities, Economic Growth And Equilibrium Efficiency.
Manuel A. Gómez.
243/2006 Measuring efficiency in education: an analysis of different approaches for incorporating non-discretionary inputs.
Jose Manuel Cordero-Ferrera, Francisco Pedraja-Chaparro y Javier Salinas-Jiménez
244/2006 Did The European Exchange-Rate Mechanism Contribute To The Integration Of Peripheral Countries?.
Salvador Gil-Pareja, Rafael Llorca-Vivero y José Antonio Martínez-Serrano 245/2006 Intergenerational Health Mobility: An Empirical Approach Based On The Echp.
Marta Pascual and David Cantarero
246/2006 Measurement and analysis of the Spanish Stock Exchange using the Lyapunov exponent with digital technology.
Salvador Rojí Ferrari and Ana Gonzalez Marcos
247/2006 Testing For Structural Breaks In Variance Withadditive Outliers And Measurement Errors.
Paulo M.M. Rodrigues and Antonio Rubia
248/2006 The Cost Of Market Power In Banking: Social Welfare Loss Vs. Cost Inefficiency.
Joaquín Maudos and Juan Fernández de Guevara
249/2006 Elasticidades de largo plazo de la demanda de vivienda: evidencia para España (1885-2000).
Desiderio Romero Jordán, José Félix Sanz Sanz y César Pérez López 250/2006 Regional Income Disparities in Europe: What role for location?.
Jesús López-Rodríguez and J. Andrés Faíña
251/2006 Funciones abreviadas de bienestar social: Una forma sencilla de simultanear la medición de la eficiencia y la equidad de las políticas de gasto público.
Nuria Badenes Plá y Daniel Santín González
252/2006 “The momentum effect in the Spanish stock market: Omitted risk factors or investor behaviour?”.
Luis Muga and Rafael Santamaría
253/2006 Dinámica de precios en el mercado español de gasolina: un equilibrio de colusión tácita.
Jordi Perdiguero García
254/2006 Desigualdad regional en España: renta permanente versus renta corriente.
José M.Pastor, Empar Pons y Lorenzo Serrano
255/2006 Environmental implications of organic food preferences: an application of the impure public goods model.
Ana Maria Aldanondo-Ochoa y Carmen Almansa-Sáez
256/2006 Family tax credits versus family allowances when labour supply matters: Evidence for Spain.
José Felix Sanz-Sanz, Desiderio Romero-Jordán y Santiago Álvarez-García
257/2006 La internacionalización de la empresa manufacturera española: efectos del capital humano genérico y específico.
José López Rodríguez
258/2006 Evaluación de las migraciones interregionales en España, 1996-2004.
María Martínez Torres
259/2006 Efficiency and market power in Spanish banking.
Rolf Färe, Shawna Grosskopf y Emili Tortosa-Ausina.
260/2006 Asimetrías en volatilidad, beta y contagios entre las empresas grandes y pequeñas cotizadas en la bolsa española.
Helena Chuliá y Hipòlit Torró.
261/2006 Birth Replacement Ratios: New Measures of Period Population Replacement.
José Antonio Ortega.
262/2006 Accidentes de tráfico, víctimas mortales y consumo de alcohol.
José Mª Arranz y Ana I. Gil.
263/2006 Análisis de la Presencia de la Mujer en los Consejos de Administración de las Mil Mayores Em- presas Españolas.
Ruth Mateos de Cabo, Lorenzo Escot Mangas y Ricardo Gimeno Nogués.
264/2006 Crisis y Reforma del Pacto de Estabilidad y Crecimiento. Las Limitaciones de la Política Econó- mica en Europa.
Ignacio Álvarez Peralta.
265/2006 Have Child Tax Allowances Affected Family Size? A Microdata Study For Spain (1996-2000).
Jaime Vallés-Giménez y Anabel Zárate-Marco.
266/2006 Health Human Capital And The Shift From Foraging To Farming.
Paolo Rungo.
267/2006 Financiación Autonómica y Política de la Competencia: El Mercado de Gasolina en Canarias.
Juan Luis Jiménez y Jordi Perdiguero.
268/2006 El cumplimiento del Protocolo de Kyoto para los hogares españoles: el papel de la imposición sobre la energía.
Desiderio Romero-Jordán y José Félix Sanz-Sanz.
269/2006 Banking competition, financial dependence and economic growth Joaquín Maudos y Juan Fernández de Guevara
270/2006 Efficiency, subsidies and environmental adaptation of animal farming under CAP Werner Kleinhanß, Carmen Murillo, Carlos San Juan y Stefan Sperlich
271/2006 Interest Groups, Incentives to Cooperation and Decision-Making Process in the European Union A. Garcia-Lorenzo y Jesús López-Rodríguez
272/2006 Riesgo asimétrico y estrategias de momentum en el mercado de valores español Luis Muga y Rafael Santamaría
273/2006 Valoración de capital-riesgo en proyectos de base tecnológica e innovadora a través de la teoría de opciones reales
Gracia Rubio Martín
274/2006 Capital stock and unemployment: searching for the missing link
Ana Rosa Martínez-Cañete, Elena Márquez de la Cruz, Alfonso Palacio-Vera and Inés Pérez- Soba Aguilar
275/2006 Study of the influence of the voters’ political culture on vote decision through the simulation of a political competition problem in Spain
Sagrario Lantarón, Isabel Lillo, Mª Dolores López and Javier Rodrigo 276/2006 Investment and growth in Europe during the Golden Age
Antonio Cubel and Mª Teresa Sanchis
277/2006 Efectos de vincular la pensión pública a la inversión en cantidad y calidad de hijos en un modelo de equilibrio general
Robert Meneu Gaya
278/2006 El consumo y la valoración de activos Elena Márquez y Belén Nieto
279/2006 Economic growth and currency crisis: A real exchange rate entropic approach David Matesanz Gómez y Guillermo J. Ortega
280/2006 Three measures of returns to education: An illustration for the case of Spain María Arrazola y José de Hevia
281/2006 Composition of Firms versus Composition of Jobs Antoni Cunyat
282/2006 La vocación internacional de un holding tranviario belga: la Compagnie Mutuelle de Tram- ways, 1895-1918
Alberte Martínez López
283/2006 Una visión panorámica de las entidades de crédito en España en la última década.
Constantino García Ramos
284/2006 Foreign Capital and Business Strategies: a comparative analysis of urban transport in Madrid and Barcelona, 1871-1925
Alberte Martínez López
285/2006 Los intereses belgas en la red ferroviaria catalana, 1890-1936 Alberte Martínez López
286/2006 The Governance of Quality: The Case of the Agrifood Brand Names Marta Fernández Barcala, Manuel González-Díaz y Emmanuel Raynaud
287/2006 Modelling the role of health status in the transition out of malthusian equilibrium Paolo Rungo, Luis Currais and Berta Rivera
288/2006 Industrial Effects of Climate Change Policies through the EU Emissions Trading Scheme Xavier Labandeira and Miguel Rodríguez
289/2006 Globalisation and the Composition of Government Spending: An analysis for OECD countries Norman Gemmell, Richard Kneller and Ismael Sanz
290/2006 La producción de energía eléctrica en España: Análisis económico de la actividad tras la liberali- zación del Sector Eléctrico
Fernando Hernández Martínez
291/2006 Further considerations on the link between adjustment costs and the productivity of R&D invest- ment: evidence for Spain
Desiderio Romero-Jordán, José Félix Sanz-Sanz and Inmaculada Álvarez-Ayuso 292/2006 Una teoría sobre la contribución de la función de compras al rendimiento empresarial
Javier González Benito
293/2006 Agility drivers, enablers and outcomes: empirical test of an integrated agile manufacturing model Daniel Vázquez-Bustelo, Lucía Avella and Esteban Fernández
294/2006 Testing the parametric vs the semiparametric generalized mixed effects models María José Lombardía and Stefan Sperlich
295/2006 Nonlinear dynamics in energy futures Mariano Matilla-García
296/2006 Estimating Spatial Models By Generalized Maximum Entropy Or How To Get Rid Of W Esteban Fernández Vázquez, Matías Mayor Fernández and Jorge Rodriguez-Valez 297/2006 Optimización fiscal en las transmisiones lucrativas: análisis metodológico
Félix Domínguez Barrero
298/2006 La situación actual de la banca online en España
Francisco José Climent Diranzo y Alexandre Momparler Pechuán
299/2006 Estrategia competitiva y rendimiento del negocio: el papel mediador de la estrategia y las capacidades productivas
Javier González Benito y Isabel Suárez González
300/2006 A Parametric Model to Estimate Risk in a Fixed Income Portfolio Pilar Abad and Sonia Benito
301/2007 Análisis Empírico de las Preferencias Sociales Respecto del Gasto en Obra Social de las Cajas de Ahorros
Alejandro Esteller-Moré, Jonathan Jorba Jiménez y Albert Solé-Ollé
302/2007 Assessing the enlargement and deepening of regional trading blocs: The European Union case Salvador Gil-Pareja, Rafael Llorca-Vivero y José Antonio Martínez-Serrano
303/2007 ¿Es la Franquicia un Medio de Financiación?: Evidencia para el Caso Español Vanesa Solís Rodríguez y Manuel González Díaz
304/2007 On the Finite-Sample Biases in Nonparametric Testing for Variance Constancy Paulo M.M. Rodrigues and Antonio Rubia
305/2007 Spain is Different: Relative Wages 1989-98 José Antonio Carrasco Gallego
306/2007 Poverty reduction and SAM multipliers: An evaluation of public policies in a regional framework Francisco Javier De Miguel-Vélez y Jesús Pérez-Mayo
307/2007 La Eficiencia en la Gestión del Riesgo de Crédito en las Cajas de Ahorro Marcelino Martínez Cabrera
308/2007 Optimal environmental policy in transport: unintended effects on consumers' generalized price M. Pilar Socorro and Ofelia Betancor
309/2007 Agricultural Productivity in the European Regions: Trends and Explanatory Factors Roberto Ezcurra, Belen Iráizoz, Pedro Pascual and Manuel Rapún
310/2007 Long-run Regional Population Divergence and Modern Economic Growth in Europe: a Case Study of Spain
María Isabel Ayuda, Fernando Collantes and Vicente Pinilla
311/2007 Financial Information effects on the measurement of Commercial Banks’ Efficiency Borja Amor, María T. Tascón and José L. Fanjul
312/2007 Neutralidad e incentivos de las inversiones financieras en el nuevo IRPF Félix Domínguez Barrero
313/2007 The Effects of Corporate Social Responsibility Perceptions on The Valuation of Common Stock Waymond Rodgers , Helen Choy and Andres Guiral-Contreras
314/2007 Country Creditor Rights, Information Sh