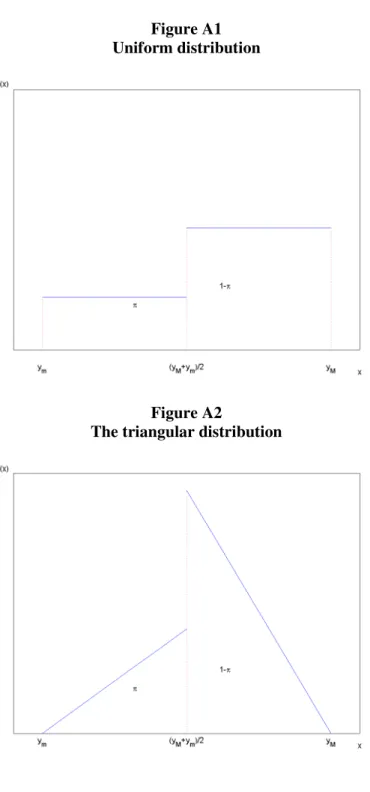
In the paper, we focus on the compensation rate, the ratio between the first pension and the last salary, as a synthetic indicator of pension assets. Point expectations for the replacement rate are also reported in the UK (Banks and Tanner, 2004) and in Italy (Bottazzi, Jappelli and Padula (2006). All employees (1,024 observations) are tentatively asked to report the minimum (ym) and maximum (yM) value of the compensation rate applicable to them.
Based on the range of the distribution and on the subjective probability elicited, we then calculate the respondent-specific mean, standard deviation and coefficient of variation. In Figure 1 we plot the cross-sectional distribution of the mean and coefficient of variation of the respondent-specific distributions. In this figure and in the rest of the paper we focus on the triangular distributions (results for the uniform are qualitatively similar).
The visual impression is that the average of the respondents' expectations about the replacement rate increase with age (upper left panel), while they are not strongly correlated with education (lower left panel). A positive relationship between age and replacement rate is consistent with the characteristics of the current pension system, which grants more generous pensions to workers approaching retirement. In columns 3 and 4, the dependent variable is the standard deviation of the respondent-specific subjective distribution of the replacement rate.
For robustness, columns 5 and 6 of Table 3 report regressions where the dependent variable is the coefficient of variation of the replacement rate distribution.
The demand for retirement saving
Descriptive analysis
The graph detects a negative relationship between pension funds and the replacement rate (upper left graph): people who expect a relatively low public pension (the median distribution of their replacement rate is 70 percent or less) show a greater propensity to invest in private pension funds (around 25 percent ). And among those who expect an 80% replacement rate or more, the share of pension funds is only 10%. The upper left panel shows that among those who believe that public pensions are relatively safe (coefficient of variation of 4 percent or less), participation in pension funds is much lower (15 percent) than among those who believe that the risk is higher ( participation 20 percent). for those with a coefficient of variation greater than 6 percent).
On the other hand, life insurance appears to be only weakly related to pension risk (top right chart).
Regression analysis
The estimates in column 1 indicate that the probability of a private pension fund is negatively related to age, is lower in the South and for investors with relatively high risk aversion, and increases with income and education (although the last two coefficients are not statistically different from zero). Although the expected replacement rate is not correlated with private pension fund ownership, the relationship with the standard deviation of the replacement ratio distribution has been positively and accurately estimated. The effect is also significant: an increase of two points in the standard deviation (equal to the average of the standard deviation of the subjective distributions) is accompanied by a five percentage point increase in private pension fund holdings.
In the other columns of table 4, we add dummies for the level of financial wealth, we also control for the mean and standard deviation of the subjective distribution of retirement age12 and for the index of financial literacy described in section 3. Although none of these additional variables is associated with the pension funds' ownership, the coefficient of the standard deviation of the compensation rate distribution is hardly affected in size and significance. Here we find that the self-employed are more likely to have life insurance and that the coefficient for our indicator of risk aversion is negative.
11 The dummy is based on the following question: “In managing your financial investment, do you believe you are a person interested in investments that offer the opportunity of: (1) high returns, with a high risk of loss of The capital; (2) good efficiency and reasonable safety; (3) moderate efficiency, but at the same time a good degree of safety; (4) a low return, without any risk of capital loss.” The risk averse dummy is defined as (3) or (4). 12People are asked to provide the minimum and maximum values of the expected retirement age, and the likelihood that it will exceed the middle of the range.
The demand for insurance
Conclusions
The results also suggest that pension risk is potentially a major determinant of demand for private pension funds, life insurance and health insurance. Douglas (1988), "Social Security Benefits: An Empirical Study of Expectations and Realizations", Issues in Contemporary Retirement, R.R Campbell and E. Bernheim, Douglas (1990), "The Timing of Retirement: a Comparison of Expectations and Realizations," in The Economics of Aging, David Wise ed.
Bottazzi, Renata, Tullio Jappelli and Mario Padula (2006), “Retirement Expectations, Pension Reforms and Their Impact on Private Wealth Accumulation,” Journal of Public Economics. Bottazzi, Renata, Tullio Jappelli and Mario Padula (2008), "Pension Reforms and the Allocation of Retirement Saving", forthcoming. Dominitz, Jeff, Charles Manski, and Jordan Heinz (2002), “Social Security Expectations and Retirement Savings Decisions,” NBER Working Paper no.
Feldstein, Martin and Anthony Pellechio (1979), "Social Security and Household Accumulation: New Microeconometric Evidence," Review of Economics and Statistics The Effect of Pension Wealth on Household Wealth: A Reappraisal of Theory and Evidence," Journal of Political Economy . Steinmeier (1989), "An Analysis of Pension Benefit Formulas, Pension Wealth, and Pension Incentives," Research in Labor Economics 10, 53-106. Hurd, Michael D., and Kathleen McGarry (1995), "Evaluating the Subjective Probabilities of Survival in the Health and Retirement Study,” Journal of Human Resources 30, 268–92.
Kimball, Miles (1992), "Precautionary Motives for Holding Assets," in John Eatwell, Murray Milgate and Peter Newman (Eds.) The New Palgrave Dictionary of Money and Finance. Lusardi, Annamaria, (1999), "Information, Expectations, and Saving for Retirement," in Behavioral Dimensions of Retirement Economics, Henry Aaron ed. Quantiles of the mean and coefficient of variation of the replacement rate distribution, by age and education.
Young Contributions (33% of gross wages for employees and 20% for self-employed) are capitalized based on 5-year moving average of GDP growth. Old, middle-aged and young refer respectively to workers with more than 18 years of contributions in 1995, less than 18 years of contributions in 1995, and who started working in 1995. The table gives the cross-sectional mean and median of the subjective mean, standard deviation and coefficient of variation of the replacement rate distribution.
Three stars indicate statistical significance at the 0.1% confidence level, two stars at the 1%, one star at the 5% level. Three stars indicate statistical significance at the 0.1% confidence level, two stars at the 1%, one star at the 5% level.
The wording of the questions
The subjective probability distribution of the replacement rate
A second possibility is to assume that the distribution is triangular over the same two intervals; if π=0.5 the distribution collapses again to a single triangular distribution over the interval [ym, yM]. The triangular distribution is a more plausible description of the probability distribution of the replacement rate, because outcomes further away from the center are given less weight.