The third chapter is a critical evaluation of the System of National Accounts, and especially of GDP. Chapter four asks the degree of freedom or coercion with which unpaid work is undertaken on an individual basis.
Work is not synonymous with employment
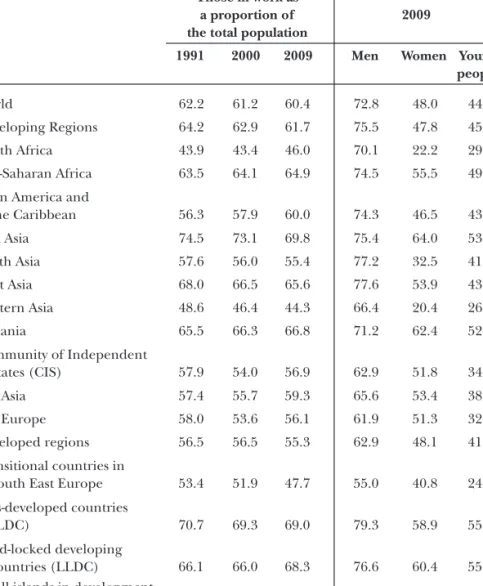
Distribution of work in the global economy
From 2000 to 2009, the global ratio decreased by 0.8, mainly due to changes in the age distribution of the population. The trend has been continuous, with the exception of the countries of the former Soviet Union where there was a rebound in self-employment in the years up to 2000.
Ideology and Statistics: the contribution
The heterogeneous geographical distribution of workof work
A disadvantage is that since the data comes from different sources, it is not possible to cross-check the data on the time paid workers spent on unpaid work and vice versa. This second job increases the total annual figure for time spent in paid work each year by 0.33%.
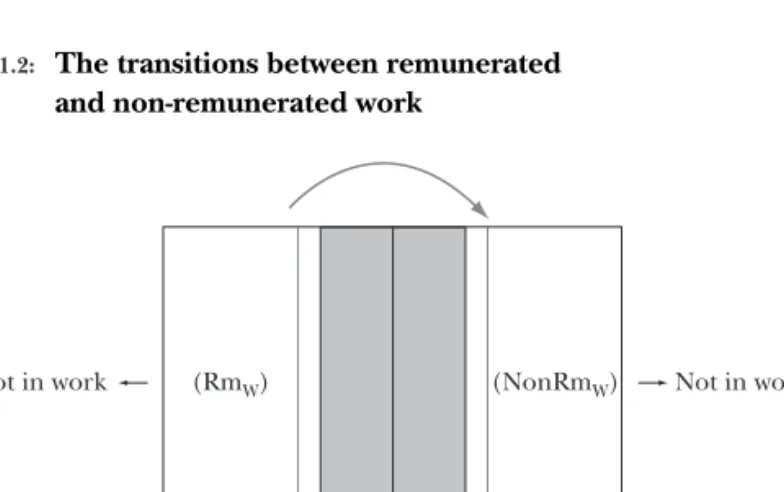
Non-remunerated work
- The legal treatment of non-remunerated work
- Non-remunerated work in households
- Volunteer work
- Forced work
Care is part of the content of the social contract that binds all social groups: men and women. Unpaid domestic work is the work done in the household for oneself or for other members of the household.
The transitions between remunerated and non-remunerated workand non-remunerated work
- The longitudinal and transversal perspective
- Leaving employment and being inactive
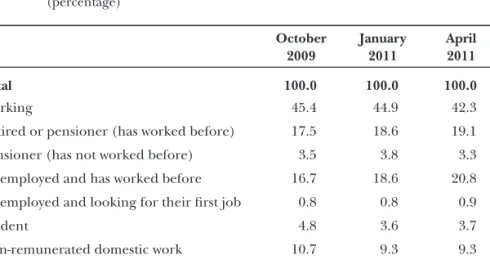
- The good employment pyramid, 2009-2011
The time they spend on unpaid work is higher than that of any other group, despite the fact that this group includes a very high proportion of older people. 13% of permanently disabled people mention household tasks as a secondary cause of not working.
Invisible work, unmeasured and concealed
- The growth of casual labour in the world
- Some national estimates of the NOE
18 The participating countries were: Members of the EU-15 (Austria, Belgium, Spain, Finland, Germany, Ireland, Italy, the Netherlands, Sweden and the United Kingdom); 3.c Countries that have measured work in the informal sector, usually using the labor input method.

The quality of work: a comparison between remunerated and non-remunerated workremunerated and non-remunerated work
One of the conditions that differentiates paid work outside the household from non-paid work performed in the household is the degree of specialization and the possibility of dividing and delegating tasks to other workers. There is no equivalent of this in the non-remunerated work in households, although there are indirect forms of compensation (the contribution to the family economy), of cooperation in the induced promotion of other members of the household, improvement of social standing. , perfecting qualifications, and increased power in inter-family relationships. But unpaid work in the household does not have a personal career horizon independent of the family situation, and this makes it profoundly different from work in other occupations, if only at the level of expectations.
However, continuity in the degree of commitment to unpaid work does not guarantee the continuity of the financial partnership with the remaining family members. The biggest difference between the length of working hours of paid work and unpaid work arises in the case of holidays and public holidays. Regardless of whether the working day is full-time or part-time, the concept of working day takes on a different meaning when it refers to paid work or unpaid work.
A “decent job” for all?
These conditions are optimal models that the ILO is trying to bring to reality, while recognizing that the goal is difficult, especially in the large part of informal sectors in developing economies. In highly unequal conditions of productivity (technology and capital) they accuse the developed countries of having forced them to lower social regulations in order to maintain the international competitiveness of their products. In 2009, the number of unemployed people in the world reached 212 million people, thirty-four million more than in 2007 (ILO 2009a), which reduces the possibility that the campaign launched a decade ago by the International Labor Organization Or. - the organization to achieve "decent work for all" will achieve its goals.
Furthermore, and this is the most innovative aspect of the program and is what directly links it to the following pages, those who work in the community and those who work in their homes. Even in developed economies, working hours spent in such an idyllic setting as this are a minority and only a few workers and only at certain moments of their working lives manage to enjoy them. Working conditions in any specific workplace are interdependent on what happens in other places: factory, office, place, all depend on their mutual relations, but also on what happens at home and in public authorities.
The unions and the representation of the workers of the future
- New workers with multiple obligations
- Foreseeable changes in the agenda of union organisations organisations
The main representative organizations of wage workers are the trade unions, and their contribution to the improvement of working conditions has been decisive during the 19th and 20th centuries. 28 The General Secretary of the International Trade Union Confederation (ITUC) publicly stated the need for women to take up work with the resulting organizational changes (Ryder 2010). Awareness campaigns are needed to convince workers of the benefits of joining or organizing.
Demand leadership can lead to people other than those experiencing the need. The commitment of trade unions to protect the working conditions of employees does not always contribute to the creation of jobs for those who do not have them. Unions will have to adapt to the fact of the progressive increase in the percentage of the population that cannot take care of itself, but needs help from others to survive.
Two thousand million workshops producing services round the clock at the margin of
When used to refer to human activity, the term unproductive never has positive connotations and in the most neutral sense only means that it does not produce money or that it belongs to a world that is not related to profit and gain; but in most cases, when an activity is described as unproductive, it means not only that it does not generate money, but rather costs. To some extent, if something is unproductive, it is suspected to be parasitic, as a cunning and opportunistic consumer of resources. It is for this reason that placing the concept of production at the head of this chapter and linking it to the home means that a clear position has been adopted.
There are something like seven thousand million people in the world today, grouped into two thousand million homes. In the developed regions, the number of households is growing proportionately larger than the population, and the number of dwellings is growing more than the number of households. In the context of increasing prosperity, the household is losing importance as a cost-reducing mechanism in the production of common services.
The family structure of households
- New types of household
- The network of users of non-remunerated work
- The tax delimitation of the family
In the Scandinavian countries, single-person houses make up almost half of the total number of houses. In Spain, due to the improvement in social and economic conditions, rotating house sharing is disappearing. People who share a dwelling form the immediate network of users of the same spatial resource.
In Spain, houses with a limited number of nuclear families predominate, and among the elderly the unit size is even smaller. In Spain, the sense of obligation to care for relatives is intense, but only with regard to the immediate family circle. Women may push the boundaries of the immediate family beyond the boundaries set by men.

Non-remunerated workplaces
- Accommodation and dwellings
In the home's role as a permanent center for the production of goods and services, the distribution of information plays a leading role. The accommodation focuses on government requirements for public communication (postal services, inspections), private business requirements (advertising, verification of services, home deliveries, maintenance) and family and friendship network requirements. , which mainly falls on the people who. It also shows the loss of developed countries' demographic weight in the world population as a whole.
In contrast to the household, the residence is "the household's normal residence, the one where they normally spend the night"; but this idea is not without difficulties. Since the year 2008, for the first time in human history, more than half of the world's population has lived in urban areas (PRB 2010a). General characteristics of the household (deed type, district, occupancy of one or more households, usable area, location of the household in the building, number of inhabitants, number of bedrooms). c) Facilities (kitchen, running water, hot water, sanitary type, bathroom, toilet, heat, energy used for heating, electricity, gas).

MAP 2.1: Map of housing in the world
- Overcrowded households and empty dwellings
- The means of gaining access to housing
- Who cares about GDP?
- The hype 37 of GDP and the mirage of growth
- Development and structure of GDP
- The Stiglitz-Sen-Fitoussi Report
- An illustration: non-remunerated work and households in the Spanish National Accounts in the Spanish National Accounts
- The barriers between households and the market
- The source of household income
- Protection of the family against poverty
- Non-monetary resources
- Households at risk of poverty in Spain
- The paradox of the services market: those who most need them cannot afford them
- The limits of the market on absorbing remunerated workremunerated work
- The age and health limits of potential workers
- The market as a reducer of employment and the analogy of the androidand the analogy of the android
- The role of the State as intermediary
The differences due to socio-economic position are clearly visible in the availability of the second home. However, this does not equal the power of the users of the classifications already established for the market economy. In other words, a third of households' monetary resources are returned to the government for redistribution.
Household final consumption expenditures represented 73.5% of the total final consumption expenditures of the entire economy. Inequalities between households parallel the inequalities that occur at the individual level. 20.8% of the population was below the relative poverty threshold, compared to 19.5% the year before.
Family size is not in itself an indicator of poverty or wealth. At the ends, the maximum level (for the minimum) and the minimum level (for the maximum) are taken with reference to the regular monthly net income of the family.
Non-remunerated work and families in the economic crisis in Spain, 2007-2011in the economic crisis in Spain, 2007-2011
- Other families, other crises
- Material wealth and household debt
- Household savings and their contribution to capital formation formation
The main and most serious consequence of the economic crisis in Spain has been the increase in unemployment. This is short for unemployed jobseekers and they make up the largest category of unemployed. In 2009, it was found that the effect of the crisis was still invisible in the indicator of average compensation per employee, which increased by 3.9% compared to the previous year.
The ratio of household debt at the end of 2008 was equivalent to 125% of GDI. Despite the heavy financial burden, gross savings reached 2% of GDI that year (Banco de España, 2009a, 71). One of the social groups most affected by the fall in the value of assets consists of people of a fairly advanced age who are the owners of equity pension funds.