Combined anaerobic-aerobic and UV/H2O2 processes increased the biodegradability of TOC, TN and CBOD5 present in SSWW. S1 concentration of substrate in compartment 1 of ABR (mg/L) Sf concentration of substrate in effluent (mg/L).
INTRODUCTION
Nevertheless, anaerobic treatment methods suffer from process instabilities, including a low settling rate and the need for post-treatment of the harmful anaerobic effluent, which usually contains ammonium ions (NH4+) and hydrogen sulfide (HS-) (Heijnen et al., 1991; Cao and Mehrvar, 2011). Use a cost-effectiveness analysis (CEA) to determine the best alternative, by evaluating the total electricity costs, the effects of the HRT, the costs of H2O2 consumption and the percentage of TOC removal.
LITERATURE REVIEW
Introduction
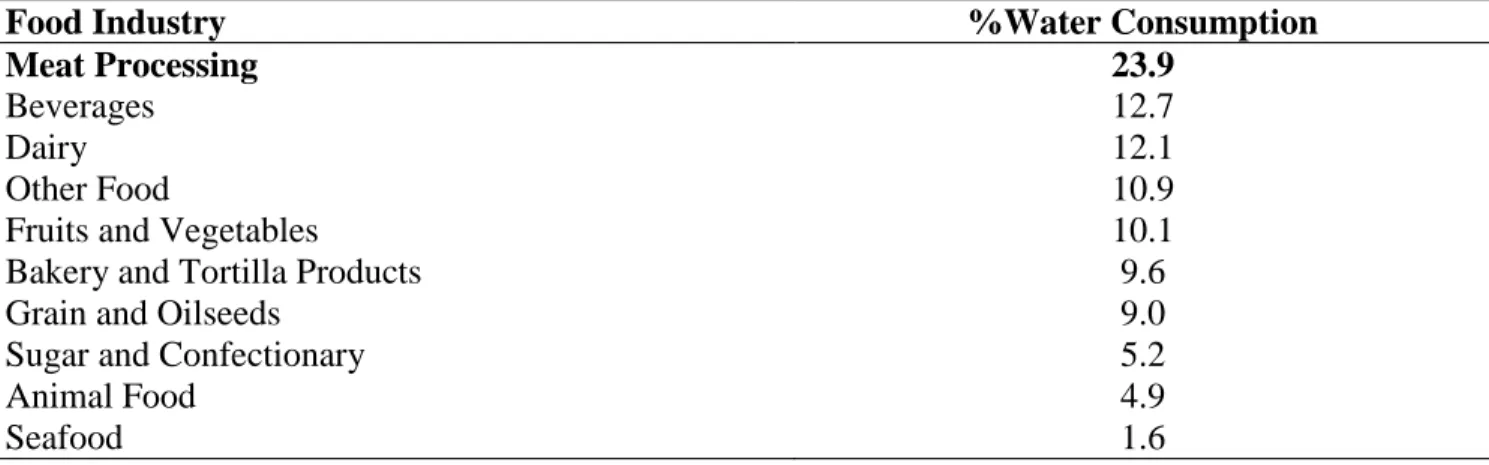
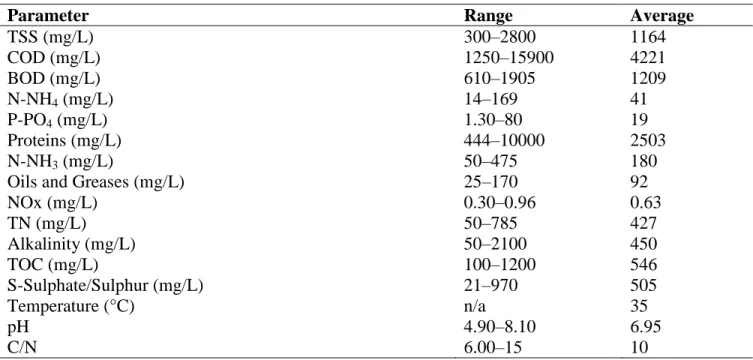
Slaughterhouse wastewater characteristics
- Slaughterhouse wastewater occurrence
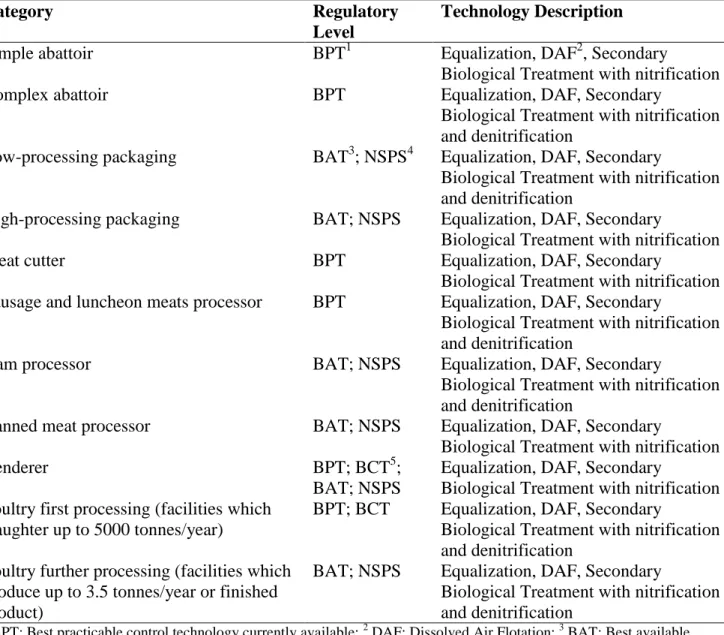
- Slaughterhouse wastewater guidelines and regulations
- Environmental impacts
- Health effects
9% of the slaughterhouses were directly connected to the STP and 6% of them used a trucker to transport the sewage to the STP. The strength and composition of pollutants in the wastewater obviously depends on the nature of the processes involved (Verheijen et al., 1996).
Slaughterhouse wastewater treatment technologies
- Anaerobic biological treatment
- Aerobic biological treatment
- Combined anaerobic-aerobic biological treatment
- Biological modeling
- Nitrification and denitrification
- Advanced oxidation processes (AOPs)
- UV/H 2 O 2 process
Equation (2.4) can also be used based on the use of the biodegradable TOC fraction (Mohajerani et al., 2009). Kinetic modeling of the degradation process is the key point in the effective design of photoreactors.
Need for combined biological treatment and advanced oxidation processes
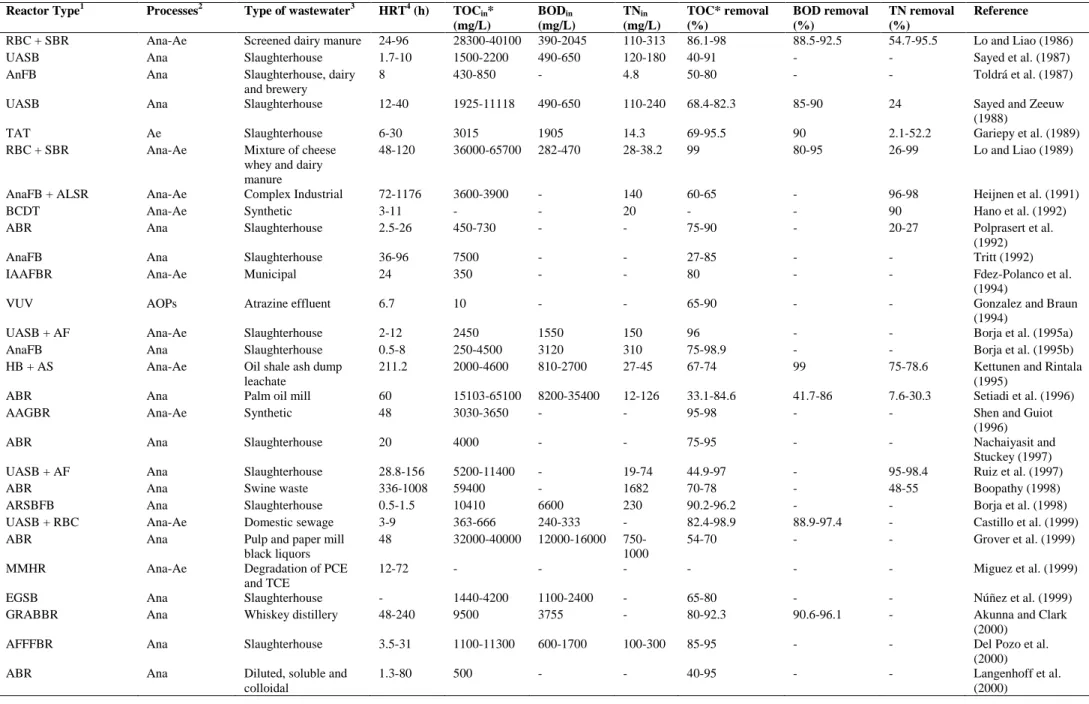
A steady-state analysis of this general mechanism yields the following overall rate kinetics for the UV/H2O2 process as shown in equation (2.51). Of course, if the original wastewater contains significant amounts of biodegradable compounds, the preoxidation step will not lead to a significant improvement in biodegradability; rather, it will only cause unnecessary consumption of chemicals (Oller et al., 2011). 1 Reactor type: AAGBR, anaerobic-aerobic granular biofilm reactor; AAIBR, anaerobic-aerobic integrative baffled reactor; AASBR, anaerobic-anoxic sequencing batch reactor; ABFR, aerobic biofilm reactor;.
ABR, anaerobic baffled reactor; ACOT, aerobic contact oxidation tank; AdNR, anaerobic denitrifying reactor; ARSBFB, anaerobic reactor with sludge blanket and filter bed; AS, activated sludge; AF, anaerobic filter; AFBR, anaerobic fluid bed reactor; AFFFBR, fixed bed anaerobic fixed film reactor; ALSR, air lift suspension reactor; AnF, anaerobic filter; AnFB, anaerobic fluid bed; ARB, biological reactor for old waste; ASCS, aerobic fixed contact system; BABS, batch aerobic biological system; BAC, biologically activated charcoal; BASR, biofilm airlift suspension reactor; BCDT, draw tube bubble column; CDI, capacitive deionization; CSTR, continuous stirred tank reactor; DAF, dissolved air flotation; EGSB, expanded granular sludge bed; EO, electrochemical oxidation; FBNR, fixed bed nitrification reactor; FBR, fixed bed biological reactor; FFB, fixed film bioreactor; GRABBR, granule-bed anaerobic bed reactor; HAD, heterotrophic-autotrophic denitrification; HB, hybrid bioreactor; IAAFBR, integrated anaerobic-aerobic fluid bed reactor; IAAFFR, integrated anaerobic-aerobic fixed film reactor; IBR, immobilized biomass reactor; MBR, membrane bioreactor; MMHR, methanogenic-methanotrophic hybrid reactor; PCR, packed column reactor; PChR, photochemical reactor; RAAIBB, radial anaerobic/aerobic immobilized biomass bioreactor; RBC, rotary biological contactors; SAAB, simultaneous aerobic and anaerobic bioreactor; SAAMB, staged anaerobic-aerobic membrane bioreactor; SBR, sequencing batch reactor; SBBR, sequencing biofilm batch reactor; SFABR, split fed anaerobic blinded reactor; TAT, thermophilic aerobic treatment; UAAFBIR, upflow anaerobic/aerobic fixed bed integrated reactor; UASB, upstream anaerobic sludge bed; UBF, upstream bed filter; WL, wetland; BCR, bubble column reactor; IBR, immobilized biomass reactor; FBP, fluidized biofilm process; CC/EO, chemical coagulation/electrochemical oxidation; EO, electrochemical oxidation.
Concluding remarks
MATERIALS AND METHODS
Introduction
Materials
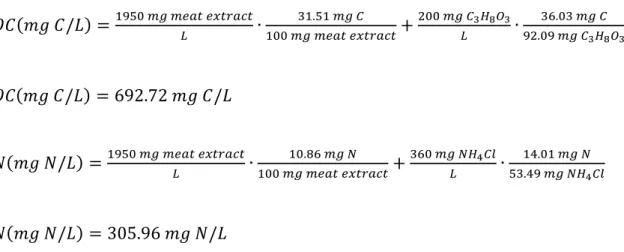
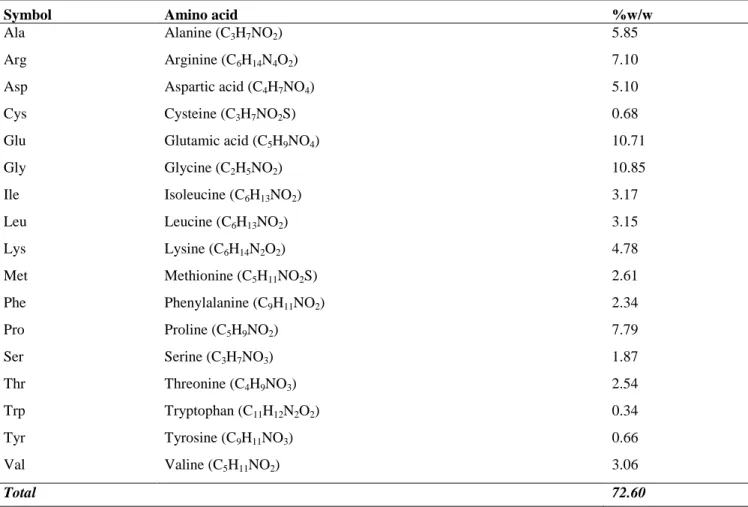
- Synthetic slaughterhouse wastewater (SSWW)
- Anaerobic and aerobic inoculum
The anaerobic and aerobic sludge seed (37,500 mgSS/L) was obtained from the Ashbridges Bay Wastewater Treatment Plant, a municipal wastewater treatment plant in Toronto, Ontario. A total of 10 L of the anaerobic sludge seed was loaded into the ABR (approximately 2 L in each compartment), while 5 L of the aerobic sludge seed was loaded into the aerobic AS reactor. The inoculum (2.5 gVSS/L) in the compartments was acclimatized at the SSWW by continuously introducing the wastewater into the reactors.
Excess sludge feed was stored in a sealed container and fed from the SSWW periodically at room temperature for future use.

Experimental setup
To optimize the combined ABR and UV/H2O2 process for wastewater treatment in previous studies (Cao, 2009; Cao and Mehrvar, 2011), it was proposed that an aerobic stage be placed after the anaerobic process and before the UV/H2O2 post-treatment. H2O2 as shown in Figures 3.3 and 3.4. For easy accumulation of nitrifying bacteria in the bioreactor, no sludge should be discharged and a DO concentration should be maintained above 2.0 mg/L. 300% of the stream flow rate for denitrification of oxidized nitrogen as suggested by Ahn et al.
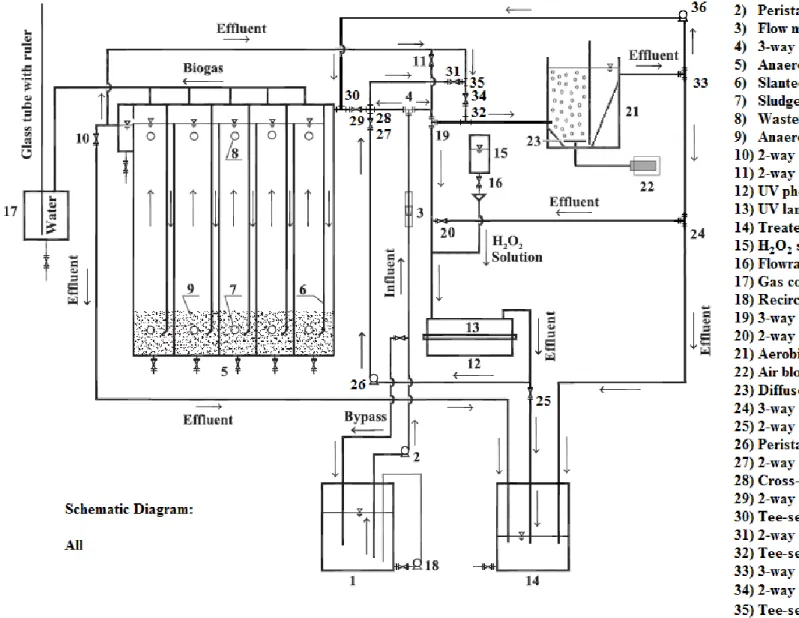
Various configurations have also been designed to observe the performance of the system by varying the number of stages and their sequence, thus determining the most effective alternative for the treatment of slaughterhouse wastewater through a cost-effective method, as shown in figures 3.5. to 3.10; where the blue color indicates the flow direction of the wastewater, the red color indicates the anaerobic process, the green color indicates the aerobic process and the purple color indicates the photochemical process.
Experimental procedure
- Acclimatization of the inoculum
- ABR process
- Aerobic AS process
- UV/H 2 O 2 process
- Combined anaerobic-aerobic processes
- Combined aerobic-anaerobic processes
- Combined anaerobic-aerobic and UV/H 2 O 2 processes
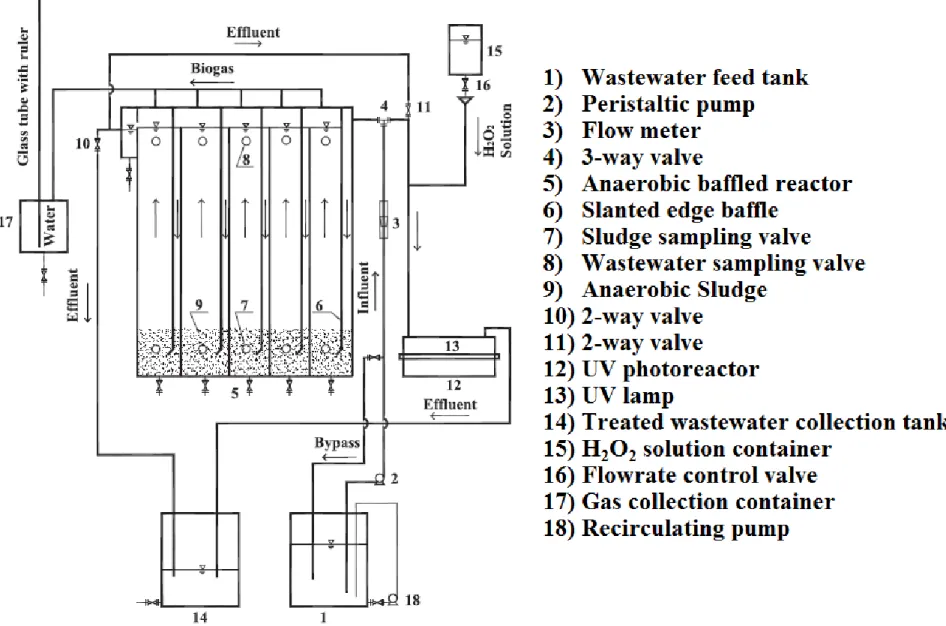
Schematic diagram of the experimental setup for the treatment of synthetic slaughterhouse wastewater by UV/H2O2. The flow was then directed to the ABR using the 3-way valve (4) and flowed downwards and upwards within the 5 compartments of the ABR. The flow was then directed to the ABR using the 3-way valve (4) and flowed downwards and upwards within the compartments of the ABR.
HRTAS = hydraulic residence time of the aerobic AS process (h); and HRTUV = hydraulic retention time of the UV/H2O2 process (h).
Analytical techniques
- Dissolved oxygen (DO)
- Temperature and pH
- Total suspended solids (TSS), volatile suspended solids (VSS), mixed liquor suspended
- Total organic carbon (TOC) and total nitrogen (TN)
Each of the filter papers was then transferred to a weighed aluminum container and dried. W1 = sum of weights of dried filter paper, container and sample solids (mg); Analysis of CBOD5 was performed according to Section 5210B of Standard Methods (APHA, 1998).
Two blank samples were prepared by filling with carbonated dilution water to proximate the quality of the seedless dilution water and the purity of the BOD bottles.
RESULTS AND DISCUSSION
Introduction
Common characteristics of the synthetic slaughterhouse wastewater (SSWW)
- Reynolds number
- Dissolved oxygen (DO)
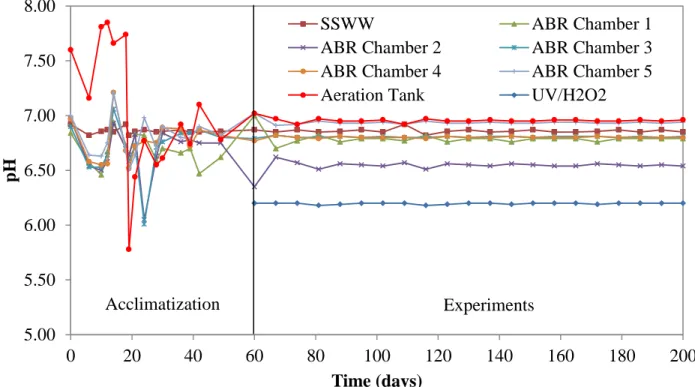
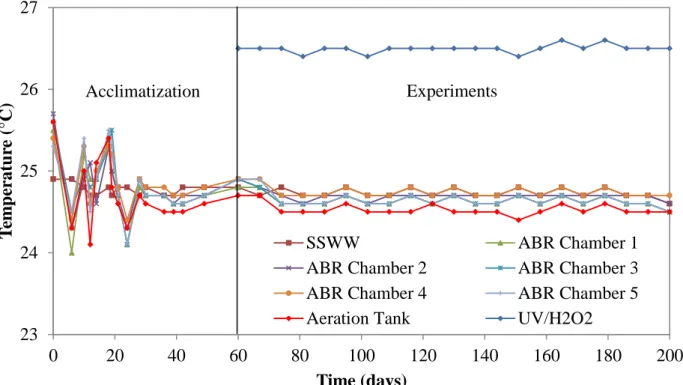
- Temperature and pH
- TSS and VSS concentrations of the anaerobic sludge and MLSS and MLVSS
- TSS and VSS concentrations of the SSWW
This can be attributed to the growth and metabolism of the microorganisms, where the temperature values in the ABR chambers (1 to 5) were in the range of. Furthermore, the temperature values from the effluent of the UV/H2O2 process were in the range of 26.40 to 26.6°C. MLSS profile and temporal evolution of the anaerobic sludge within the aerobic AS process.
MLVSS profile and evolution with time of anaerobic sludge within the aerobic AS process.

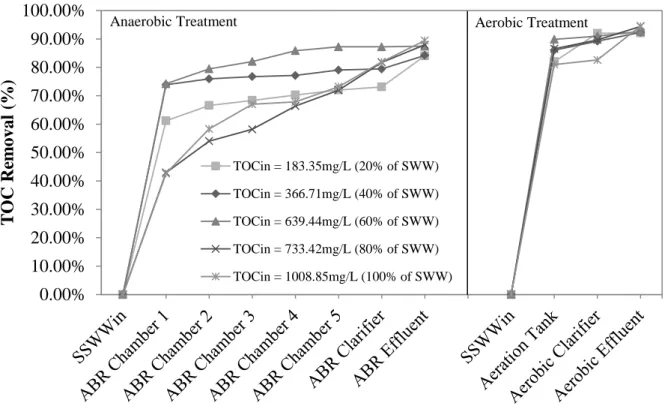
TOC and TN removal in SSWW using individual anaerobic and aerobic processes
Regardless of the results from previous studies (Cao, 2009; Cao and Mehrvar, 2011), a good TN removal, ranging from 31.32 to 73.46%, was achieved by changing the flow rate and influent concentration of SSWW; this could be attributed to the conditions maintained in the systems, where DO concentrations were in the range of 0.2–1.2 mg/L and 0.4–3.2 mg/L for aerobic ABR and AS, respectively. Therefore, DO concentrations above 1.0 mg/L allowed nitrification, while DO concentrations below 0.5 mg/L allowed denitrification.
TOC and TN removal in SSWW using combined anaerobic-aerobic systems
- TOC and TN removal in SSWW using combined anaerobic-aerobic processes
- TOC and TN removal in SSWW using combined aerobic-anaerobic processes
- TOC and TN removal in SSWW using combined anaerobic-aerobic processes with
Effects of HRT on TOC removal by combined anaerobic-aerobic processes with influent TOC concentration of 1,008.85 mg/L (100% of SWW) in continuous mode without recycle. Effects of HRT on TN removal by combined anaerobic-aerobic processes with influent TN concentration of 419.77 mg/L (100% of SWW) in continuous mode without recycle. Effects of HRT on TOC removal by combined aerobic-anaerobic processes with influent TOC concentration of 1,008.85 mg/L (100% of SWW) in continuous mode without recycle.
Effects of HRT on TN removal by combined aerobic-anaerobic processes with influent TN concentration of 425.54 mg/L (100% of SWW) in continuous mode without recycle.
TOC and TN removal in SSWW using UV/H 2 O 2 process alone
- Dark experiments
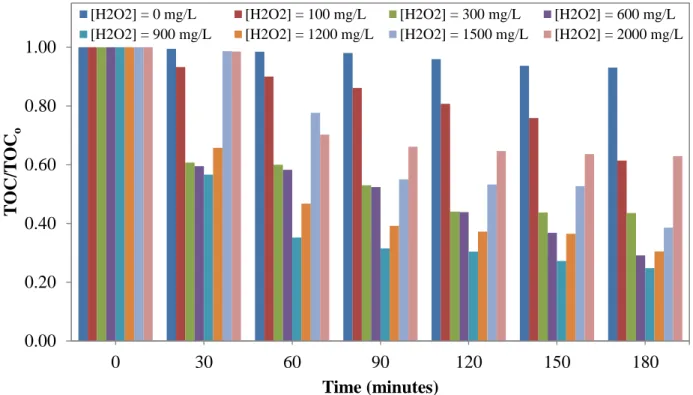
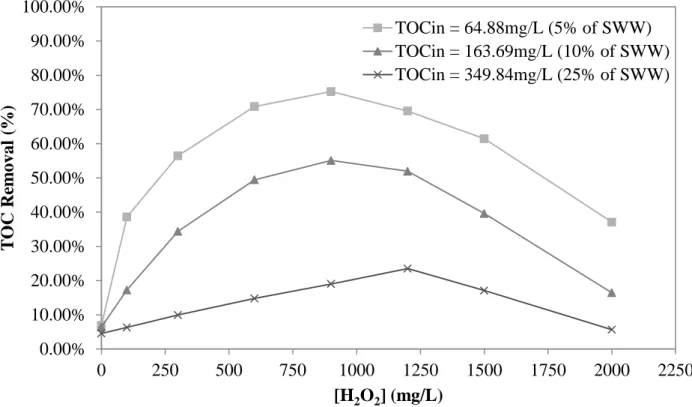
- Optimal H 2 O 2 dosage and molar ratio of [H 2 O 2 ]/[TOC] for the UV/H 2 O 2 process
TOC removal in untreated SSWW using different concentrations of H2O2 with an inlet TOC concentration of 64.88 mg/L (5% SSWW) in the UV/H2O2 process only. TOC removal in untreated SSWW using different concentrations of H2O2 with an inlet TOC concentration of 163.69 mg/L (10% SSWW) in the UV/H2O2 process only. TOC removal in raw SSWW using different concentrations of H2O2 with an inlet TOC concentration of 348.84 mg/L (25% SSWW) only in a UV/H2O2 process in continuous mode without recycle.
TN removal for different concentrations of untreated SSWW by UV/H2O2 only process in continuous mode without recycle.
TOC and TN removal in SSWW using combined anaerobic-aerobic and UV/H 2 O 2 processes
TOC removal in SSWW using combined anaerobic-aerobic-UV/H2O2 processes at different HRTs in continuous mode without recycle. TN removal in SSWW using combined anaerobic-aerobic-UV/H2O2 processes at different HRTs in continuous mode without recycle. Maximum values for TOC removal in SSWW using combined anaerobic-aerobic-UV/H2O2 processes in continuous mode without recycle.
Maximum values for TN removal in SSWW using combined anaerobic-aerobic-UV/H2O2 processes in continuous mode without recycle.
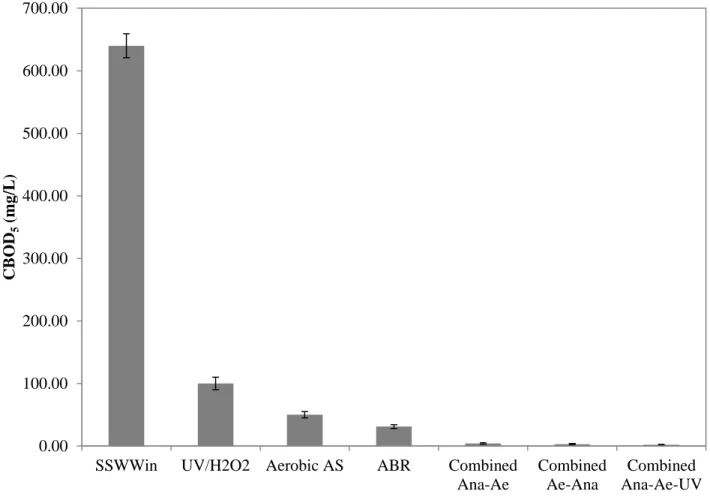
CBOD 5 removal in SSWW using ABR alone, aerobic AS alone, UV/H 2 O 2 alone, and
CBOD5 removal in SSWW using ABR alone, aerobic AS alone, UV/H2O2 alone and combined processes. CBOD5 concentration profile of various SSWW effluents from various processes in continuous mode without recycle, including UV/H2O2 process alone, ABR process alone, aerobic AS process alone, combined anaerobic-aerobic processes, combined aerobic-anaerobic processes and combined anaerobic -aerobic and combined anaerobic-aerobic processes. UV/H2O2. CBOD5 removal in SSWW using various alternatives in continuous mode without recycle, including UV/H2O2 process alone, ABR process alone, aerobic AS process alone, combined anaerobic-aerobic processes, combined aerobic-anaerobic processes, and combined anaerobic- aerobic and UV/H2O2 .
Correlation between CBOD5 and TOC in SSWW using different alternatives in continuous mode without recycle, including UV/H2O2 process alone, ABR process alone, aerobic AS process alone, combined anaerobic-aerobic processes, combined aerobic-anaerobic processes, and combined anaerobic-aerobic processes and UV/H2O2.
Cost-effectiveness analysis (CEA) to determine the best alternative on SSWW treatment by
- Kinetic modeling for the ABR alone
- Kinetic modeling for the aerobic AS alone
- Kinetic modeling for the combined anaerobic-aerobic processes
- Kinetic modeling for the UV/H 2 O 2 process alone
- Kinetic modeling for the combined anaerobic-aerobic and UV/H 2 O 2 processes
- Optimization of the total electricity cost and HRT to determine the best alternative on
Calculated values of the electricity cost per mass of TOC removed for the ABR process alone. Calculated values of the electricity cost per mass of TOC removed for the aerobic AS process alone. Calculated values of the electricity cost per mass of TOC removed for the combined anaerobic-aerobic processes.
Calculated values of the electricity price per mass removed TOC for the combined anaerobic-aerobic and UV/H2O2 processes.

CONCLUSIONS AND RECOMMENDATIONS
Conclusions
Therefore, an adequate combination of anaerobic and aerobic processes is essential for successful nutrient removal from SSWW. Combined anaerobic-aerobic and UV/H2O2 processes were found to be able to increase the treatment capacity of TOC, TN and CBOD5 obtained from other systems. The combined anaerobic-aerobic and UV/H2O2 processes were technically more efficient than the other processes, removing 15% more TOC during the same operating time.
Finally, it was determined that the optimal system was the combined anaerobic-aerobic and UV/H2O2 processes, with an optimal TOC removal of 92.46% at a HRT of 41 hours, at a cost of $1.25/kg TOC removed and $11.60/m3. of treated SSWW.
Recommendations
An example of Reynolds number calculation is described as follows; the rest of the calculations are shown in Table B.1. W4 = sum of the weights of the solids of the sample and the dish after combustion (mg); and V = volume of the sample (L). Calculation of the concentration of TSS and VSS of sludge in compartment 4 of the ABR process.
Relative error was used to express an accuracy of an acceptable value of the quantity being measured.