EVALUATION OF DISCOVERY TARIFFS FOR RENEWABLE ENERGY POLICY IN ONTARIO: THE CASE OF SOLAR PV TECHNOLOGY. The promotion of renewable energy sources is linked to climate change mitigation and energy security issues.
Background
In addition, the FIT mechanism was chosen for its potential to promote the growth of the renewable energy industry and to create conditions that reduce (but not eliminate) risk and improve investment security (Mabee et al. 2011; Stokes 2013). Solar energy is one of the most suitable RETs that is technically feasible to support a sustainable renewable energy industry in Ontario.
Purpose
Solar PV economics
- Solar PV technology
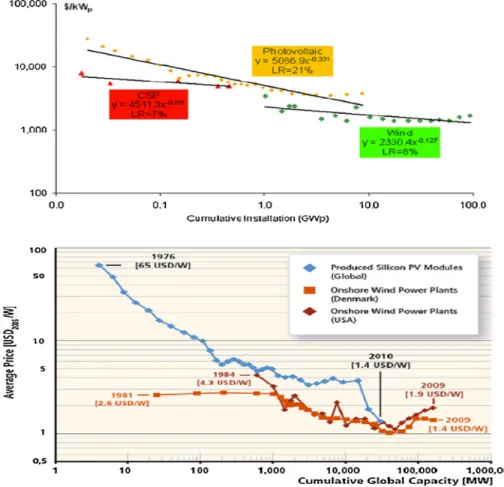
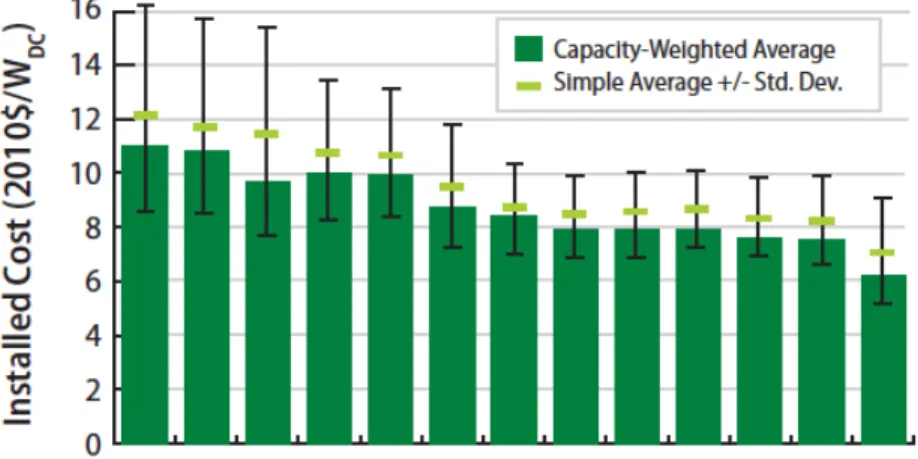
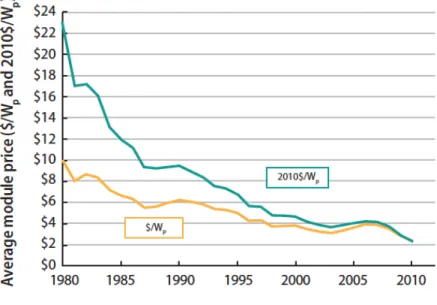
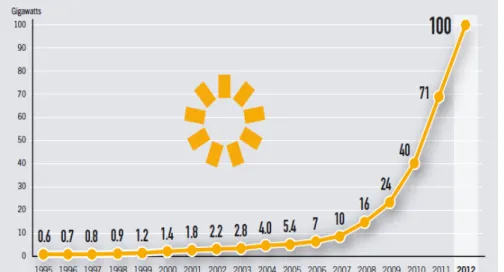
- Solar PV modules prices
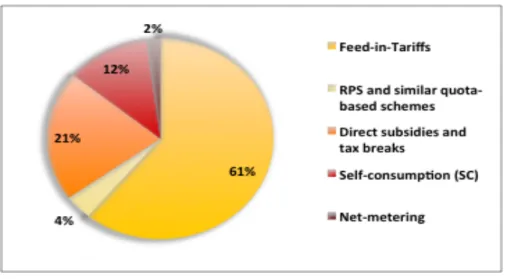
- Solar PV policies
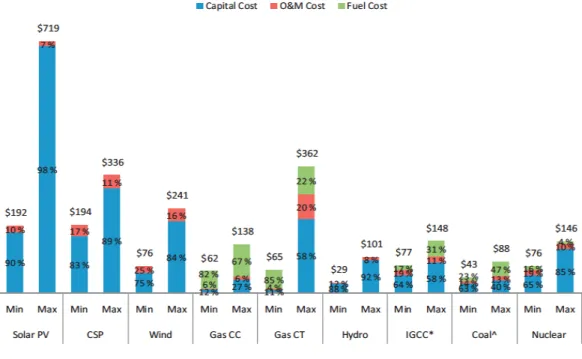
The basic design element of a PV solar system is the nominal power capacity of the PV module. Comparing the LCOEs of solar PV technology with the conventional and renewable electricity generation technologies (in Figure 5), solar PV system costs remain higher and more economically unattractive (in a range of US$192-719/MWh) in comparison with other technologies.
Solar PV benefits
Assuming current global trends in solar deployment continue, the demand for skilled human resources is expected to continue to grow.
Current status of the Ontario’s solar PV technology
Ontario's solar PV incentives have positively impacted the Canadian PV market with incremental installation growth of 25% per year between 1994 and 2008. Solar PV module costs currently account for approximately one-third of the total installed price, or turnkey, average cost canadian photo solar projects.

Ontario’s Renewable Energy Policy Overview
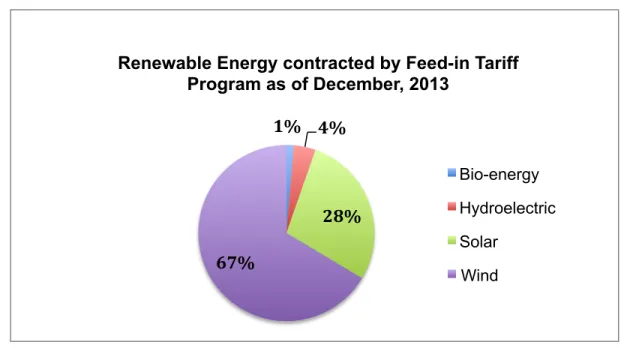
- Ontario’s FIT program
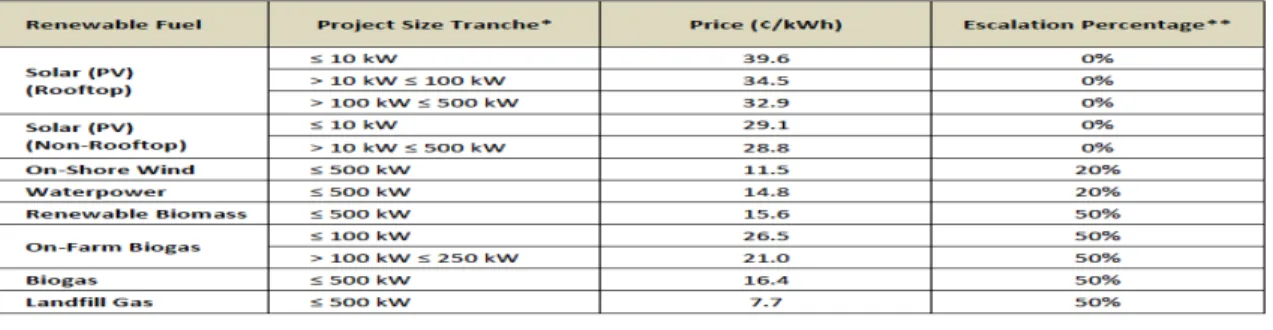
- Ontario’s FIT solar PV program
- Ontario’s FIT challenges
As previously mentioned, solar PV projects under Ontario's FIT program are offered 20-year contracts. Solar PV FIT rates for rooftop and ground PV installations have decreased by nearly 50% and 35% respectively during the period 2009-2014.
Comparative policy analysis and lesson drawing
- International feed-‐in tariff experiences
- German FIT a ‘made in Germany’ case
- Spain
- Denmark
In the case of solar PV FIT tariffs, these tariffs started at a comparatively high value. Spain has been one of the most successful countries in the public promotion of electricity from renewable energy sources (RES), especially wind electricity.
Assessment of effectiveness and sustainability for solar PV projects
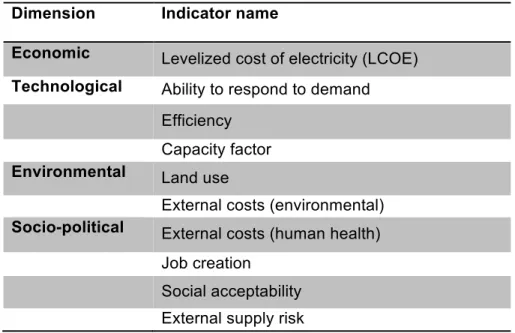
An important success factor in the development of wind energy was also the centers of research and development activities. Social acceptability External supply risk. 2009) developed an assessment of technologies for the production of electricity from renewable sources based on the classification of a series of sustainability indicators, such as the price of electricity produced, greenhouse gas emissions generated during the entire life cycle of an electricity production unit, the availability of renewable sources, the efficiency of energy diversions, land requirements, water use and social impacts. As a result of the assessment, wind energy is the most sustainable, followed by hydropower, photovoltaics and geothermal energy.
In addition, Fthenakis' research (2009) was oriented towards evaluating the sustainability of solar cells and the case of thin film cells. The study investigated the potential of thin films in a prospective life cycle analysis, focusing on its affordability by reducing direct costs, resource availability and environmental impacts.
Life Cycle Sustainability Assessment (LCSA)
- Life Cycle Assessment (LCA)
- Life Cycle Cost (LCC) and the Levelized Cost of Electricity (LCOE)
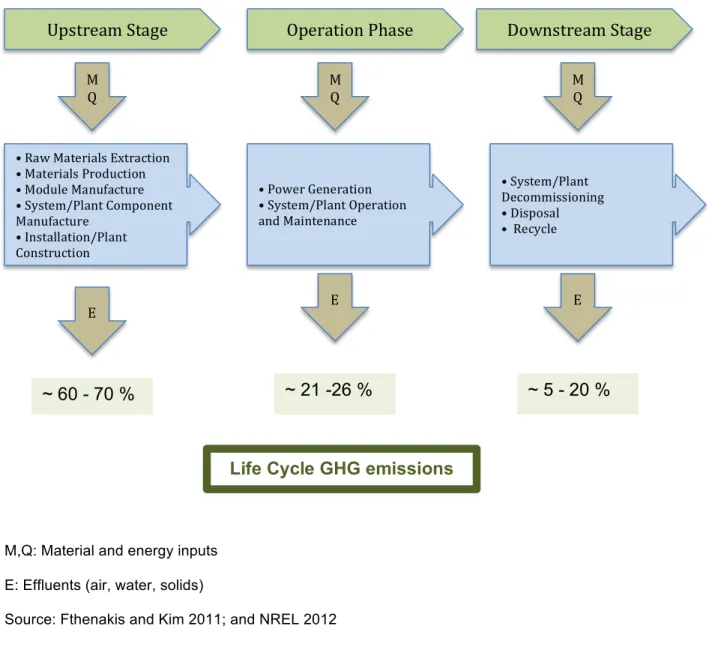
The Life Cycle Assessment (LCA) is an internationally standardized and more suitable tool for evaluating the potential environmental impacts of products or technology from cradle to grave (Fthenakis and Kim 2011; and Zamagni 2012). A conceptual description of the life cycle of PV systems starts from the upstream stage to the downstream stage in Figure 14. Before operation, most GHGs are emitted in the life cycle of solar PVs.
Once the solar PV system is installed, the life cycle phase involves minimal operation and maintenance activities, such as washing modules and replacing inverters. After the PV system reaches the end of its life, the further life cycle phase includes the dismantling of the system, where parts are removed or recycled (Fthenakis and Kim 2011; Hsu et al. 2012).
However, it is important to know the specific, ideal sustainability indicators for evaluating solar in Ontario. Many studies evaluate the costs of solar PV installations, and other studies identify emissions and energy payback of solar cells using life cycle assessment (Evans et al. 2009). However, there are no studies that perform an integrated evaluation of the value chain of the solar PV technology in Ontario using a set of sustainability indicators under the perspective of a life cycle assessment with emphasis on social, economic and environmental impacts and an economic evaluation of the Ontario solar PV supply chain under a cost/ benefit approach.
Comparative policy analysis
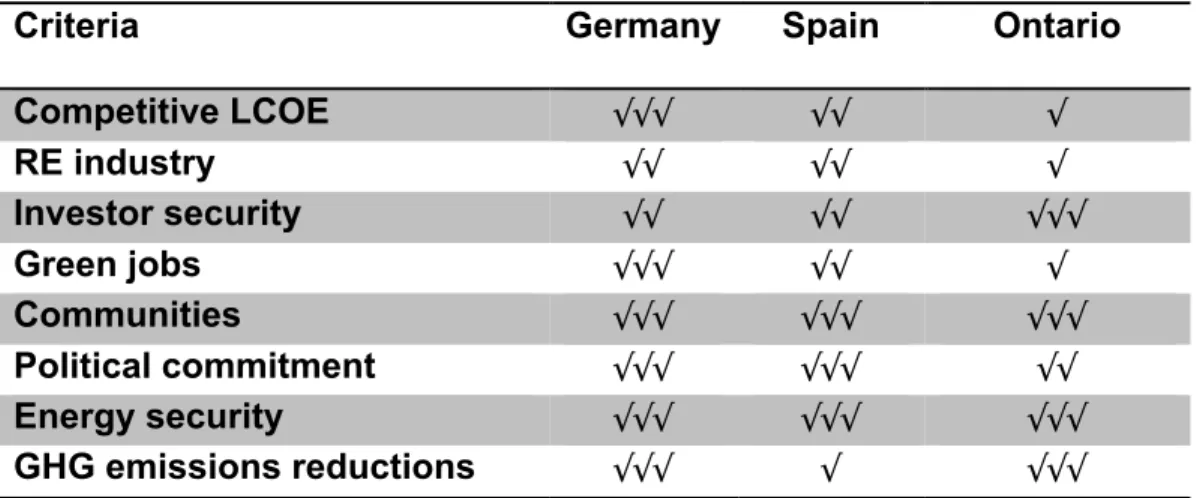
A literature review was conducted to identify successful practices of feed-in tariff pioneers and successful regions/countries/jurisdictions regarding the design and implementation of feed-in tariff programs taking into account institutional and socio-economic similarities such as Germany and Spain. The rationale for comparing FIT programs from Ontario, Germany, and Spain is that these jurisdictions have similar interests in economic growth and job creation (del Rio Gonzalez 2008; Mabee et al. 2011). Germany and Spain have become world leaders in solar installations because they were supported.
This research study compared the FIT program in Ontario with the FIT mechanisms in Germany and Spain, because the German experience is expected to provide important insights in economic and technical aspects, and the Spanish FIT program is valuable in social and political terms. Subsequently, this research study conducted a comparative policy analysis using a set of sustainability criteria to assess and analyze the effectiveness and sustainability of solar PV FIT policy frameworks in selected jurisdictions.
Sustainability criteria
In addition, most of the renewable energy policies are compared through an economic and technical perspective; however, it is necessary to also evaluate renewable energy policies under political considerations (Stokes 2013). As a result of the comparative policy analysis, lessons and policy implications for Ontario are derived. First, the selection of the most relevant sustainability indicators related to the performance of the solar cell technology, e.g. the ability to respond to demand and external fuel supply risk, not relevant to solar technology.
Secondly, any chosen sustainability indicator should provide a life cycle assessment approach as it is considered the most comprehensive assessment approach to provide insight into the impacts that an energy generation technology may have throughout its life and to assess its compatibility with the sustainability development of the measure the world. industry (Evans et al. 2009; Maxim, 2014). The economic dimension is represented by the levelized cost of electricity (LCOE), the average cost of generating electricity over the entire life of the energy unit.

Case study: Analysis of the value chain of Ontario’s FIT solar PV system
- Solar PV supply chain in Ontario
- Case study assumptions
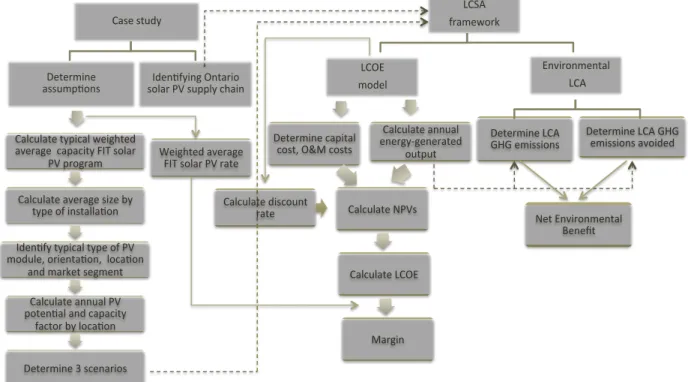
- LCSA framework
- Levelized Cost of Electricity (LCOE)
- Cost/Benefit Analysis
- Margin
- Net Environmental Benefit
For this reason, this case study assumed that a typical FIT solar PV system is a ground-mounted PV installation. Therefore, each case study scenario of the FIT solar PV system in Ontario assumed a fixed southerly orientation at the tilt latitude. For each case study scenario of the FIT solar PV system in Ontario, a guaranteed period of 20 years (the FIT contract period with OPA) is assumed as the life of the project instead of the average life of the PV system (OPA 2010b).
The system boundaries used for the scope of the (environmental) LCA and the LCC include the upstream phase, which includes raw material procurement and processing (multi-crystalline Si feedstock), manufacturing (cubes/wafers, cells, modules and BOS) and the operating phase of the solar PV system life cycle. The annual cost assumed as a percentage of the total capital cost of each Ontario FIT solar PV system case study scenario is broken down in Table 16. The Ontario FIT solar PV system case study assumed a constant power degradation rate per year of 0.5%.
Then, the margin or economic value of Ontario's FIT PV value chain is calculated using Equation 15.
Comparative policy analysis
- Comparison with Germany FIT program
- Comparison with Spain FIT program
- Lessons for Ontario
LCOE calculations for each Ontario solar FIT case study scenario are shown in Tables 25 to 27 and Appendices 3 to 5. Margin (economic value) and net environmental benefit of the Ontario solar PV FIT system value chain for each scenario case studies are reported in Table 29. It facilitates a better understanding of how Ontario's FIT program has promoted solar PV technology in the province.
This study provided insight into the level of success of Ontario's FIT in promoting solar PV technology. In terms of market behavior, Ontario's ground-mounted solar PV projects (925 MWAc) have the largest market share with 71% of total FIT projects under contract and have received more benefits per electricity generated than rooftop projects (6 CADc/kWhAC).
Case study: Analysis of the FIT solar PV value chain in Ontario
Significance of findings
Although there are several studies that provide a qualitative evaluation of the effectiveness and sustainability performance of the FIT policy through an international comparative policy analysis, this study has proposed a set of sustainability criteria to provide insight into the degree of success of Ontario's FIT in promotion of solar cell technology. In addition, this study has provided an integrated assessment using both the qualitative and the quantitative assessment of the efficiency and sustainability of Ontario's FIT solar PV program. Ontario's FIT solar PV program has been effective and has contributed to a sustainability performance with strengths and weaknesses in the design and implementation of the program compared to FIT's world leaders.
Provides policy makers with more information on the quantitative analysis of FIT solar PV in Ontario using an economic analysis of the solar PV value chain with insights into market behavior. These additional and constant profits have been paid to the holders of a solar PV contract during the twenty years of the contract with OPA.
Conclusions
However, Ontario has yet to develop a strong solar industry, which is directly reflected in the creation of green jobs, as Germany did. Also, Ontario's FIT solar PV program must achieve a competitive LCOE to reach grid parity. The economic analysis of the Ontario FIT solar PV value chain in this case study presented three different levels of profit by project size, installation type, market segment and location.
The level of average compensation offered by OPA was too generous, especially with regard to ground-mounted solar PV projects. Consequently, these high solar PV rates have meant an increase in electricity prices for Ontario electricity consumers.
Implications
- Policy implications
- Social implications
- Broader implications
Several components and products of Ontario's solar PV supply chain are not produced in Ontario, basically due to the dramatic increase in competitively priced PV Asian manufacturing. The Ontario FIT solar PV policy is still a drive-the-market policy, given that the LCOE of solar PV technology has not yet reached grid parity. Overall, the social implications of the FIT solar PV program in Ontario should be directed at two main goals: green job creation and community participation, both of which have not been successfully achieved.
An important lesson from Ontario's FIT solar PV policy implementation that other jurisdictions/regions/countries with solar PV energy potential may need to know relates to policy design and periodic review. The large solar PV projects with a capacity of more than 500 kW had to participate in a bid procurement process.
Future Research
Transmission Availability Map
Solar PV Potential and Insolation
LCOE Calculation (Scenario 1)
LCOE Calculation (Scenario 2)
LCOE Calculation (Scenario 3)
Hent fra http://www.bp.com/en/global/corporate/about-bp/energy-economs/statistical-review-of-world-energy-2013.html. Hent fra http://www.globalbioenergy.org/uploads/media/0605_Renewable_energy_source s_in_figures_-_national_and_international_development__Germany_intl_.pdf. Hent fra http://www.ise.fraunhofer.de/en/publications/veroeffentlichungen-pdf-dateien- en/studien-und-konzeptpapiere/recent-facts-about-photovoltaics-in-germany.pdf.
Retrieve from http://www.iea-pvps.org/index.php?id=93&no_cache=1&tx_damfrontend_pi1%5BshowUid%5D=. Kry from http://www.energy.gov.on.ca/en/fit-and-microfit-program/2-year-fit-review/executive-summary/.