TítuloAlmirall S A and Subsidiaries (Almirall group) Economic Financial Analysis
59
0
0
Texto completo
(2) Almirall S.A and Subsidiaries (Almirall groups) economic-financial analysis. Karina Quinteiro Vázquez. 2.
(3) Almirall S.A and Subsidiaries (Almirall groups) economic-financial analysis. Abstract In this research, an economic-financial analysis of Almirall (a pharmaceutical company) is developed, this analysis will be compared with the results obtained for Faes Farma, another pharmaceutical company with the one Almirall compete. The mentioned financial analysis is mounted in four parts. The first one is going to consist in the analysis of the vertical and horizontal percentages of the Balance Sheet and Income Statement of Almirall and Faes Farma, in order to comment which accounts, in this type of firms, have more relevance and see particularities of the industry in terms of weight of the accounts. The second part of the Almirall analysis will be study its financial situation by its liquidity (using the current ratio, acid test and two turnovers) solvency (using debt ratios and the cash flow evolution) and performance (return on assets and return on equity) during the years 2007-2015, then those results are compared with the ones obtained for Faes Farma. After analysing Almirall financially, its position in the pharmaceutical industry will be obtained using the firm size, the return on assets and return on equity in the years 19992015. The last part of the research consists in find the Almirall weaknesses and strengths in order to obtain a more accurate analysis of the firm, for this part the tools used are: the Porter Five Forces and the SWOT analysis.. Key words: Financial analysis; Almirall; Pharmaceutical industry; Faes Farma; Number of words: 9644. Karina Quinteiro Vázquez. 3.
(4) Almirall S.A and Subsidiaries (Almirall groups) economic-financial analysis. Resumen. En este trabajo el análisis económico financiero de Almirall (una empresa farmacéutica) será realizado, este análisis se comparará con los resultados obtenidos para Faes Farma, otra empresa farmacéutica con la que Almirall compite. El mencionado análisis financiero es realizado en cuatro partes. La primera consistirá en el análisis de los porcentajes verticales y horizontales del Balance y de la cuenta de Pérdidas y Ganancias de Almirall y Faes Farma, para comentar que cuentas, en este tipo de empresa, tiene más relevancia y ver las particularidades de la industria en términos del peso de las cuentas. La segunda parte del análisis de Almirall será estudiar su situación financiera a través de su liquidez (usando el índice de solvencia, el acid test y dos rotaciones), solvencia (usando las ratios de endeudamiento y la evolución de los flujos de caja) y rendimiento (rentabilidad de explotación y rentabilidad de los capitales propios) durante los años 2007-2015, después estos resultados se comparan con los obtenidos para Faes Farma. Después de analizar financieramente Almirall, su posición en la industria se obtendrá usando el tamaño de la empresa, la rentabilidad de explotación y la rentabilidad de los capitales propios en los años 1999-2015. La última parte del trabajo consiste en encontrar las debilidades y fortalezas de Almirall para obtener un análisis más preciso de la empresa, para esta parte se usa: las Cinco Fuerzas de Porter y el análisis DAFO.. Palabras clave: Analisis Financero; Almirall; Industria Farmaceutica; Faaes Farma; Número de palabras: 9644. Karina Quinteiro Vázquez. 4.
(5) Almirall S.A and Subsidiaries (Almirall groups) economic-financial analysis. Index Introduction………………………….………………………………………………………9 1. Industry overview………………………………………………………………………10 1.1.. Almirall introduction…………………………………………………….............14. 2. Data and methodology …………….…………………………………………………15 2.1.. Data………………………………………………………………………………15. 2.2.. Methodology…………………………………………………………………….15. 3. Overview of the information provided in the financial statements…………...17 3.1.. The Balance Sheet……………………………………………………………..17. 3.2.. The Income Statement…………………………………………………………19. 4. Almirall Financial situation…………………………………………………………..24 4.1.. Liquidity………………………………………………………………………….24. 4.2.. Solvency…………………………………………………………………………28. 4.3.. Performance………………………………………………………………….....31. 5. Almirall position in the pharmaceutical industry………………………………..34 5.1.. Almirall firm size …………………………………………………………...…..34. 5.2.. Industry return on assets……………………………………………………....36. 5.3.. Industry return on equity…………………………………………………….....38. 6. Almirall weaknesses and strengths………………………………………………..39 6.1.. Porter Five Forces……………………………………………………………...39. 6.1.1. Threats of new entrants…………………………………………………...40 6.1.2. Degree of rivalry……………………………………………………….......41 6.1.3. Bargaining power of buyers………………………………………………41 6.1.4. Bargaining power of suppliers……………………………………………41 6.1.5. Substitute products………………………………………………………..42 6.1.6. Porter Five Forces conclusion…………………………………………...43 6.2.. SWOT analysis…………………………………………………………………43. 7. Industry alternatives………………………………………………………………….45 Conclusion……………………………………………………………………….....................46 Reference list…………………………………………………………………………………...47. Karina Quinteiro Vázquez. 5.
(6) Almirall S.A and Subsidiaries (Almirall groups) economic-financial analysis. Figures Index Figure 1. R&D personnel recruitment…………………………………………….…………..11 Figure 2. People with chronic diseases…………………………………………..……….....12 Figure 3. Revenue………………………………………………………………….…………..19 Figure 4. Last year’s Almirall stock market (IBEX 35) evolution…………………………..20 Figure 5. Personnel expenses vertical percentage………………………………………...20 Figure 6. Almirall return on research capital ratio………………………………..………....22 Figure 7. Almirall net income………………………………………………………………….23 Figure 8. Current ratio………………………………………………………………………….25 Figure 9. Acid test………………………………………………………………………………26 Figure 10. Accounts receivable turnover……………………………………………………..27 Figure 11. Days sales uncollected…………………………………………………………....27 Figure 12. Days payable outstanding………………………………………………………...28 Figure 13. Almirall debt ratios…………………………………………………………………29 Figure 14. Faes Farma debt ratios……………………………………………………………29 Figure 15. Almirall cash flow evolution…………………………………………………….....29 Figure 16. Faes Farma cash flow evolution………………………………………………….30 Figure 17. Return on assets……………………………………………………………..........31 Figure 18. Return on equity……………………………………………………………………32 Figure 19. Adjusted return on assets…………………………………………………………33 Figure 20. Adjusted return on equity………………………………………………………….33 Figure 21. Total assets comparison…………………………………………………………..35 Figure 22. Revenue comparison………………………………………………………………35 Figure 23. Industry return on assets…………………………………………………………..36 Figure 24. Industry profit margin……………………………………………………………….37 Figure 25. Industry assets turnover…………………………………………………………...37 Figure 26. Industry return on equity…………………………………………………………...38 Figure 27. Porter Five Forces………………………………………………………………….40 Figure 28. Industry days payables outstanding………………………………………………42 Figure 29. SWOT analysis………………………………………………………………………43. Karina Quinteiro Vázquez. 6.
(7) Almirall S.A and Subsidiaries (Almirall groups) economic-financial analysis. Tables Index Table 1. Other receivables horizontal percentage ……………………………………….....19 Table 2. Relevant expenses from the vertical percentage perspective…………………...21 Table 3. Other operating income vertical percentage……………………………………….21 Table 4. Faes Farma net income………………………………………………………………23 Table 5. Almirall return on assets components………………………………………………32. Karina Quinteiro Vázquez. 7.
(8) Almirall S.A and Subsidiaries (Almirall groups) economic-financial analysis. Abbreviations CNMV: Comisión Nacional del Mercado de Valores E.U.: European Union INE: Instituto Nacional de Estadística R&D: Research & Development SABI: Sistema De Análisis De Balances Ibéricos U.K: United Kingdom U.S.A: United States of America. Karina Quinteiro Vázquez. 8.
(9) Almirall S.A and Subsidiaries (Almirall groups) economic-financial analysis. Introduction. The objective of the present research is to examine the financial evolution of a pharmaceutical company, in this case, Almirall, during the period 2007-2015. After presenting the Almirall financial research, an industry overview is done to know how was Almirall allocated in the pharmaceutical sector. In the Almirall financial analysis I will study the company liquidity, solvency and performance. I also study the mentioned elements for Faes Farma, an Almirall close competitor, to see the main differences between them. In order to do a deeper Almirall analysis, its position in the pharmaceutical industry will be exposed. That is going to be done comparing some important elements such as: the total assets, the return on assets or the return on equity. The previous mentioned analysis is done for the period 1999-2015. To finish the research, the Porter Five Forces and SWOT analysis, based on the information obtained from the previous analysis, will be presented, to reach a better conclusion of the Almirall financial situation.. Karina Quinteiro Vázquez. 9.
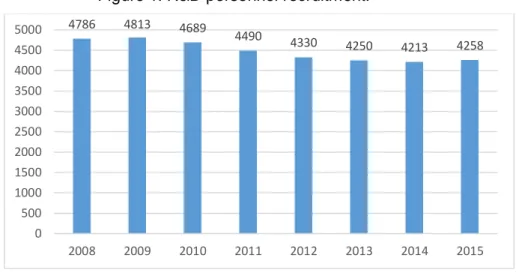
(10) Almirall S.A and Subsidiaries (Almirall groups) economic-financial analysis. 1.. Industry overview.. In the last sixty-five years, life expectancy at a global level, grew up from 46,5 years in 1950 (Luengo, 2012) to 71,4 years in 2015 (WHO, 2016). This was, in great part due to advances in nutrition, health services and education (Luengo, 2012). However, like Luengo (2012) points out, 40% of the life expectancy increase had been for the introduction of new drugs. In this last point, the pharmaceutical industry had been the main responsible. The life expectancy grew due to the medicine advance was very important for a lot of generations and worldwide. This is in part for the fact that the drugs help us to stay healthier. For the previous explanation, the financial analysis of this research will be carried out on Almirall. It is a pharmaceutical company for the one more information is provided in the next point. The pharmaceutical industry performs a complex activity, which can be divided into three tasks: R&D, production and distribution of their products (González and Gascón, 2004). A brief explanation of these three tasks is presented in the next paragraphs. The R&D “refers to the investigative activities a business conducts to improve existing products and procedures or to lead to the development of new products and procedures” (Investopedia, 2017). In the pharmaceutical industry, the country which has the firms that invest more in R&D is U.S.A (FarmaIndustria, 2017). However, in Spain the R&D investment in the industry is very important, as it helped considerably in the Spain economic recovery over the last years (FarmaIndustria, 2014) and it is the industry that leads the investment in R&D in Spain (Luego, 2012). At this point, it is interesting to examine the evolution of the R&D personnel recruitment in the pharmaceutical industry. Figure 1 depicts this evolution over the period 2008 to 2015.. Karina Quinteiro Vázquez. 10.
(11) Almirall S.A and Subsidiaries (Almirall groups) economic-financial analysis. Figure 1. R&D personnel recruitment. 5000. 4786. 4813. 4689. 4500. 4490. 4330. 4250. 4213. 4258. 2011. 2012. 2013. 2014. 2015. 4000 3500 3000 2500 2000 1500 1000 500. 0 2008. 2009. 2010. The most remarkable fact from the previous graphic (Figure 1) is that the pharmaceutical companies R&D personnel recruitment followed a decreasing trend over the last years (2008-2015) (FarmaIndustria, 2015). This is contrary to the information given in previous paragraphs about the R&D importance in the industry, and to the fact exposed by Mercado (2011), that says the big firms in the pharmaceutical industry will stop to invest in marketing and start to lay out in small organizations to focus on investigation. Turning up to the second task of the pharmaceutical industry, the production, it could be said, that the industry helps the Spanish economic recovery with its high productivity, exports and generation of employment too. As, the process of creating a new drug is lengthy and requires thousands of investigators in different areas (Luengo, 2012), the pharmaceutical companies had to hire people to develop the new drug. The globalisation plays an important role in the type of drug that the industry is developing. According to KPMG (2011) the pharmaceutical companies are currently more focused on developing drugs that prevent/cure diseases at a global level, for example the development of drugs for oncological diseases. The previously mentioned fact is also influenced by the elevated cost to achieve the medicines, according to FarmaIndustria (2017) it had been multiplied by 6 since 1976, when it cost on average 199 millions of €, meanwhile in 2012, the average cost of developing a drug was 1.506 millions of €. Technology is also important in the production of drugs. As pointed out by Brenan and La Marr (2009), the pharmaceutical industry had used millions in new technologies to develop new medicines. Apart from the money needed, it takes 12 or 13 years to have a new drug or vaccine available in the market. Most of this time (6-7 years) the product is in the clinical trial phase. In places where the regulation is stricter, only 3 of each 10 drugs in. Karina Quinteiro Vázquez. 11.
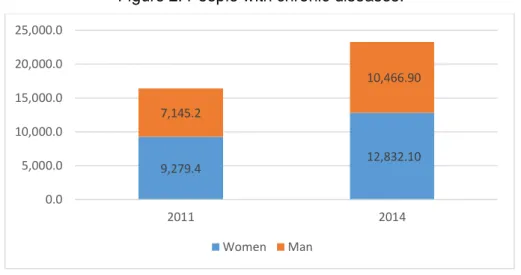
(12) Almirall S.A and Subsidiaries (Almirall groups) economic-financial analysis. the market obtain benefits, amortizing the cost of developing the product (FarmaIndustria, 2017). Due to the elevated cost of developing a new drug, Tecé (2016) in an interview to Elena Villanueva talking about the pharmaceutical industry. Elena, in the mentioned interview, explains that nowadays the industry is trying to obtain benefits selling chronic diseases drugs, because, as Figure 2 shows, the chronic illnesses had increased in an elevated way from 2011 to 2014 (source: INE (2011) and INE (2014)).. Figure 2. People with chronic diseases. 25,000.0 20,000.0 15,000.0. 10,466.90 7,145.2. 10,000.0 5,000.0. 12,832.10. 9,279.4. 0.0 2011. 2014 Women. Man. The last task that Gonzalez and Gascón (2004) said that the pharmaceutical industry develops is the distribution. In this point it could be said that the drugs done in Spain are mainly sold outside our frontiers. An example is Grifols, a pharmaceutical company, that in 2012, had obtained 92% of its profits abroad (El País, 2013). The pharmaceutical industry in Spain suffered important transformations which requires companies’ fast adaptation to these changes in order to continue been sustainable (KPMG, 2011). Part of the mentioned transformation came from the economic uncertainty in Spain over the last years, raising financial difficulties to the industry (Gonzalez and Gascón, 2004). The reason of that is that the Spanish government uses an important part of the national budget in health care, due to the crisis, the government national budget shrank and, therefore, the pharmaceutical firms received less funds from the government (Puig-Junoy, 2004). The 2008 crisis also has been important in terms of the pharmaceutical industry regulation/normative changes, been those stricter. Other important change, that the 2008 crisis had made to the pharmaceutical industry, according to KPMG (2011), was that the generic products were gaining each day more importance from 2008 to the present, above all in developed countries like Spain, and this trend is expected to continue in the next years. Another reason of the last years Karina Quinteiro Vázquez. 12.
(13) Almirall S.A and Subsidiaries (Almirall groups) economic-financial analysis. elevated gaining importance of the generic products is the patents expiration of a great number of medicaments during this period. The last year of the drug patent is very important, because it determines the number of generic products, in consequence competitors, the medicament will have. The number of generics of a type of drug is determined by its revenue during its last year of patent (Morton, 2000). Continuing with the KPMG (2011) study, it is remarkable the fact that they had made a research in which some pharmaceutical companies’ directors gave their opinion of which were the most important business elements for them. Between the aforementioned elements were: looking for new alliances, increasing their market volume, or entering in new market segments. The mentioned elements are the ones in which the efforts of the pharmaceutical companies are centred. An evidence of that was the record figure of alliances, in the recent years, of 155.000 millions of € (Simón Ruiz, 2016). After obtained an idea of the Spanish pharmaceutical industry situation, it is useful to see the picture of the pharmaceutical industry at a global level. In this aspect, KPMG (2011) said, that the growth rate and profitability in the pharmaceutical industry, at a global level, have been decreasing over the last decade. However, the contrary happened in Spain, where the pharmaceutical companies in 2016 grew more than the PIB (Castillo, 2015). Also, like happens in Spain, the regulation and requisites of this type of products are each day higher at a global level, even more in the new products. Gonzalez and Gascón (2004) say, that the situation of the pharmaceutical industry in Europe does not differ substantially from the one at a global level previously exposed, as it is also too regulated. In Europe, now with the “Brexit” the huge U.K based drug companies are worried about what will happen with the exit of their country from the E.U. This could force them to introduce some extra regulatory elements if they leave the Europe economic area, but it depends on the U.K. government agreements reached with Europe when they leave the E.U. (Gulland, 2016). The industry future seems to be the investigation in the human genetic to be more efficient and personalised in the cure of some diseases (Luengo, 2012). The reason of the above fact is that people is each day more drug-resistant to some illnesses strain and there are also mutations of old diseases (Coopers, 2007) like the tuberculosis (WHO, 2017).. Karina Quinteiro Vázquez. 13.
(14) Almirall S.A and Subsidiaries (Almirall groups) economic-financial analysis. 1.1. Almirall introduction In this research, as said in the first paragraph of the industry overview, a pharmaceutical company, Almirall will be used. Almirall is based in Barcelona, they had started their business activity in 1944 developing the Prodesmicina (Almirall web, 2017). In their web, headline “About us”, they expose that, the company “research, develop, manufacture and market proprietary medicines as well as licensed products, in areas with unmet medical needs”. Almirall had launched products like Diazepam or Almax, few gastroprokinetic products and anti-inflammatory products among others. Their products can be found in 70 countries like U.S.A, Japan or Germany (Almirall web, 2017). It is also remarkable that the company is listed on the Spanish stock market since June 2007. I will compare the results obtained in Almirall to those achieved by Faes Farma, one of its direct competitors. Faes Farma is a pharmaceutical company founded in 1933 based in Bilbao “which develops, produces and commercialises pharmaceutical products and raw material” (Faes Farma web, 2017).. Karina Quinteiro Vázquez. 14.
(15) Almirall S.A and Subsidiaries (Almirall groups) economic-financial analysis. 2.. Data and methodology.. Prior to starting with the financial analysis of Almirall, in this second point of the paper, I will present the sources of data and the methodology used.. 2.1. Data The fundamental financial data used in the present paper came from two principal sources, the CNMV and SABI where information of 2.000.000 Spanish companies could be found. I downloaded the financial statements (Balance Sheet, Income Statement and Cash Flow Statement) of Almirall and its direct competitor, Faes Farma, from the website of the Comisión Nacional del Mercado de Valores (CNMV, 2017). Then, the Almirall Annual Report form the years 2007 to 2015 were obtained. I also collected data on key financial variables, like total assets, revenue or net income, from SABI (SABI, 2017) for the top 100 pharmaceutical firms in terms of total assets for do the industry study.. 2.2. Methodology In the development of this project, the used methodology will be as follows; first I obtained the necessary information from the previous section mentioned sources (CNMV and SABI), then I downloaded it to a spreadsheet and organize it. After download and organized all necessary data for the companies, the vertical and horizontal percentages for their Balance Sheet and Income Statement will be done for. Karina Quinteiro Vázquez. 15.
(16) Almirall S.A and Subsidiaries (Almirall groups) economic-financial analysis. known which accounting accounts in this type of industry have the higher weight and how they change over the period 2007-2015. The following step in the financial analysis will be examine the Almirall financial situation and performance from 2007 to 2015 with the common techniques. Then a comparison of the Almirall obtained data with Faes Farma one will be done for seen their major differences. In the second part of the research, using some statistical tool, like the percentile 25, percentile 75 or mean, I am going to study the Almirall position in the pharmaceutical industry. All those mentioned calculations will be done in a spreadsheet. In the last part of the research, with the recompilation of all the financial analysis information and the conclusions obtained in it, the Porter Five Forces and SWOT analysis for Almirall are exposed for obtain a deeper analysis of the firm.. Karina Quinteiro Vázquez. 16.
(17) Almirall S.A and Subsidiaries (Almirall groups) economic-financial analysis. 3. Overview of the information provided in the financial statements. The financial statement analysis is an efficient tool to obtain useful information from the companies´ data (Bernstein et al, 1997). In this section, a preliminary analysis of the Almirall Balance Sheet and Income Statement is going to be carried out, by computing vertical and horizontal percentages, tools that are highly important in the decision making (Gallés et al, 2005). The vertical percentage in the Balance Sheet is going to be calculated taking the total assets and total liabilities and equity as references; in the Balance Sheet, the reference will be the revenue. In the upcoming headlines (4) the financial situation and the profitability of Almirall and Faes Farma will be studied more in depth. The period of study is the years between the 2007 and 2015.. 3.1. The Balance Sheet In this point of the headline, the vertical and horizontal percentage of Almirall and Faes Farma Balance Sheet will be studied. By doing the vertical percentage of the Almirall balance during the studied period, in the assets part it can be said that the non-current assets was the element that had the higher weight in the assets, with a mean of a 67,44%, concretely inside it, the account intangible assets, was the one with the highest weight. In Faes Farma assets vertical percentages, the same situation occurs, for this it can be said that a high non-current assets importance is perfectly normal in the industry. The reason of the previous affirmation can be found in the fact that in the pharmaceutical industry, patents Karina Quinteiro Vázquez. 17.
(18) Almirall S.A and Subsidiaries (Almirall groups) economic-financial analysis. are extremely important because as Lehman (2003) said, there is almost a patent for product and these patents are accounted as intangible assets. It is important to remark that the inventory on both firms had not an important weight in the total assets. In Almirall equity and liabilities part of the Balance Sheet, the vertical percentages had revealed that the equity over the period 2007-2015 had the highest weight over the total equity and liabilities with a mean of 53,11%. The accounts that had the highest weight inside the equity were the capital and reserves during all the studied period (2007-2017). In Faes Farma the same described situation for Almirall is found. However, the equity weight mean over the total is higher than the Almirall one, a 65%, and this account (equity) had been gaining more weight over the last studied periods. Changing to the Balance Sheet horizontal percentages in Almirall, the intangible assets, account with an elevated vertical percentage all over the studied period (20072015), in the horizontal percentage it could be observed that the account had most part of the studied period diminishes, or very small increases. The period in which this account had obtained the highest fell in terms of horizontal percentage was in 2013-2014 dropping a 15%, on the other hand, in the lapse 2012-2013, the intangible assets horizontal percentage detects the highest increase (48%). In the current assets, the other account with a high vertical percentage, the most remarkable movements showed in the horizontal percentage were, first in the 2011-2012 with a decrease of a 32%, then in the 2014 -2013 it was detected an increase of a 230%. The Almirall Balance Sheet horizontal percentages also reveals an increase of a 58% in the cash from the period 2009-2010, meanwhile in Faes Farma it had been detected a fell in cash of a 77%. At the next period (2010-2011) in Almirall the cash fells a 30%. The most remarkable increase in the cash in Almirall, in terms of horizontal percentages (268%), was in 2013-2014. At the next and last studied period (2014-2015) its horizontal percentage reveals also a notable increase (100%). In Faes Farma, the cash in this period (2014-2015) increased more than in Almirall, a 280,29%. Another asset account that requires attention in Almirall, due its horizontal percentage is other receivables, its horizontal percentages are presented in Table 1. Other receivables in the 2013-2014 had an increase of 1882%, indicating that in that period Almirall had delayed the customer payments, this could be seen in detail in the headline 4.1. However, as said in the previous paragraph their cash had increase, that means that Almirall could have had in that period a higher cash increase if they had collected more of this money receivable. For other part, in the next period Almirall had received some of this money receivable, because it is detected a decrease of 82% in the other receivables account.. Karina Quinteiro Vázquez. 18.
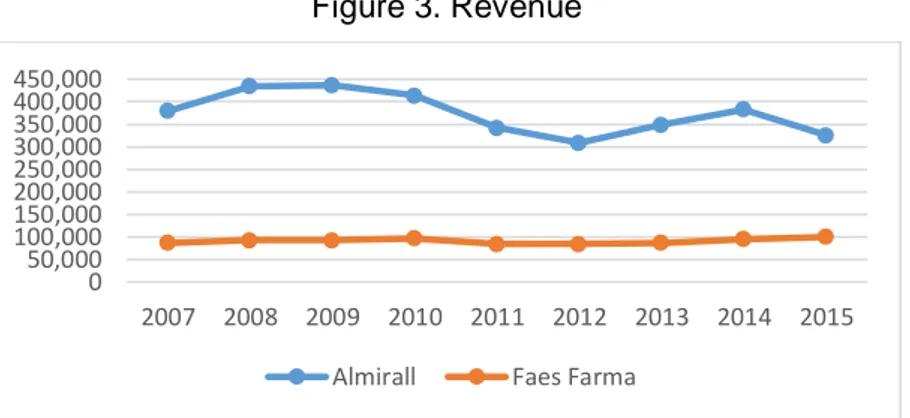
(19) Almirall S.A and Subsidiaries (Almirall groups) economic-financial analysis. Table 1. Other receivables horizontal percentage.. Other receivables. 2007. 2008. 2009. 2010. 2011. 2012. 2013. 2014. 2015. 18.120. 24.468. 22.738. 18.395. 17.071. 15.895. 4.846. 96.048. 17.773. 35,03%. -7,07%. -19,10%. -7,20%. -6,89%. -69,51% 1882,01%. -81,50%. Horizontal %. After detailed the Almirall assets accounts most remarkable horizontal percentages, it is turn to do it with the liabilities and equity. In the equity and liabilities horizontal percentages it is remarkable to study figures of the capital and reserves due to its elevated vertical percentage. In the first periods (2007-2009) the increase of this account was similar, a 15%, then on, the account growth at a less level and even it decreases a 4% in the years 2012-2013. However, in the period 2013-2014 they had a maximum increase of a 50%. Another account in the Almirall equity and Liability that requires attention due its horizontal percentage, although it had a low vertical percentage, is other payables, because in the period 2010-2011 had an increase of a 52% coinciding with a decrease of a 38% of the cash accounts. Also in the next period (2011-2012) other payables increase, like in the 2014-2015 (30%). In those periods, the cash in 2011-2012 decreases only an 8% and in the last studied period it increases a 100%, for that seems that the company postpones these payments for its own payments strategy not for not having money like it can appear in the 2010-2011.. 3.2. The Income Statement. As the previous headline point, in this section, the vertical and horizontal percentages of the firms Income Statement will be studied. In the Income Statement as an important element the revenue can be found. The Figure 3 shows a comparison of the Almirall and Faes Farma revenue.. Figure 3. Revenue 450,000 400,000 350,000 300,000 250,000 200,000 150,000 100,000 50,000 0 2007. 2008. 2009. 2010. Almirall. Karina Quinteiro Vázquez. 2011. 2012. 2013. 2014. 2015. Faes Farma. 19.
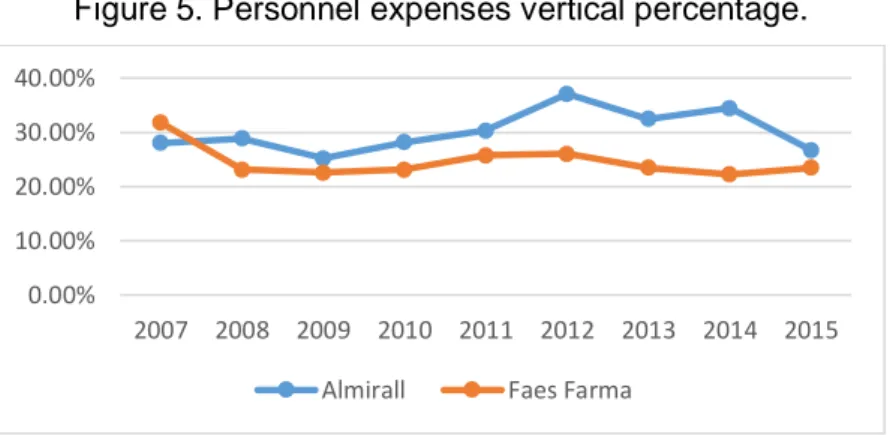
(20) Almirall S.A and Subsidiaries (Almirall groups) economic-financial analysis. In the previous graphic (Figure 3) the difference between the revenues of both firms can be observed, Almirall had high amount of it but it is an oscillating one and with a descendent trend. However, the Faes Farma revenue, was less amount but less fluctuating and it followed a slight upward trend. As it said in the Industry introduction in the first paragraph, Almirall is in the stock exchange since 2007, this is relevant now because the point in which the Almirall revenue was lower (2012) coincide with the point when Almirall had their lower IBEX 35 rating (Figure 4). Figure 4. Last year’s Almirall stock market (IBEX 35) evolution. (Bolsa de Madrid, 2017). In the Income Statement of Almirall and Faes Farma the vertical percentage shows a great investment in personnel for the studied period (2007-2015) as the Figure 5 illustrates. This type of expense was on both firms a huge percentage of the revenue, because as Luengo (2012) said it is normal to have an elevated number of employees in the pharmaceutical industry, consequently the expenditure in salaries is important. However, in 2015 in Almirall this expense fell due to the cession of part of the employees of the respiratory business, this will be explained later together with the other operating income account.. Figure 5. Personnel expenses vertical percentage. 40.00% 30.00% 20.00% 10.00% 0.00% 2007 2008 2009 2010 2011 2012 2013 2014 2015 Almirall. Karina Quinteiro Vázquez. Faes Farma. 20.
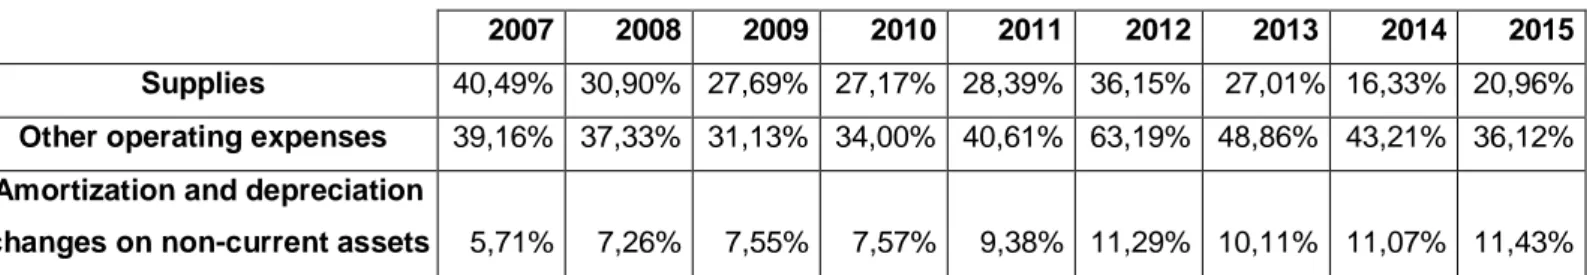
(21) Almirall S.A and Subsidiaries (Almirall groups) economic-financial analysis. Other relevant expenses that had a high vertical percentage in Almirall, such as the supplies or the amortization on non-current assets are detailed in the following table (Table 2).. Table 2. Relevant expenses from the vertical percentage perspective. 2007 Supplies. 2008. 2009. 2010. 2011. 2012. 40,49% 30,90% 27,69% 27,17% 28,39% 36,15%. Other operating expenses. 2013. 2014. 2015. 27,01% 16,33% 20,96%. 39,16% 37,33% 31,13% 34,00% 40,61% 63,19% 48,86% 43,21% 36,12%. Amortization and depreciation changes on non-current assets. 5,71%. 7,26%. 7,55%. 7,57%. 9,38% 11,29% 10,11% 11,07% 11,43%. Complementing this table (Table 2) with the revenue obtained by Almirall it is important to comment that in 2012 it can be seen a fall in the revenues and an increase of the weight of the account other operating expenses. This fact was explained in an interview done to the Almirall CEO, published in the 2012 Annual Report, when he said that the revenue had fallen “due to the austerity measures implemented in Spain over the past three years” (p.12). In the same interview the Almirall CEO explains the increase of the other operating expenses account, the reason is that the R&D expenses is accounted there between other elements. The CEO stated that the firm R&D expense increase (Table 2) comes from their intention to set up their respiratory business. In the following table (Table 3), the vertical percentage of other operating income, show an increment in 2012, this was mainly due, as they said in the Almirall 2012 Annual Report (Almirall web, 2017), to the income received for achieve the authorization in E.U. and U.S.A for the Aclidinum, a drug for the obstructive pulmonary diseases. However, the highest increment of this income was detected in 2014 passing, from a 19% to a 155% this was because as they expose in the 2014 Annual Report, they sell the respiratory business to AstraZeneca, another pharmaceutical company. The same year Almirall had received the first payment for the mentioned movement. In this report, they also explained that the company had transferred 719 employees that were working in the respiratory area to AstraZeneca.. Table 3. Other operating income vertical percentage. Other operating income. 2007. 2008. 2009. 2010. 2011. 2012. 2013. 2014. 2015. 16,60%. 17,08%. 12,25%. 14,17%. 15,61%. 54,97%. 18,89%. 154,54%. 10,90%. Karina Quinteiro Vázquez. 21.
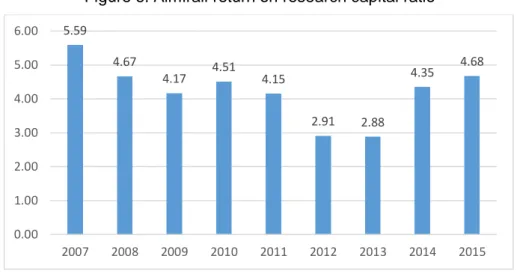
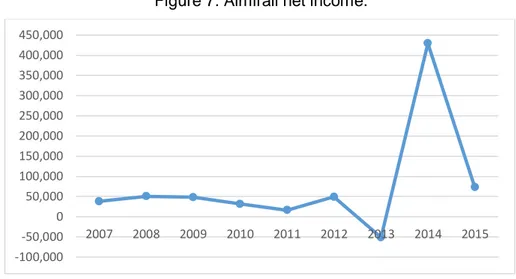
(22) Almirall S.A and Subsidiaries (Almirall groups) economic-financial analysis. As said in the Industry overview, the R&D is very important for this type of industry, in this context regarding to Investopedia (2017) the Return On Research Capital Ratio (RORC) measures the revenue obtained for the investment (R&D). The mentioned ratio is calculated as follows:. RORC= Current year gross profit/ Previous year R&D expenditure (Investopedia, 2017).. Figure 6. Almirall return on research capital ratio 6.00. 5.59 4.67. 5.00. 4.17. 4.51. 4.35. 4.15. 4.68. 4.00 3.00. 2.91. 2.88. 2012. 2013. 2.00 1.00 0.00 2007. 2008. 2009. 2010. 2011. 2014. 2015. The return on research capital ratio of Almirall (Figure 6) shows that the year in which the firm received more revenue due their investment was the 2007. Then on, the ratio shows that the revenue obtained for the investment was each year less, until 2013, where this ratio had its lower point. From 2013 on it seems that the revenue from the Almirall investments was incremented until the point of reach a 4,7, the second highest point of the studied period (2007-2015). At the end of the Income Statement it is the net income, that is the company total earnings. The Figure 7 depicts the net income evolution in Almirall over the period 20072015. It is important to highlight that in 2013 the profit of Almirall fell until the point of had losses of 51.365€. The reason of that, as it is shown in the Almirall 2013 Annual Report (Almirall web, 217) was the restructuring cost provisioned in 2012 for an amount of 80,3 million. However, in 2014 Almirall had their highest profit of the studied period (2007-2015), this was as they said in their Annual Report 2014 (Almirall web, 2017), due to the previous explained AstraZeneca disposal of the Almirall respiratory business rights. Meanwhile, the Faes Farma benefits are quite constant (Table 4), showing to be a more stable company in question of profits.. Karina Quinteiro Vázquez. 22.
(23) Almirall S.A and Subsidiaries (Almirall groups) economic-financial analysis. Figure 7. Almirall net income. 450,000 400,000 350,000 300,000 250,000 200,000 150,000 100,000 50,000 0 -50,000 -100,000. 2007. 2008. 2009. 2010. 2011. 2012. 2013. 2014. 2015. Table 4. Faes Farma net income. Net income. 2007 8.883. 2008 5.405. Karina Quinteiro Vázquez. 2009 8.822. 2010 7.310. 2011 3.766. 2012 10.202. 2013 9.902. 2014 11.285. 2015 14.792. 23.
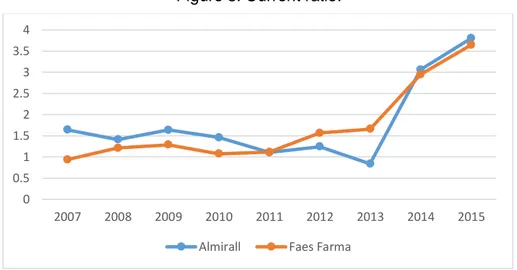
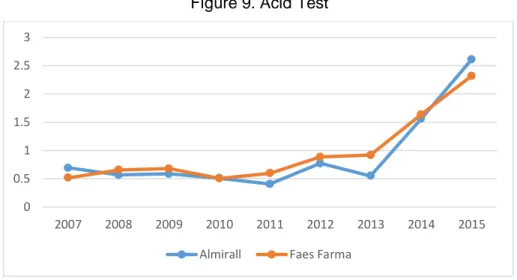
(24) Almirall S.A and Subsidiaries (Almirall groups) economic-financial analysis. 4.. Almirall financial situation. Whichever is the orientation of the financial analysis, it should have some important categories, between them, the liquidity, solvency or the cash flow evolution (Bernstein, 1997). For that, the present section will inform about the financial situation of Almirall, in the short (liquidity), long term (solvency) and its performance. Those mentioned elements will be studied with the appropriated ratios, because they are the wider used tools for elaborate the financial analysis (Wild, 2011). The previous study will be compared with the obtained results in Faes Farma when consider appropriated, as it had been done in the above research headline.. 4.1. Liquidity The liquidity is the firm resources availability to meet short-term obligations and to efficiently generate revenues (Wild, 2011). In this context, a short-term period is considered a stretch of a year or less (Bernstein et al ,1997). The liquidity is better understood by looking the firm capacity to pay the short-term debts (Bernstein et al, 1997), the ratios that measure the mentioned capacity are the current ratio, the acid test and some turnovers like the accounts receivable turnover. These ratios will be applied to Almirall during the section, to give us an idea of its liquidity during the studied period (2007-2015). The first ratio I am going to expose, to study the Almirall liquidity, is the current ratio (Figure 8). The mentioned ratio informs about “the degree of coverage of the current asset regarding the current liabilities” (Gallés et al, 2005, p.123). According to Gallés et al (2005). Karina Quinteiro Vázquez. 24.
(25) Almirall S.A and Subsidiaries (Almirall groups) economic-financial analysis. an elevated current ratio, shows that the firm can affront the short-term debt with more guarantee. The current ratio evolution of both firms is described in the Figure 8. The graphic (Figure 8) shows that Almirall and Faes Farma had similar current ratio trend, at first it is quite low. Then, since 2013, it grows, being multiplied almost by 4, achieving its higher current ratio point in 2015 on both firms, in this case, the Almirall one was slightly superior. Contrary, it could be highlighted that Almirall had their lower guarantee to affront their shortterm debt in 2013, in Faes Farma this point was in 2007. For all the previous presented arguments and after examining the Figure 8, the following conclusion is reached: both companies had better liquidity in 2015 than 2007.. Figure 8. Current ratio. 4 3.5 3 2.5 2 1.5 1 0.5 0 2007. 2008. 2009. 2010 Almirall. 2011. 2012. 2013. 2014. 2015. Faes Farma. As commented in the headline introduction with only the current ratio is not possible to obtain a conclusion of the firm liquidity over the studied period (2007-2015), for that the liquidity study will continue with the acid test ratio of both companies. The acid test gives us the information about if the company has enough short-term assets to cover the short-term liabilities (Accounting for Management, 2013). From the Figure 9, where it is illustrated the Almirall and Faes Farma acid test, it can be said that Almirall had a low acid ratio from 2007 to 2013, this means that they might have not enough liquidity during a huge part of the studied years. The same happened in Faes Farma but with the difference that in the 2012 and 2013 they had the acid ratio close to 1, meanwhile Almirall acid ratio was close to 0,5. However, both firms in 2014 and 2015 had experienced an increment of their acid test, it is a similar behavior to the one presented in their current ratio, showing a probably growth in their liquidity to affront the short-term payments in the last two years.. Karina Quinteiro Vázquez. 25.
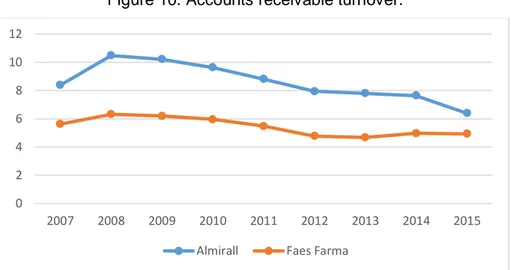
(26) Almirall S.A and Subsidiaries (Almirall groups) economic-financial analysis. Figure 9. Acid Test 3 2.5 2 1.5 1 0.5 0 2007. 2008. 2009. 2010 Almirall. 2011. 2012. 2013. 2014. 2015. Faes Farma. The last elements that are going to be studied, to have an idea of the Almirall liquidity will be the turnovers (accounts receivable turnover (Figure 10); days sales uncollected (Figure 11); and days payable outstanding (Figure 12)). In Almirall, what was remarkable was the diminish in the accounts receivable turnover (Figure10), fact that did not happened in Faes Farma so markedly, because its accounts receivable turnover was more constant. In the Figure 10, I could see that Almirall accounts receivable turnover changes from 8,5 in 2007 to a 6 in 2015. This shows that in the period 2008-2015, Almirall had a diminish in the money collection strategy efficiency, they had collected each year with less frequently the money owned, as the days sales uncollected shows (Figure 11). From the Figure 11, also, it could be asserted that Almirall collected its payments in almost 40 days in the period 2007-2013. This is an indicator that Almirall should had liquidity, as it collects money from the clients with frequency, contrary to what the current ratio and acid test indicate to us. The mentioned fact is explained by saying that for the Almirall liquidity need, they had to start to collect the owned money very frequently to try to solve their problem. In the last two years (2014 and 2015) it seems that Almirall started to collect the money owned with less frequency, as its accounts receivable turnover falls until 6, it coincides with the high current ratio and acid test data, meaning better liquidity. The comments were only done for Almirall because Faes Farma had a similar situation as the following graphic (Figure 10 and Figure 11) shows.. Karina Quinteiro Vázquez. 26.
(27) Almirall S.A and Subsidiaries (Almirall groups) economic-financial analysis. Figure 10. Accounts receivable turnover. 12 10 8 6 4 2 0 2007. 2008. 2009. 2010. 2011. Almirall. 2012. 2013. 2014. 2015. 2014. 2015. Faes Farma. Figure 11. Days sales uncollected 90 75 60. 45 30 15 0 2007. 2008. 2009. 2010 Almirall. 2011. 2012. 2013. Faes Farma. The last turnover that will be study in the Almirall financial research will be the accounts payable turnover. In the following graphic (Figure 12) the days payables outstanding is illustrated from Almirall and Faes Farma, in it could be seen that Almirall payed to the suppliers in 250 days in 2007. This gave them a great margin compared with the days sales uncollected (40 days) and the chance to pay the suppliers with the clients collected money. The same happened in Faes Farma but they had less margin between the days they receive the money and the moment they had to pay to the suppliers, as its days payable outstanding were lower and more constant than the Almirall one. In Almirall from 2007 to 2015 the days payable outstanding had increased, until the point that in 2014, Almirall had paid their debt with the suppliers in 637 days (almost 2 years) as the graphic (Figure 12) shows.. Karina Quinteiro Vázquez. 27.
(28) Almirall S.A and Subsidiaries (Almirall groups) economic-financial analysis. Figure 12. Days payable outstanding 700 600 500 400 300 200. 100 0 2007. 2008. 2009. 2010. 2011. Almirall. 2012. 2013. 2014. 2015. Faes Farma. 4.2. Solvency The solvency is “the ability of a company to meet its long-term financial obligations” (Bosón et al, 2017, p.239), in other words, it is the ability of a firm to pay their long-termdebts. To study the firms (Almirall and Faes Farmas) solvency, the debt ratios and cash flow evolution will be calculated, shown and explained. The first tool used in the study of the firms’ solvency is going to be the debt ratio. Its evolution is represented in the Figure 13 and Figure 14 for Almirall and Faes Farma respectively. On both companies, their total debt ratio went in the same descendent direction over the period 2007-2015. However, in Almirall in 2013, their total debt had increased, it is due to an increment of the total liabilities and a decrease in the equity, as the calculations done in the spreadsheet shows. The Figure 14 shows another element of interest in the Almirall debt ratios, in the period 2010-2012, when the short-term debt was higher than its long-term debt. The explanation of the previous fact was found in the analysis of the ratios components, where it could be seen a decline in the non-current liabilities in the period 2010-2012, due to lack of debts with credit institutions, as it could be seen in the 2012 Almirall Balance Sheet. In 2013, the Almirall long-term debt come back to normal values, it was for the increment of the non-current liabilities due to new debts with credit institutions. On the other hand, in Faes Farma, the nearest point to the previous described situation was in 2009, where both types of debts were quite close but never the short-term debt was above the long-term debt.. Karina Quinteiro Vázquez. 28.
(29) Almirall S.A and Subsidiaries (Almirall groups) economic-financial analysis. Figure 13. Almirall debt ratios 1.6 1.4 1.2 1 0.8 0.6 0.4 0.2 0 2007. 2008. 2009. Total debt ratio. 2010. 2011. 2012. Long term debt ratio. 2013. 2104. 2015. Short term debt ratio. Figure 14. Faes Farma debt ratios 1 0.8 0.6 0.4 0.2 0 2007. 2008. 2009. Total debt ratio. 2010. 2011. 2012. Long term debt ratio. 2013. 2014. 2015. Short term debt ratio. As said in the headline introduction, the other elements that helps to know the company solvency situation are the cash flows from operating, investing and financing activities. For that, in the next figures (Figure 15 and Figure 16) the evolution of them during the studied period (2007-2015) in Almirall and Faes Farma will be exposed.. Figure 15. Almirall cash flow evolution 750,000 600,000 450,000 300,000 150,000 0 -150,000 -300,000 -450,000 -600,000. 2007. 2008. 2009. 2010. Cash flows from operating activities. 2011. 2012. 2013. 2014. 2015. Cash flows from investing activities. Cash flows from financing activities. Karina Quinteiro Vázquez. 29.
(30) Almirall S.A and Subsidiaries (Almirall groups) economic-financial analysis. Figure 16. Faes Farma cash flow evolution 50,000 40,000 30,000 20,000 10,000 0 -10,000 -20,000 -30,000 -40,000. 2007. 2008. 2009. 2010. Cash Flow from operating activities. 2011. 2012. 2013. 2014. 2015. Cash Flow from investing activities. Cash Flow from financing activities. In the previous graphics (Figure 15 and Figure 16), what is more remarkable is the Almirall cash flow evolution (Figure 15), for that this part of the research will be more focused on it than in the Faes Farma one. The Almirall operating activity cash flow had been positive and quite linear until 2014. Because of the mentioned agreement with AstraZeneca, in 2014 Almirall accounts the money received in cash or cash equivalents for the sale of the respiratory business as an operating activity, increasing it. (Almirall Annual Report, 2014). In Faes Farma the cash flow from operating activities was also positive with a descendent trend the first years and an increasing one since 2010 (Figure 16). Moving on to the cash flow from investing activity, it can be seen that during all the studied period (2007-2015), this cash flows were negatives in Almirall and Faes Farma, meaning that both firms were investing money in their business in that period. Looking at the Cash Flows Statement, the account in which both companies were investing more was in intangible assets. This is common, because, as previously explained in the Overview of the information provided in the financial statements, the aforementioned account contains the patents, and a huge part of the pharmaceutical industry benefits comes from the investment that the companies do in them. Regarding the cash flow from financing activities, it could be said that Almirall only needed to issue new debt in 2013, for the necessary investment to bought the 100% of Aqua Pharmaceutical Holdings, a specialized company in the dermatological area. Almirall in 2013 did not had enough money to affront the transaction, for that they recurred to a loan of 254 millions of € (Almirall Annual Report, 2013). The rest of the studied years as it could be seen in the graphic (Figure 13), Almirall had enough cash to made investments. In the case of Faes Farma during all the period the firm had enough money to do their necessary investments, without the need to recur to a loan as Almirall did.. Karina Quinteiro Vázquez. 30.
(31) Almirall S.A and Subsidiaries (Almirall groups) economic-financial analysis. 4.3. Performance In this final section of the Almirall financial situation analysis, the performance will be presented. The performance indicator is used to know how “well an organization is achieving its desired objectives” (Business Dictionary, 2017). To know which was the firm performance during a period, in this case the period (2007-2015) it is useful to use the return on assets and the return on equity and its components. To start the performance analysis the return on assets will be studied. The return on assets gives an image of how the firms use their assets in an efficient way to generate profits (Bonsón et al, 2009). In the Figure 17 the return on assets of both firms (Almirall and Faes Farma) during the period 2007-2015 are shown. Additionally, to obtain more information, the Almirall return on assets components is presented in the Table 5. The Figure 17, shows that from 2007 to 2012 Almirall and Faes Farma had a return on assets quite similar, and near to 0. However, in 2013, Almirall return on assets fell until the point of being negative, the cause of this was found in the negative profit margin of this year (Table 5) due to the losses registered, because of the elevated restructuring cost. Then, in 2014 Almirall return on assets enhanced a quite elevated measure, that as the Table 5 shows, it was because in 2014, they obtained a high-rise profit margin. The reason of that was found in the extraordinary profit obtained by Almirall in 2014 for the AstraZeneca agreement in the sale of the respiratory business. In 2015, Almirall seems to recover the normality, as their return on assets was lower and more similar to the previous years, in consequence, it has been like the Faes Farma one. In these years (2013-2015) Faes Farma return on assets remains quite stable compared to the Almirall one.. Figure 17. Return on assets 7 5 3 1 -1. 2007. 2008. 2009. 2010 Almirall. Karina Quinteiro Vázquez. 2011. 2012. 2013. 2014. 2015. Faes Farma. 31.
(32) Almirall S.A and Subsidiaries (Almirall groups) economic-financial analysis. Profit Margin Asset turnover Return on assets. Table 5. Almirall return on assets components. 2007 2008 2009 2010 2011 2012 2013 0,1007 0,1163 0,1102 0,0765 0,0479 0,1593 -0,1471 0,2973 0,3067 0,3033 0,2738 0,2285 0,2196 0,2232 0,3386 0,3794 0,3634 0,2797 0,2099 0,7253 -0,6593. 2014 1,1220 0,1774 6,3236. 2015 0,2242 0,1284 1,7467. Another element to take in consideration in order to interpret the firm performance is the return on equity, it measures the profit that a firm obtains with the investments of the shareholders (Bonsón et al, 2009). About the firms return on equity (Figure 18) it could be said that both firms return on equity had a similar shape to the return on assets, they were quite constant and similar in Almirall and Faes Farma from the 2007 to 2012 and then Almirall had some extreme points. As in the return on assets, the Almirall return on equity was negative in 2013 and then, in 2014 it was very elevated, it also comes from the previous explained losses and the extraordinary revenue that Almirall had in 2013 and 2014 respectively. The reason of the return on assets and return on equity had similar shape is that they share two components : the profit margin and the assets turnover. During the period in which the Almirall extreme points happened, Faes Farma return on equity had a slightly increasing trend, however, the return on assets remains quite stable during 2013 and 2014. In 2015, both firms return on equity was quite similar.. Figure 18. Return on equity 0.4 0.35 0.3 0.25 0.2 0.15 0.1 0.05 0 -0.05 -0.1. 2007. 2008. 2009. 2010 Almirall. 2011. 2012. 2013. 2014. 2015. Faes Farma. After studying the graphics (Figure 17 and Figure 18), it is important to conclude that both firm had an almost identical performance from 2007 to 2012. Then on, Almirall return on assets and return on equity changes as explained before. As it had been told, during the study of the Almirall return on assets and return on equity, the extraordinary profit generated in the company by the sold of the respiratory. Karina Quinteiro Vázquez. 32.
(33) Almirall S.A and Subsidiaries (Almirall groups) economic-financial analysis. business affects the net income and distorts the return on assets and the return on equity results. For that it had been considered interesting to show the real returns by isolating them from the extraordinary revenue (Figure 19 and Figure 20) to know the Almirall real performance.. Figure 19. Adjusted Return on assets 2 1.5 1 0.5 0 2007. -0.5. 2008. 2009. 2010. 2011. 2012. 2013. 2014. 2015. 2014. 2015. -1 -1.5 -2 Almirall. Faes Farma. Figure 20. Adjusted Return on equity 0.1 0.05 0 2007. 2008. 2009. 2010. 2011. 2012. 2013. -0.05 -0.1 -0.15 Almirall. Faes Farma. In the graphics (Figure 19 and Figure 20) can be seen that the Almirall return on assets and return on equity in the 2014, without the extraordinary revenue, were negative, that means that Almirall in the 2013 and 2014 did not use their assets/shareholders’ investments in an efficient way to generate revenues. Contrary to what happened in the other years (2007-2012), where it seemed that both firms used their assets/shareholders´ investments in an efficient way. However, Faes Farma extended this all over the studied period (2007-2015).. Karina Quinteiro Vázquez. 33.
(34) Almirall S.A and Subsidiaries (Almirall groups) economic-financial analysis. 5. Almirall position in the pharmaceutical industry. The financial situation of a firm in great measure is subject to the financial situation of the industry, for that it is important to elaborate some elements studied for Almirall, like the return on assets or return on equity in the industry. With that it could be shown where was Almirall allocated in the pharmaceutical industry during the studied period, information for compare them is obtained in the present headline Hereby some statistical measures (percentile 75, percentile 25, median, mean, maximum and minimum) will be used in the industry data. A relevant fact for this part of the research is that the studied period is from 1999 to 2015.. 5.1. Almirall firm size The objective of the present section will study the Almirall firm size in the pharmaceutical industry. The Almirall firm size could be obtained comparing their total assets (Figure 21) and revenue (Figure 22) with the industry ones. The Figure 21 reveals that Almirall had an amount of total asset superior to the maximum of the industry in most of the studied period (1999-2015), that give us an idea that Almirall is a big firm. In this case, the firm with the maximum total asset in the pharmaceutical industry was Novartis Farmaceutica S.A. (SABI, 2017).. Karina Quinteiro Vázquez. 34.
(35) Almirall S.A and Subsidiaries (Almirall groups) economic-financial analysis. Figure 21. Total assets comparison 2,700,000 2,250,000 1,800,000 1,350,000 900,000 450,000 0. Maximum. Almirall. The second element for study the Almirall size will be the revenue. In the Figure 22 the comparison of the industry and Almirall revenue is exposed. It can be observed that Almirall had a revenue very close to the industry maximum. Looking at the industry downloaded data (SABI, 2017), the revenue leader was, like in the total assets, Novartis Farmaceutica S.A. On the other hand, Simón Ruiz (2016) exposed, that in 2015 the world industry leader was Swiss Roche, with a profit of 46.000 millions of €. Considering all the previous facts, it could be said that Almirall was one of the big firms of the industry during the studied period, the peculiarity was that it is the firm with the highest total assets but not with the highest revenue as the Figure 21 and Figure 22 show.. Figure 22. Revenue comparison 2000000 1550000 1100000 650000 200000 -250000 Percentile 75. Karina Quinteiro Vázquez. Maximum. Minimum. Almirall. 35.
(36) Almirall S.A and Subsidiaries (Almirall groups) economic-financial analysis. 5.2. Industry return on assets In this section of the headline, the return on assets and its components of the industry and Almirall will be compared (Figure 23) to assess the position of Almirall in the pharmaceutical industry over the period 1999-2015.. Figure 23. Industry return on assets 2. 1.5 1 0.5 0 -0.5. Percentile 75. Percentile 25. Median. Almirall. In the Figure 23 is shown that, during part of the studied period Almirall (19992012) was between the 25 companies in the pharmaceutical industry with the highest return on assets. They had been in the period 1999-2005 closer to the 25th position than during the period 2005-2012. Contrary, in 2013, Almirall, had a negative return on assets, due to the elevated losses they had this years, as mentioned in the Performance section. In this case its position in the industry was between the 25th last firms in terms of return on assets. In the 2014 and 2015 the Almirall return on assets was incremented, been superior to most of the pharmaceutical industry firms. Meanwhile, the industry return on assets seems to follow a quite stable trend during the studied period (1999-20015). In the following graphics (Figure 24 and Figure 25), the pharmaceutical industry return on assets components (profit margin and assets turnover) percentiles 75, 50 and 25 and Almirall are exposed with the purpose of trying to study the reason of the difference in the return on assets between the firm and the industry.. Karina Quinteiro Vázquez. 36.
(37) Almirall S.A and Subsidiaries (Almirall groups) economic-financial analysis. Figure 24. Industry profit margin 0.6 0.5 0.4 0.3 0.2 0.1 0 -0.1 Percentile 75. Percenetile 25. Median. Almirall. Figure 25. Industry assets turnover 1.6 1.4 1.2 1 0.8 0.6 0.4 0.2 0. Percentile 75. Percentile 25. Median. Almirall. As it could be seen in the graphics (Figure 24 and Figure 25) the industry and Almirall had higher assets turnover than profit margin during all the studied period (19992015). In some points like in Almirall the years 2013 and 2014 the difference was higher than the rest of the period. Remaining the mentioned extraordinary points, the general trend for Almirall and the industry was that the profit margin increases and the assets turnover decreases. The previous mentioned fact shows that the return on assets components general trend in Almirall and the industry is opposite, in some point in the future the profit margin and the assets turnover will cross each other. Almirall had an elevated profit margin (Figure 24) (it is over the percentile 75 almost all the period), on the other hand its assets turnover (Figure 25) was in the percentile 25, meaning that had a low assets turnover. The explanation of this circumstance could be that Almirall sells more patent products (products with great benefits) than the 75% of the other. Karina Quinteiro Vázquez. 37.
(38) Almirall S.A and Subsidiaries (Almirall groups) economic-financial analysis. industry companies. Apart from this, the low assets turnover could come from the fact that Almirall was not the firm with the highest revenue in the industry.. 5.3. Industry return on equity In this last section of the present headline, the other ratio mentioned in the introduction, the return on equity, will be studied in the pharmaceutical industry. Then it will be compared it with the Almirall one during the period 1999-2015 (Figure 26). According to the graphic (Figure 26) Almirall was a firm with a return on equity quite normal between the 1999 to the 2015 compared with other pharmaceutical industry organizations. The Almirall return on equity was rounding the position 50 over the 100 companies until the 2005, then their return on equity was a bit higher until 2011. As mentioned in the correspondent sections, in 2013 and 2014 the special points in Almirall were faced. In the pharmaceutical industry, the return on equity had a downward trend and it was always quite constant compared to the Almirall one. In conclusion, it could be said that Almirall had obtained less profit from the shareholder´s investments than the 50% of the other industry firms, less in 2014, when they had obtained more profit from the shareholder investments, than the 75% of the industry firms. As mentioned before other exception is the year 2013 when the Almirall return on equity was one of the lowest compared to the industry.. Figure 26. Industry return on equity 0.4. 0.35 0.3 0.25 0.2 0.15 0.1 0.05 0 -0.05. 19992000200120022003200420052006200720082009201020112012201320142015. -0.1. Percentile 75. Karina Quinteiro Vázquez. Percentile 25. Median. Almirall. 38.
(39) Almirall S.A and Subsidiaries (Almirall groups) economic-financial analysis. 6. Almirall weaknesses and strengths. To finish the Almirall analysis, in this section their weaknesses and strengths based on the all previous analysis are exposed, for that the Porter Five Forces and the SWOT analysis will be used to have a deeper review.. 6.1. Porter Five Forces The first of the tools mentioned previously that is going to be developed is the Porter Five Forces. The components of this tool are: threats of new entrants, degree of rivalry, bargaining power of buyers, bargaining power of suppliers and substitute products (Figure 27). The mentioned forces will be explained more in depth in the following subsections with the correspondent extrapolation to the company.. Karina Quinteiro Vázquez. 39.
(40) Almirall S.A and Subsidiaries (Almirall groups) economic-financial analysis. Figure 27. Porter Five Forces (Porter, 2008, p.4). 6.1.1.. Threats of new entrants. “The threat of entry into an industry depends on the barriers to entry that are present, coupled with the reaction from existing competitors that the entrant can expect.” (Porter, 2008, p.7). As the threats of new entrant depends on the barriers to entry, in this section will be exposed this barrier to entry in the Almirall industry. The principal barrier to entry in the pharmaceutical industry is the high expense in the R&D, that, as stated in the introduction, it is the most important expense in the industry, as it means the development of new products with the ones they obtain benefits. The other important barrier to entry that could be found in this industry is the strict regulation the firms are submitted, as the company must adapt they internal regulations for develop legal products. Based in what Porter (2008) says, Almirall has LOW threats of new entrants, as it is complicate to enter in the industry for the elevated barriers to entry.. Karina Quinteiro Vázquez. 40.
(41) Almirall S.A and Subsidiaries (Almirall groups) economic-financial analysis. 6.1.2.. Degree of rivalry. According to Porter (2008): Rivalry occurs because one or more competitors either feels the pressure or sees the opportunity to improve position. In most industries, competitive moves by one firm have noticeable effects on its competitors and thus may incite retaliation or efforts to counter the move; that is, firms are mutually dependent. (p.17). The degree of rivalry in the pharmaceutical industry is elevated, this could be seen in the fact that the companies, including Almirall, in the industry had similar profit margin, as it can be observed in the graphic (Figure 24). In conclusion, it could be found that Almirall has HIGH degree of rivalry, as the profit margin of the company and the section are very similar to the Almirall one (Figure 24).. 6.1.3.. Bargaining power of buyers. “Buyers compete with the industry by forcing down prices, bargaining for higher quality or more services, and playing competitors against each other- all at the expense of industry profitability” (Porter, 2008, p.24). As Porter (2008) exposed a buyer has power if it concentrates an elevate company sales. In the pharmaceutical industry, the hospitals are one of the principal buyers of the drugs, they make price pressure over the companies included Almirall, making them to actualize the price with frequency, as the hospitals tend to use generic products (Caves et al, 1991). In conclusion, it could be found that Almirall´s buyers have HIGH bargaining power.. 6.1.4. Bargaining power of suppliers As the buyers, “suppliers can exert bargaining power over participants in an industry by threatening to raise prices or reduce the quality of purchased goods and services.” (Porter, 2008, p.27) In the pharmaceutical industry, the companies need specific elements to elaborate the drugs that spcialized supplier firms supplied to them. According to Porter (2008) it is one of the conditions for the supplier to have power. However, in order to know if Almirall. Karina Quinteiro Vázquez. 41.
(42) Almirall S.A and Subsidiaries (Almirall groups) economic-financial analysis. has low or high bargaining power of suppliers the days payable outstanding of Almirall and the industry will be exposed (Figure 28).. Figure 28. Industry days payables outstanding 700 600 500 400 300 200 100 0 2008. 2009. 2010. 2011. 2012. 2013. 2014. 2015. Sector Median Days payables outstanding Almirall Days payables outstanding 25 Sector total assets higher firms median days payables outstanding. The Figure 28 reveals that Almirall during the studied period (2008-2015) payed to their suppliers in an elevated amount of days. However, in the mentioned graph it could be seen that the industry payed in an extraordinary less amount of time, almost Almirall half of time. In conclusion, it could be found that Almirall has LOW bargaining power of buyers as their days payable outstanding were really elevated, never less than 200 days and during the studied period (2008-2015) this days increased more.. 6.1.5. Substitute products According to Porter (2008, p. 23) “identifying substitute products is a matter of searching for other products that can perform the same function as the product of the industry”, in the pharmaceutical industry the principal substitutes are the generics, as nowadays the generic drugs are gaining more importance in the market than the “private” medicaments. As said in the research introduction, it is because the generic drugs have less R&D expense. In conclusion, it could be found that Almirall has HIGH substitute products as they develop the products and when the patents expire other pharmaceutical companies could produce such drug.. Karina Quinteiro Vázquez. 42.
Figure
+7
Documento similar
In a second Stage Data Envelopment Analysis (DEA) with variable return to scale (BCC) has been used to obtain the standard e fficiency, using output-oriented option in order
In Section 2, we present, first, univariate unobserved component modeling and its frequency domain implications; second, we offer an outline of the usual static common factor
We present the concept of the Galapagos Islands as a linked SES and revisit its current situation from a systems approach, using resilience theory as a new perspective (sensu Folke
The white board was also used in the second class, the topic was “Compound and Complex sentences” its objectives were to teach students how to identify. compound and complex
NH Hotel Group and the challenges of the hotel sector in Spain Economic and financial analysis of the company and its major competitor in the sector Laura Santaolalla Lorenzo
An alternative method to match inflows to outflows relies on participation of the private sector in providing liquidity to a country that is unable to meet its current commitments.10
This first analysis shows that in terms of race times and maximum velocity, the range of
The system with the highest performance on the validation data is hence an Apache Flink environment using AdaUSA with the SentiWordNet 3 lexicon as baseline for sentiment
