EXPERIMENTAL STUDY ON EFFECT OF LINING FOR FLANKING
TRANSMISSION OF BUILDING FACADE
PACS 43.55 Rg
Kei Andow, Takashi Koga,
Kajima Technical Research Institute
2-19-1 Tobitakyu, Chofu 182-0036 Tokyo, Japan. Tel:+81-424-89-7123 Fax:+81-424-89-7128
Kouichi Inadome
Technical Research Institute, Okumura Corp. 387 Oosuna, Tsukuba, 300-2612 Ibaragi, Japan Tel:+81-298-65-1827 Fax:+81-298-65-1522
ABSTRACT
Characteristics of the flanking transmission due to the difference between the areas in the source room and the receiving room are experimentally investigated. Sound insulation and vibration characteristics were measured for various surface areas of the excited and radiating elements. The result shows that the sound insulation deterioration depends on both the excited and radiating areas; that is, the effect from each element was different. Furthermore, the deterioration by the increase of surface area in receiving room was frequency dependent. This indicates the flanking pass must depend on the vibration transmission characteristics of the façade and interior wall.
INTRODUCTION
There is an increasing demand for better sound insulation in buildings. To predict sound insulation efficiencies, it is especially important to understand the role of flanking transmission.
In Europe, a model designed to estimate the airborne sound insulation between rooms in building, which includes an estimate of the flanking transmission, has been adopted as the international standard [1][2].As is written in the standard, this method is not yet applicable to all buildings; many local circumstances must be taken into account.
In Japan, construction of high-rise, multi-family dwelling is increasing. For such buildings, the façade is made of lightweight foamed concrete and the interior walls are often gypsum board. The latter is installed by the gypsum lining method on sprayed urethane foam. This construction method can cause the franking path via façade. Here, we report on our measurements of flanking transmission of such façades and additional interior wall. We focus on the effect of the surface area of the excited and radiating elements.
MEASUREMENT
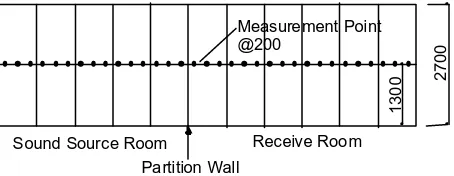
sound source room and receiving room. A section of the specimen is shown in Fig. 2. The height of the specimen is 2700 mm.
To vary the width of the specimen in sound source and receiving rooms, the double layer gypsum board was used for covering. To reduce the influence of the existence of covering on the sound field, the edge part of the covering was settled oblique and sealed.
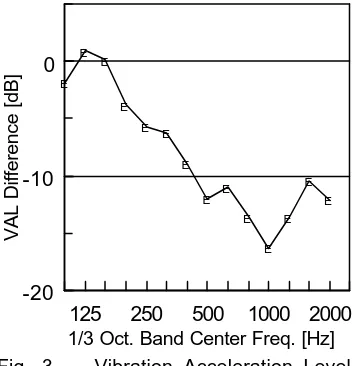
Fig. 3 shows the difference of average vibration acceleration level at the façade of sound source room before and after the entire area was covered. The effect of the covering is about 5 to 10 dB between 250 and 500 Hz octave band.
[image:2.596.94.488.255.341.2]The lengths of coverings for the sound source and receiving rooms are varied as shown in
Table 1. The sound pressure level difference and the reverberation time in the octave band are measured for each case. The sound pressure level differences are standardized using the measured reverberation time for each condition. Furthermore, the distribution of the vibration acceleration on the wall is measured for each incident condition.
RELATIONSHIP BETWEEN SOUND REDUCTIONS SURFACE AREA OF EXCITED AND RADIATING ELEMENT
Sound Insulation of the Coverings
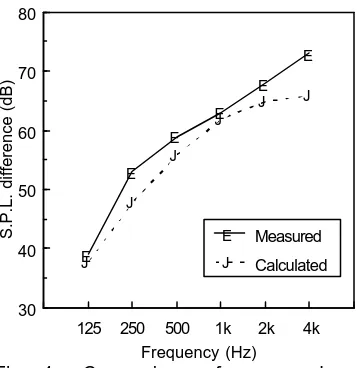
To check how coverings affect the flanking path, the sound pressure level difference was measured for the case that both excited and radiating areas are zero. Fig. 4 compares the calculated values to the measured values of level difference. The results show that the
coverings are sufficiently effective.
Differences of the effect between excited and radiating area
[image:2.596.87.318.457.623.2]An example of the measured level difference are shown in Fig. 5. A lack of the sound reduction occurs between 250 Hz band and 1 kHz band. These frequencies are consistent with the
Fig. 1. Plan of measurement laboratory.
25 100
40 9.5
100 Gypsum Board 12.5•~2(Covering) light-weight f ormed concrete
formed urethane gypsum board
gyps um board excited/ radiat ing width
[image:2.596.84.511.463.770.2]gypsum bond
Fig. 2. Section of specimen.
E E
E
E E E
E
E E E
E E
E E
125 250 500 1000 2000
-20 -10 0
VAL Difference [dB]
[image:2.596.330.507.555.738.2]1/3 Oct. Band Center Freq. [Hz] Fig. 3. Vibration Acceleration Level Difference when the facade of the sound source room had coverings. Table 1 Combination of the length of incidence and radiation area
Excited wall width (area) 0 mm
(0 m2)
455 mm (1.2 m2)
910 mm (2.5 m2)
1820 mm (4.9 m2)
0 mm (0 m2) ¡ ¡ ¡ ¡
455 mm (1.2 m2) ¡ ¡ ¡ ¡
910 mm (2.5 m2) ¡ ¡ ¡ ¡
Radiating wall width
(area)
characteristics of this construction method
(i.e., the method with additional internal gypsum board). Between 250 and 500 Hz band, the decrease of the sound reduction is obviously related with the increase of the area, although the amount of the area is limited. On the other hand, for the 1 kHz band, the amount of the increment is constant for radiating area with lengths exceeding 455 mm. This shows how the vibration transmission attenuation depends on frequency.
The differences of the sound reduction level at 250 and 500 Hz band are in Fig. 6 for the radiating area and in Fig. 7 for the excited area. The differences are normalized by the sound reduction level when both excited and radiating areas of specimen are zero. Thus, in this construction method, the effect of the excited area and the radiating area are different. For
E E
E E
E E
J J
J J
J J
125 250 500 1k 2k 4k
30 40 50 60 70 80
S.P.L. difference (dB) E Measured
J Calculated
Frequency (Hz)
Fig. 4 Comparison of measured and calculated sound pressure levels.
I I
I I
I I
E E
E E
E E
C
C C
C C
C
G
G G
G G
G
A
A A
A A
A
125 250 500 1k 2k 4k
30 40 50 60 70 80
S.P.L. difference (dB)
I 0-0
E 910-0
C 910-455
G 910-910
A 910-1820
[image:3.596.93.272.61.245.2]Frequency (Hz)
[image:3.596.306.509.66.242.2]Fig. 5 Examples of measured sound pressure level differences comparing with various combination of excited-radiating wall length.
Fig. 6 Sound reduction levels versus excited area at 250 and 500 Hz Octave Band. Ï: radiating wall length 0mm; ¡: radiating wall length 455 mm; r: radiating wall length 910 mm; o: radiating wall length 1820 mm.
Fig. 7 Sound reduction levels versus radiating area at 250 and 500 Hz Octave Band. Ï: excited wall length 0mm; ¡: excited wall length 455 mm; r: excited wall length 910 mm; o: excited wall length 1820 mm.
[image:3.596.148.444.413.545.2] [image:3.596.145.451.593.728.2]example, the case with excited and radiating length equal to 910 and 455 mm has more deterioration than the case with excited and radiating lengths equal to 455 and 910. Furthermore, the hatched area of Fig. 6 shows the differences between the sound reduction for radiating lengths 455 mm and 1820 mm, whereas Fig. 7 show this difference for excited area. The figures show that the effect for the flanking transmission from the area in sound source room is larger than the area in receiving room.
MEASUREMENT OF VIBRATION CHARACTERISTICS OF WALL SURFACES
The vibration characteristics of the wall surfaces of external layers and additional internal layers are measured to better understand the relationship between vibration characteristics of the wall surfaces and the sound pressure level of the receiving room.
We measured the attenuation characteristics of the vibration acceleration level on façade and additional lining wall. The measurement point of vibration acceleration level for a lightweight foamed concrete façade with a 200-mm pitch at height 1300 mm is shown in Fig. 8. For the case on additional gypsum board lining, the measurement point is set on and between the gypsum bond as shown in Fig. 9. The average of the vibration acceleration level for 30 second in 1/3 octave band is measured. Pink noise was used for sound source. Fig. 10 shows the block diagram of the equipment.
In this section, vibration measurements of one-third octave bands at 250 Hz and 500 Hz are shown.
External layers
The measured decay of the attenuation of the vibration acceleration level on the external layer versus distance is shown in Fig. 11, in which the area of specimen in sound source room is varied from 0 mm to 1820 mm. The vibration acceleration levels increase due to the increment of the excited area. The level in the sound-exposed region significantly rises above that for the covered portion of source room, particularly for the 500 Hz band. Though of 250 Hz band, this trend is not clear because there is little effect from the cover near 5 dB, as shown in Fig. 4, and the vibration attenuation is less than that at higher frequencies.
At the layers for the receiving room, the vibration acceleration level decays linearly with the distance from the joint. The decay becomes steeper at higher frequency. Furthermore, there is
2
7
0
0
1
3
0
0
Sound Source Room Receive Room
Partition Wall
[image:4.596.83.310.479.567.2]Measurement Point @200
Fig. 8. Elevation view of measurement point array for vibration acceleration measurement on facade
wall surface. Fig. 10. Block diagram.
significant level difference at the joint that seems to be caused by the attenuation to the partition wall and the restraint by existence of the partition wall.
Additional internal layers
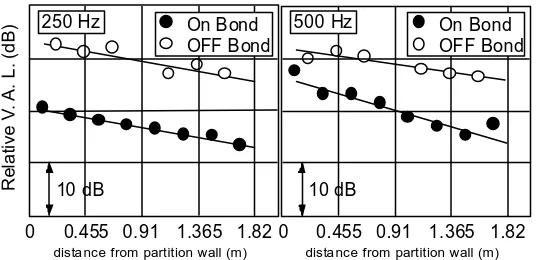
The vibration acceleration level of the additional internal layers for the receiving room also decays linearly as shown in Fig. 12, although the levels on the gypsum bond and off the gypsum bond differ 5 to 10 dB. Compared with the results of on and off the bond, the decays for 250 Hz band are almost same, but decays of 500 Hz band are differ. This discrepancy is likely caused by the resonance frequency between the façade and the additional internal layers in 500 Hz band.
Compared to the results on the external layers, the decays of the internal layers on and off bond in 250 Hz band and that of on bond in 500 Hz band reasonably agrees.
DISCUSSIONS
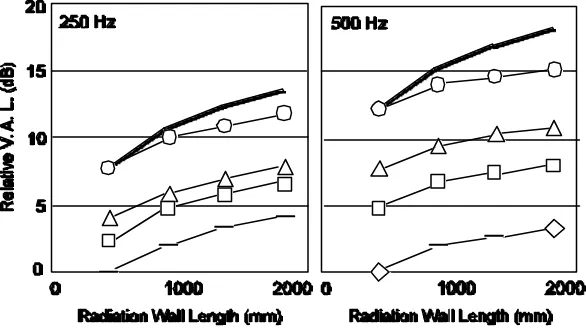
We discuss here the relationship between the vibration power level of the internal wall and sound pressure level of receiving room. Fig. 13 shows the relative vibration power level calculated from the average vibration acceleration level for each measurement case and each radiating area. The reference level is that for an excited length is 0 mm and radiating length is 455mm. The increment of the surface area level in the receiving room (10log(sj)) is also plotted in the figure. The increase of the vibration power level is less than that of the radiating area level. This means that the power level near the partition is relatively larger. It is comparable to the vibration characteristics of the additional internal layers. Hence, in case of such a construction, the vibration transmission attenuation of the wall should be taken into account for the evaluation of flanking transmission.
Furthermore, the increase of surface area in the sound source room also causes the vibration power level of the internal wall to increase. The augmented quantities are fairly constant and less than that of the receiving room. This indicates that the effect of areas of excited and
5 4 3 2 1 1 2 3 4 5 6 10 dB
Sound Source Room Receiving Room 1800 mm
Partition Wall
5 4 3 2 1 1 2 3 4 5 6 10 dB
Sound Source Room Receiving Room 1800 mm
[image:5.596.80.507.417.547.2]Partition Wall
Fig. 11. Vibration acceleration level on façade versus distance from the partition wall.Ï: excited wall length 0mm; ¡: excited wall length 455 mm; r: excited wall length 910 mm; o: excited wall length 1820 mm.
On Bond OFF Bond
10 dB
250 Hz On Bond
OFF Bond
10 dB 500 Hz
0 0.455 0.91 1.365 1.82
dista nce from partition wall (m)
0 0.455 0.91 1.365 1.82
dista nce from partition wall (m)
R
e
la
ti
v
e
V
.
A
.
L
.
(d
B
)
Fig. 12. Vibration acceleration level on additional internal layer versus distance from the partition wall.
250 Hz 500 Hz
Relative V.
A.
L.
[image:5.596.163.431.598.728.2]radiating elements should be separately considered.
Compared to the increase of the vibration power level and of the sound pressure level shown in Fig. 7, the effects on the areas of the excited and radiating elements are reasonably agrees.
CONCLUSION
We measured the sound insulation and vibration characteristics of a flanking path for various excited and radiating areas. In some cases, the effect of the excited and radiating areas differed from each other. In such cases, the attenuation of vibration on the walls should be included when calculating the flanking transmission.
ACKNOWLEDGEMENT
This work was carried out as a part of the joint research program of Technical Research Institute of Okumura Corp. and Kajima Technical Research Institute.
REFERENCES
[1] EN 12354-1: 2000, Building Acoustics – Estimation of acoustic performance of buildings from the performance of elements – Part 1: Airborne sound insulation between rooms.
[image:6.596.152.445.82.246.2][2] Gerretsen, E., “Calculation of sound transmission between dwellings by partitions and flanking structures”, Applied Acoustics 12 (1979), 413-433.