The Impact of Social Networks on
Innovation: The Case of European Regions
Authors: Alfonso Badiola-Sánchez, University of Cantabria, Santander, Spain, [email protected]; Pedro Casares-Hontañón, University of Cantabria, Santander, Spain, [email protected]; Pablo De Castro, University of Cantabria, Santander, Spain, [email protected]; Pablo Coto-Millán, University of Cantabria , Santander, Spain, [email protected]; Miguel Ángel Pesquera, University of Cantabria, Santander, Spain, [email protected]
This research analyses the relationship between the use of social networks and the generation of innovations in European regions through a production function of innovations using human capital, technological capital and virtual relational capital with the new theoretical approach. For this, it is estimated an econometric model of panel data for the period 2007-2011 and 190 European regions.
Keywords: Social Networks, Innovation, Production Function, European
Region
Introduction
Social networking allows people to be interconnected and connected by chain links. In this way we can get an idea of the magnitude of diffusion that causes the emission of messages in social networks and the importance of these for the communication of ideas and knowledge. To get a better idea of its relevance, the currently most popular words in Google are Facebook and
Twitter, and 22% of internet usage time is precisely social networks. This research analyzes the new theoretical approach by Badiola et al. (2012).
As an indicator of innovation, it is used the variable number of patents, as these that ensure originality and a high probability of becoming innovations, besides being easily quantifiable and comparable across countries. Using the database of cross sections with hundred ninety regions merged temporarily with data for the period 2007-2011 from the European regions, it is estimated an econometric model of panel data.
Data and Variables
Most of the data used in this research were obtained from the latest report RIS (Regional Innovation Scoreboard), published by the European Commission (2012), with innovation data of 190 European regions for the years 2007-2011.
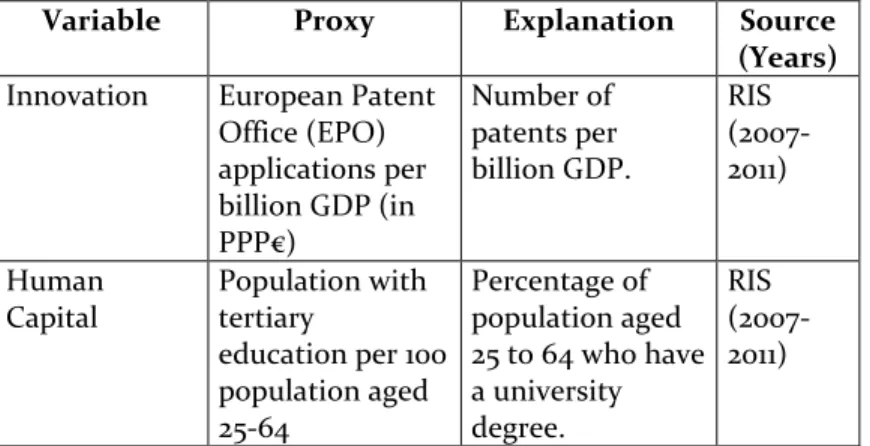
Of the indicators included in this report, we used the dependent variable, innovation, and the explanatory variables human capital and technological capital taken from the theory of economic growth and physical relational capital given the richness of the interaction of the agents (Schweitzer, F. 2009). Moreover, it has added another explanatory variable, which we call the variable virtual relational capital, which has been built by analyzing the records of Google as in the article by Preis (2012), from the Google Trends tool. Table 1 describes the variables used.
Table 1: Description of the variables
Variable Proxy Explanation Source (Years) Innovation European Patent
Office (EPO) applications per billion GDP (in PPP€) Number of patents per billion GDP. RIS (2007-2011) Human
Capital Population with tertiary education per 100 population aged 25-64 Percentage of population aged 25 to 64 who have a university degree. RIS (2007-2011)
Technological
Capital Public R&D expenditures (% of GDP) Public investment in R & D as a percentage of GDP. RIS (2007-2011) Business R&D expenditures (% of GDP) Private investment in R & D as a percentage of GDP. RIS (2007-2011) Virtual Relational Capital Number of searches on Google for the word Facebook. Number of users of social networks. Google Trends (2007-2011) Number of searches on Google for the word Twitter. Number of users of social networks. RIS (2007-2011) Source: Own elaboration
Results
Five models have been estimated based on a semi-logarithmic approximations innovation production function for European regions; its results are shown in Table 2. That semi-logarithmic function is linearized as shown in equation (1).
LogEPO LogA
=
+
α
LogCH
+
β
LogCT
+
γ
F
+
δ
T
(1)The parameters
α
andβ
are, respectively, the elasticities between human and technological capital and the innovatiσn. On the other hand, parametersγ
andδ
are semielasticidades between variables associated with the number of users of social networks and innovation. It is estimated a semilog equation because the data obtained from Google tool are reparametrized between zero and one hundred, so that now represent percentage changes.First it is estimated a model in which innovation is explained using traditional production factors, such as human capital and technological capital:
0 1 2
&
3sin
&
it it it it it
LogI
=
β
+
β
LogCH
+
β
LogPublicR
D
+
β
LogBu
essR
D
+
u
(2)
It is obtained that the human capital measured by tertiary education and the public technological capital measured as public spending on R & D are individually significant variables in the production function. But, instead, the private spending is not significant. However, the variables are significant jointly. If it is included the users of social network Facebook, in model 2, it is obtained that are not individually significant.
0 1 2 3 & 4 sin &
it it it it it it
LogI =β +βFacebook +β LogCH +βLogPublicR D +β LogBu essR D +u
(3)
This is due to the existence of positive correlation between the human capital indicator and the users of social networks, especially in the case of Twitter, which is why this traditional production factor should be eliminated to assess the individual effect of social networks on innovation. Thus, in Model 3 we find that both Facebook and Twitter, as well as the public-private investment in research and development are explaining the generation of patents in the regions of our old Europe, since all variables are positive and significant individually and together, as shown in the test statistics. If, on the other hand, it is explained the logarithm of innovation through the variables associated with social networks, such as equation (4):
0 1 2 3
&
it it it it it
LogI
=
β
+
β
+
β
+
β
LogPublicR
D
+
u
(4)
With this model is tested empirically the positive contribution of the exchange of ideas and information through virtual social relationships that occur within social networks, as a productive factor in European innovation. But not enough and it would also be advisable to compare the individual effect of Facebook and Twitter. So finally, in models 4 and 5 - equations (5) and (6) respectively - explains the mechanism of generation of innovation in European regions in the current period of crisis through private and public R & D capital and users of the two social networks.
0 1 2
&
3sin
&
it it it it it
LogI
=
β β
+
+
β
LogPublicR
D
+
β
LogBu
essR
D
+
u
(5)
0 1 2
&
3sin
&
it it it it it
LogI
= +
β β
+
β
LogPublicR
D
+
β
LogBu
essR
D
+
u
(6)
The last two columns of Table 2 show the estimates of models four and five. The variables are significant individually and jointly. The estimated parameters are positive and show the positive contribution separately from each of the social networks. These models explain econometrically the contribution of both Facebook and Twitter to generate innovations in European regions.
Table 2: Results of the model Dependent
variable: Log (EPO)
Model 1 Model 2 Model 3 Model 4 Model 5
Variable Coefficient Coefficient Coefficient Coefficient Coefficient
Log(PublicR&D) 0,068 ** (0,027) 0,071 ** (0,034) 0,096 *** (0,033) 0,109 *** (0,033) 0,101 *** (0,033) Log(BusinessR&D) 0,018 (0,023) 0,069 * (0,038) (0,038) 0,072 * 0,089 ** (0,038) 0,082 *** (0,038) Log (TerciaryEd) 0,280 *** (0,054) 0,320 *** (0,091) ________ ________ ________ Facebook ________ 0,00041 (0,00025) 0,00063 *** (0,00024) ________ 0,00084 *** (0,00022) Twitter ________ ________ 0,00040 *** (0,00015) 0,00054 *** (0,00014) ________ Adjusted R2 0,964 0,965 0,9652 0,9647 0,9720 F-statistic 134,13 135,60 133,56 132,74 132,89 Akaike information criterion -1657,2 -738,08 -731,05 -724,29 -724,79
Source: Own elaboration
Conclusions
It has contrasted the effect and weight of traditional production factors, human capital, and technological innovative mechanism of European regions and the expected results are obtained. Furthermore, it has included as explanatory variables in the production of innovation two variables constructed from Google Trends as the number of times are keyed the words Facebook and Twitter in each European region. It has been empirically tested - specifically using a fixed effects estimator - the number of times you type the words Facebook and Twitter, are positively correlated with innovative production. It can be an indicator that the exchange of knowledge through virtual relationships with Facebook and Twitter is not only a play for free time but also serves as an engine generator and diffuser innovation. All elasticities and semielasticities obtained with these explanatory variables are positive but inelastic, ie percentage increases in the explanatory variables produced varies positively on innovation but in an amount less than the inputs.
Finally, we conclude that collaborative relationships based on exchanges of knowledge measured by the number of users of social networks contribute to the generation of innovation. Thus, communication tools based on Web 2.0 and user interaction through social networks, favors the creation of patents, indicator generally used in the scientific literature to measure innovation.
As the innovation is a source of development and the number of users of social networks Facebook and Twitter are explanatory variables with positive parameters on the generation of innovations; it is recommended to think social networks not only as leisure activities, but as something that contributing positively to regional development. That is, we should not demonize the use of social media understanding them as a waste of productive time, but that businesses should be aware that they can bring something positive to the management of knowledge in today's society, constituting an input in the regional mechanism of innovation.
[1] Badiola-Sánchez, A., Casares-Hontañón, P., Coto-Millán, Pablo y Pesquera, M.A. Networks and Innovation: An Economic Model for
European Regions (2002-2006). Journal of Knowledge Management,
Economics and Information Technology; 2(5):195-207, 2012. [2] European Commission (2012): Regional Innovation Scoreboard
http://ec.europa.eu/enterprise/policies/innovation/files/ris-2012_en.pdf
[3] Schweitzer, F. : Economic Networks: The New Challenges. Science 325, 422, 2009.
[4] Preis, T.: Quantifying the Advantage of Looking Forward. Scientific Reports 2:350, 2012.