Enhancement of the crystallization of Tb
xFei_
xthin films
upon the formation of oc-Tb phase
R. Ranchal
a'*, E. López
a, J.L. Prieto
b, C. Aroca
ba Dpto Física de Materiales, Facultad CC. Físicas, Universidad Complutense de Madrid, Ciudad Universitaria sin, Madrid 28040, Spain
ISOM & Dpto Física Aplicada, ETSI Telecomunicación, Universidad Politécnica de Madrid, Ciudad Universitaria sin, Madrid 28040, Spain
Abstract
TbxFei_x thin films deposited by sputtering on Mo were investigated structurally and magnetically. The microstructure consists of TbFe2 nanoparticles embedded in an amorphous matrix, and the Tb content can be correlated with an increase in the volume of these nanoparticles. Similar microstructure and behavior were found when TbFe2 was deposited on glass and on a Pt buffer layer. Neverthe-less, thermal treatments promote a different effect, depending on the mechanical stiffness of the buffer layer. The layers deposited on Mo, a rigid material, show crystalline TbFe2 together with cx-Tb phase upon thermal treatment. In contrast, TbFe2 does not crystallize prop-erly on Pt, a material with a lower stiffness than Mo. Intermediate results were observed on the film deposited on glass. Experimental results show the impact of the buffer stiffness on the crystallization process. Moreover, the formation of cx-Tb appears to be fundamental to crystallized TbFe2 on layers deposited on rigid buffers.
Keywords: Laves phase; Magnetostriction; Sputtering; Nanoparticles; Crystallization
1. Introduction
Crystalline TbFe2 is the material with the highest magnetostriction at room temperature [1]. Layers depos-ited at room temperature by sputtering usually present an amorphous state which exhibits interesting properties, such as perpendicular magnetic anisotropy [2-8]. However, the inherent low reproducibility of this amorphous phase might be the reason behind the controversy about the phys-ical origin of this anisotropy. As the magnetic properties do not appear to be completely reproducible in the amorphous state, investigations were focused on the crystalline TbFe2 ordering, the one with potentially more magnetostriction. The crystalline Laves phase can be achieved either by means of post-growth annealing [9-14] or by heating the substrate during deposition [15,16]. The crystallization pro-cess on films deposited at temperature may depend not
only on the temperature, but also on other parameters such as the gas pressure or the power during deposition. There-fore, it was decided to investigate this crystallization pro-cess on post-growth annealing. In a previous work, the effect of annealing on sputtered TbFe2 thin films deposited at room temperature on different buffers and substrates was analyzed [14]. That investigation showed that the buffer layer has a stronger effect on the crystallization process than the substrate does, despite the former being much thinner. The experimental results could be understood by taking into account the stiffness of the buffer layer. Materi-als with a high Yla parameter, where Y is Young's modu-lus, and a is the thermal expansion coefficient, seem to improve the crystallization process of TbFe2 thin films.
nanoparti-cíes embedded in an amorphous matrix was found. Although the actual annealing temperature has little influ-ence (within a range), high-quality TbFe2 is better achieved by annealing samples deposited on a Mo buffer layer. The experimental results confirm the strong impact of the buffer stiffness on the crystallization process. Moreover, the for-mation of oc-Tb appears to be pivotal to achieving crystal-line TbFe2 on layers deposited on rigid buffers.
2. Experimental techniques
TbxFei_x films were grown by a DC magnetron sputter-ing system at room temperature on Si substrates. Deposition was carried out from a single TbFe2 commercial target in oblique incidence with an angle between the vapor beam and the perpendicular to the sample of ^25°. Different Ar pressures and DC power were used in order to achieve sam-ples with slightly different compositions. Ar pressures ranged between 2 x 10~3 and 4 x 10~3mbar, whereas the deposi-tion power ranged between 60 and 120 W. The thickness of the TbxFei _x layers was 200 nm in all the samples. Mo buffer and capping layers were sputtered with power 90 W and Ar pressure 2 x 10~3 mbar, in order to avoid oxidation and pro-mote crystallization [14]. Both, buffer and capping were 20 nm thick. Pt buffers, 20 nm thick, were also used for fur-ther investigations. Thermal treatments were mostly carried out at 400 °C in Ar atmosphere for 1 h. Additional annealing in the temperature range 300-500 °C was also performed for comparison. Energy dispersive X-ray spectroscopy was used to infer the sample composition. 9-29 high-angle X-ray dif-fractometry was used to analyze the structural properties, while the magnetic characteristics were determined by means of a vibrating sample magnetometer at room temperature with the applied magnetic field parallel and perpendicular to the sample plane. The temperature dependence of the magnetization was characterized by means of SQUID mag-netometry. Prior to measuring the temperature dependence of the magnetization, the sample was first cooled from room temperature to 5 K either under a saturation field of 2 kOe (field-cooled, FC) or at zero field (zero-field-cooled, ZFC). Then, FC and ZFC curves were recorded with an applied magnetic field of 100 Oe during the warm-up. Magnetization curves at 10 K were also recorded using SQUID.
3. Experimental results
3.1. As-grown TbxFe¡_x films deposited on Mo buffers
The as-grown samples show a small TbFe2 diffraction peak (Fig. la), which rules out a complete amorphous struc-ture in the studied samples. The intensity of this peak increases as the Tb content reaches 33%, i.e. TbFe2 compo-sition. Therefore, the X-ray diffraction (XRD) patterns show an improvement in the structural characteristics of the TbxFei_x films as the Tb content reaches the Laves phase. A wide peak centered around 29 — 32°, which is related to the presence of an amorphous compound, is also observed.
-15 -10 -5 0 5 H (kOe)
10 15
-ZOO
•15 -10 -5 0 H (kOe)
10 15
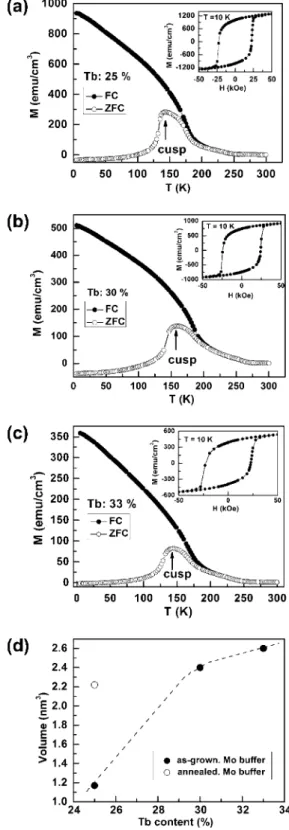
Fig. 1. (a) XRD patterns of TbxF&l_x films with different Tb content. The Tb content is displayed on every curve. Curves are vertically shifted for clarity, (b and c) Room temperature magnetization curves of as-grown samples recorded with the applied magnetic field in the sample plane (O) and perpendicular to the sample plane ( • ) for samples with different Tb contents: (b) 25%; (c) 30%.
absence of the perpendicular anisotropy might be related to the different micro structure of the layers studied in compar-ison with those of previous work where only an amorphous ordering was present in the TbFe2 thin films [2-8].
Both, the in-plane and out-of-plane magnetization curves at room temperature exhibit a high saturation field and low coercivity, resembling the magnetic behavior of superpara-magnets (Fig. lb and c). This superparamagnetism could come from ferromagnetic TbFe2 crystalline nanoparticles within the amorphous matrix, which could also justify the TbFe2 peak in the X-ray measurements. This possibility was investigated through the dependence of the magnetiza-tion on temperature. Fig. 2a-c shows the FC and ZFC curves for as-grown layers with different Tb contents. The cusp in the ZFC curve is the so-called blocking temperature (7B), and its presence reveals the existence of nanoclusters in all these samples deposited with a Mo buffer (Fig. 2a-c). The
TB can be used to determine the size of the nanoaggregates,
taking into account the expression kV=kBTB, where K is
the anisotropy constant, Fis the crystallite volume, and kB
is the Boltzmann constant: 1.38 x 10~16 erg K1. The anisotropy is inferred using the expression K = {¡JLQH^M^I 2, where H^ is the anisotropy field, i.e. the field necessary to saturate the hysteresis loop, and Ms is the saturation mag-netization. Considering Ms, H^ and TB for every sample, a
correlation is obtained between the composition and the vol-ume of the nanoaggregates (Fig. 2d). As the composition gets closer to TbFe2 (i.e. 33% Tb), the volume of the nanoaggre-gates increases, a fact that is also visible in the X-ray mea-surements (an increase in the intensity of the TbFe2 diffraction peak as the Tb content reached 33%). The hyster-esis loops recorded at 10 K (insets to Fig. 2a-c) show a decrease in the magnetic moment as the Tb content increases. In order to calculate the value of Ms, ms was divided by the
total volume of the sample. Note that there is an uncertainty in the partial volume of TbFe2 within the whole film, and therefore the calculated Ms should be lower than the real Ms for TbF2. The calculated Ms for the sample with 33% is close to the TbFe2 value (800 emu cm- 3), but for samples with a lower Tb content, higher Ms values are obtained than the bulk value for TbFe2. This indicates that the amorphous TbFe matrix which contains the TbFe2 nanoparticles is also contributing to the magnetic moment, as there is no sign of Fe or Tb isolated particles in the X-ray measurements. Finally, it is pointed out that this micro structure consisting of nanoaggregates embedded in an amorphous matrix was not reported in those previous works studying perpendicular magnetic anisotropy in amorphous Tb-Fe films [2-8]. There-fore, the different micro structure might be the reason behind the absence of out-of-plane magnetic anisotropy in the pres-ent samples.
3.2. Annealed TbxFe1_x films deposited on Mo buffers
Fig. 3a shows the X-ray diffractometry of the samples annealed at 400 °C. Diffraction patterns reveal that the ther-mal treatment promotes not only the crystallization of the
0 50 100 150 200 250 300 T ( K )
150 200 T ( K )
100 150 200 T ( K )
300
( d ) 2.6
2.4
^ 2 . 2
*E 2.0 c ^Tl.8
E = 1.6 o > 1 . 4
1.2 1.0
-;
-o
V
1 1 1
- - ' " ' • ' '
'*'' /
/
• as-grown. Mo buffer O annealed. Mo buffer
1 i 1 i 1 i 24 26 28 30
Tb content (%)
32 34
Fig. 2. FC ( • ) and ZFC (O) curves for TbxFei_x films with different Tb
content: (a) 25%; (b) 30%; (c) 33%. In the inset of every graph is displayed the hysteresis loop of every sample recorded at 10 K. (d) Volume of nanoaggregates as a function of Tb content: ( • ) as-grown samples deposited on Mo buffers; (O) annealed samples deposited on Mo buffers.
(b)
« 10
J2 i-*^
c
CD
*-<
c
102
10'
Tb
(ipi) Tb
(102) Tb ' Tb (002)|TbFe, (100k
Tb
(103)
Mo Tb (112) Tb (002) TbFeJ ^ (112) (203)
\
I
T
i201)
Tb (211)
Tb (203)
20 40 20 ft 60
80
Fig. 3. (a) XRD patterns of TbxFei_x layers with different Tb content
annealed at 400 °C. Only the TbFe2 diffraction peaks are labeled. The Tb
content is displayed in every curve, and they have been shifted for clarity, (b) XRD patterns of a TbxFei_x layer with a Tb content of 25% annealed
at 400 °C. In this graph, all the peaks are labeled.
are clearly reduced for the stoichiometric content, i.e. 33% Tb.
The magnetic characterization shows that, for the annealed samples, the ZFC cusp is shifted to higher tem-peratures compared with the as-grown samples, and it eventually becomes a kink for a Tb content of 33% (Fig. 4a and b). The presence of a kink instead of a cusp in the ZFC curve indicates that the nanoaggregates have increased their volume, having almost disappeared upon thermal treatment. The increase in size for the TbFe2 nano-aggregates means a decrease in volume in the amorphous matrix. Thus, the TbFe2 sample could exhibit fewer a-Tb diffraction peaks than the rest of the samples because of the smaller volume of its annealed matrix. The FC and ZFC curves for the stoichiometric annealed sample show the presence of two different magnetic phases (Fig. 4a). The first has a Curie temperature (7c) well above room temperature, as indicated by the large distance between the FC and ZFC curves at 300 K, and is quite likely to be crystallized TbFe2 with a theoretical Tc of 700 K. This
high Tc phase cannot be pure segregated Fe, as it does not
show in the XRD patterns. The second magnetic phase that appears in the FC-ZFC curves has an ordering tempera-ture - 2 4 0 K, very close to the Tc of the Tb (219 K). This
is quite likely to be Tb with Fe impurities that might slightly increase its magnetic interaction.
Annealed samples with Tb contents <33% still show a cusp in the ZFC curves, and therefore the TbFe2
nanoag-Ordering temperature
Tb: 33 % J i I i I 50 100 150 200 250 300
T ( K )
50 100 150 200 250 300 T ( K )
Fig. 4. FC and ZFC curves of an annealed TbxFe!_x layer with a Tb
content of (a) 33% and (b) 25%. Insets: detail of ZFC curve.
gregates are still present. Similarly to the sample with 33% Tb, the FC-ZFC curves reveal a magnetic phase with
Tc > 300 K, which corresponds to the crystallized TbFe2
phase (Fig. 4b). Therefore, the thermal treatment has pro-moted crystallization in the samples with deficient Tb con-tent, but the presence of nanoaggregates reveals that this crystallization is incomplete.
The influence of the temperature on the crystallization process was analyzed by performing thermal treatments in the temperature range 300-500 °C. There are diffraction peaks related to Tb for annealing temperatures as low as 300 °C (Fig. 5a), and no change was observed in the diffrac-tion patterns as the annealing temperature increased. In agreement with the structural characterization, the shape of the hysteresis loops does not change with annealing tem-perature either (Fig. 5b). Therefore the annealing tempera-ture is not a determining parameter for the formation of the a-Tb phase in TbxFei_x thin films.
3.3. TbFe2 films deposited on glass substrates and on Pt
buffers
50 100 150 200 250 300 T(K)
(b)
300r 150 E o
1 •
E - 1 5 0
- 3 0 0 ugP^!Lpü¿
i
L
J r # * ^ A
g^P
I
if
j j E ^ A
f
—
SKfe*
300° C
-400° C
450° C
500° C
-15 -10 -5 0 5
H (kOe)
10 15
Fig. 5. (a) XRD pattern of a sample annealed at 300 °C and 500 °C. (b) Room temperature magnetization curves of TbFe films annealed at different temperatures: 300 °C (•); 400 °C ( • ) ; 450 °C (•); 500 °C (D).
(a)
350 300250
E 200
| 150
<D — 100
50
0 02K
as -grown ¿ ^ ó \\
J
V
I . I , I . I
- • - F C - o - Z F C
. i , i I
50 100 150 200
T(K)
250 300
(b)
300 250¿~* 200
E
o
D 150
(J) — 100
50
0 I
-imm
annealed
-A-FC
- A - ZFC
r/mm¡7ffffwp7rm/,
' W
-Si-^ S 4
^ W
- ZFC-curve \m&\
i . i , il
1 0 0 2 0 0 3 0 0 V T (K)
m ü g W p ^ P rmmmmrmmwmmiA I
50 100 150 200 250 300
T(K)
Fig. 6. FC and ZFC curves of a TbFe2 thin film directly deposited on a
glass substrate: (a) as-grown; (b) annealed at 400 °C.
on Mo. Moreover, the volume of the nanoaggregates is ~2.4 nm3, almost equal to the value achieved for Mo. The annealed sample on glass also shows a ferromagnetic phase with Tc higher than room temperature, similar to
Fig. 7. FC and ZFC curves of a TbFe2 thin film deposited on a 20 nm
thick Pt buffer: (a) as-grown; (b) annealed at 400 °C. Insets: hysteresis loops at 10 K of (a) as-grown and (b) annealed samples.
the behavior observed in the layer on Mo (Fig. 6b). Never-theless, the crystallization process is different for these sam-ples. Whereas the ZFC cusp disappears in the annealed layer on Mo, the film deposited on glass still exhibits a ZFC cusp. A volume close to 10 nm3 for the nanoaggre-gates left after the thermal treatment is inferred (Fig. 6b). Nevertheless, it is worth remarking on the relatively small ZFC cusp in the layer on glass, an indication of the almost complete crystallization process.
The magnetic characterization of the as-grown sample deposited on Pt shows a cusp in the ZFC curve (Fig. 7a), revealing the presence of nanoaggregates, as in the previous samples. The volume of the nanoaggregates (~3.5 nm3) in the film grown on Pt is slightly higher than that obtained in samples with the same Tb content but deposited on Mo and glass. Moreover, the annealed sample deposited on Pt does not show the ZFC cusp, indicating the absence of nano-aggregates upon thermal treatment at 400 °C (Fig. 7b). Nev-ertheless, the FC-ZFC graph of this annealed layer is completely different from the others. First, a magnetic phase with an extremely low Tc of 70 K is present in the sample
films grown on Mo. XRD patterns of the sample deposited on Pt have already been shown in previous work [14], and they show low structural quality. No clear diffraction peaks related to either TbFe2 or a-Tb phase are present in those diffraction patterns.
4. Discussion
The crystallization of an amorphous material has two steps: (i) the formation of nucleation points (seeds); and (ii) their growth [18]. All the as-grown TbxFei_x films stud-ied in this work exhibit the presence of nanoaggregates, whose volume depends on the Tb content of the sample, and it is optimum for a Tb content of 33%. However, despite the presence of nanoaggregates in all the samples, those deposited on Mo crystallize better than those depos-ited on glass or Pt, even if they have very similar character-istics before annealing. The present authors believe that the influence of the buffer layer on the crystallization of the TbFe2 could be related to the stiffness of this buffer layer, as explained below. Previous work reported a qualitative estimation of the influence of the mechanical characteristics of the buffer layer on the magnetic and magneto-elastic properties of annealed TbFe2 layers [14]. That work intro-duced a new mechanical parameter to take into account the substrate stiffness during thermal treatment: Yla (see Sec-tion 1 of the present paper), which gets a higher value for "stiff" materials. It is remarked that that work ruled out other possible reasons such as the crystalline structure of the buffer or the substrate itself, and the only correlating parameter was the Yla of the buffer material. In general, the volume of a material decreases during the transition from amorphous to crystalline [18]. Since the TbxFei_x films were deposited on a 20 nm thick Mo buffer layer, the extremely high Yla factor of Mo (71 x 106 GPa K [14]) prevents, to a certain degree, a drastic volume change in the TbFe film during thermal treatment. Any crystalline phase that appears upon annealing will tend to minimize a volume change or the mechanical tensions induced. For instance, the crystallization of Tb is more likely than that of body-centered cubic (bcc) Fe, as the latter has a small lattice parameter (2.8664 A),1 and its nucleation would generate too much mechanical tension in the TbFe matrix. Therefore, when using a rigid buffer layer such as Mo, phases like Tb or TbFe2 must be less costly energetically (less mechanical stress induced around), as their lattice parameters are larger, and the volume change in the tran-sition from amorphous to crystalline must be smaller. In any case, when the TbFe2 nanoaggregates grow in size dur-ing annealdur-ing, the system will try to compensate the change in volume somehow. This is done through the formation of a highly polycrystalline a-Tb phase: the amorphous TbFe phase segregates Tb during the thermal treatment to form
' L a t t i c e p a r a m e t e r s : M o , a = 4 = c = 3 . 1 5 Á ; T b F e2, a = b = c = 734WA; Tb-a, a = b = 3.5990Á, c = 5.6960 Á; Fe (bcc), a = 6 = c = 2.8664Á.
the polycrystalline a-Tb phase, which is so obvious in the X-ray measurements, accommodating mechanical tensions in the structure. Of course, this process is more obvious in samples with more Tb, and that is why they crystallize bet-ter. Buschow and Dirks [19] already reported the presence of a-Tb in annealed TbFe2 samples prepared by melt spin-ning. Therefore, the formation of a-Tb seems to play an important role in the crystallization of TbFe2.
For the samples deposited on Pt, the picture is different. The low Yla factor of the Pt (19 x 106 GPa K) allows a big-ger volume change in the sample during annealing, and then the formation of TbFe2 or a-Tb phase is not pro-moted so much. Therefore, although the TbFe2 nanoaggre-gates are also present in the as-grown sample, they disappear upon thermal treatment. Moreover, in spite of the absence of nanoaggregates in the annealed sample, the magnetic characteristics are relatively low. Therefore, the experimental results point to close correlation between the formation of a-Tb and the proper crystallization of TbFe2. A rigid buffer might enhance the segregation of Tb, promoting a better crystallization process. Glass has a Yja factor of 45 x 106 GPa K, a value between those for Mo and Pt. The layer deposited on glass exhibits a fer-romagnetic phase with a high Tc (TbFe2), as indicated by the large distance between the FC and ZFC curves, although nanoaggregates with a volume close to 10 nm3 are still present. Thus, the layer deposited on glass exhibits an intermediate crystallization process, in agreement with its intermediate mechanical stiffness in comparison with Mo and Pt. Degradation through interdiffusion does not appear to play an important role in the crystallization pro-cess. The film on glass crystallizes better than the layer deposited on Pt, although the oxidation process might potentially be enhanced in the former film.
5. Conclusion
Structural and magnetic investigations showed a phase separation of TbxFei_x films deposited by sputtering on Mo. The experimental results indicate the presence of TbFe2 nanoparticles embedded in an amorphous matrix, and their volume depends on the Tb content. A similar microstructure is achieved in layers deposited on glass and on Pt buffers. Nevertheless, thermal treatments only promote optimum crystallization of the layers deposited on Mo. Those samples present not only the crystalline TbFe2, but also a polycrystal-line a-Tb phase. The large mechanical stiffness of Mo seems to play an important role, preventing volume change during annealing and therefore promoting phases with high lattice parameters, i.e. TbFe2 and a-Tb. Experiments indicate that the formation of the Tb phase could be crucial for the crys-tallization process of TbFe2.
Acknowledgements
NAN and MAT2007-65965-C02. Universidad Complu-tense de Madrid (UCM) also partially supported this work through the "Consolidación de Grupos" program. The authors thank "CAI Difracción de rayos-X" of UCM for the X-ray diffractometry measurements and "CAI Técnicas Físicas" also of UCM for SQUID characterization.
References
[1] Clark AE, Belson HS. Phys Rev B 1972;5:3642.
[2] Lim SH, Choi YS, Han SH, Kim HJ, Shima T, Fujimori H. IEEE Trans Magn 1997;33:3940.
[3] Hellman F, Shapiro AL, Abarra EN, Robinson RA, Hjelm RP, Seeger PA, et al. Phys Rev B 1999;59:11408.
[4] Huang J, Prados C, Evetts JE, Hernando A. Phys Rev B 1995;51:297. [5] Harris VG, Aylesworth KD, Das BN, Elam WT, Koon NC. Phys
Rev Lett 1992;69:1939.
[6] Hellman F, Gyorgy EM. Phys Rev Lett 1992;68:1391.
[7] Hufnaget TC, Hellman F. J Magn Magn Mater 2003;256:322. [8] Jiang HC, Zhang WL, Zhang WX, Peng B. Physica B 2010;405:834. [9] Clark AE. Appl Phys Lett 1973;23:642.
[10] Wakiwaka H, Yamada Y, Watanabe T, Umemoto Y, Kiyomiya T, Makimura M. Int J Appl Electromagn Mech 2001;14:435.
[11] Innoue M, Fujii T, Gibb MRJ. IEEE Trans Magn 1996;32:4758. [12] Zhang WL, Jiang HC, Zhang JP, Zhang WX. J Magn Magn Mater
2004;284:128.
[13] Jiang H, Zhang W, Zhang W, Yang S, Zang H. J Mater Sci Technol 2005:21,315.
[14] Ranchal R, Prieto JL, Sánchez P, Aroca C. J Appl Phys 2010;107:113918.
[15] Wang CT, Osgood III RM, White RL, Clemens BM. Mater Res Soc Symp Proc 1995;384:79.
[16] Wang CT, Clemens BM, White RL. IEEE Trans Magn 1996;32:4752. [17] Muramatsu K, Yamaki TO, Matsuoka N, Takeuchi M, Matsumura
Y, Uchida H. J Alloys Compd 2006;408:335.