UNIVERSIDAD ANDRÉS BELLO FACULTAD DE EDUCACIÓN
PEDAGOGÍA EN INGLÉS
WHAT FACTORS INFLUENCE THE STUDENTS’ DECISION TO BECOME TEACHERS IN THE FACULTY OF EDUCATION AT ANDRÉS BELLO
UNIVERSITY?
Seminario para optar al título de Profesor de Inglés para la Enseñanza Básica y Media y al Grado Académico de Licenciado en Educación
Autores: Eduardo Andrés Artigas Monardes, Vivian Alejandra Castillo Catrilaf, Fernanda Isidora Horta Barrie, Simón Alexis Schwarzemberg Leyton
Profesor tutor: Patricia Sánchez Lorca
TABLE OF CONTENTS
Acknowledgements ... III Abstract ... VIII Resumen ... VIII
CHAPTER 1: INTRODUCTION ……….………...10
CHAPTER 2: LITERATURE REVIEW ………..…….………...12
2.1 Motivation …..………..……….…………...12
2.2 FIT-choice Scale ………...…... 27
CHAPTER 3: METHODOLOGY ….……….………….... 31
3.1 Participants ….……….…………... 32
3.2 Instrument ... 32
CHAPTER 4: PROCEDURES………..……….….….…... 37
CHAPTER 5: ANALYSIS AND RESULTS……….……….…....…….... 39
CHAPTER 6: DISCUSSION ….………...…...…...… 45
CHAPTER 7: CONCLUSIONS ….………..…...…...… 48
7.1Suggestions for further studies………... 49
7.2 Limitations of the study ………..…...…….. 50
7.3 Personal reflections of the study ……….………... 50
7.4 Pedagogical Implications ………..……...… 51
III
Acknowledgements
(Eduardo) To my fellow researchers because they were really supportive to me when I was in trouble or I just wanted to quit. Besides, they were comprehensive when I needed to work and not being fully present in this long and tough process in which we remained together after all.
To our supervisor; Miss Patricia Sánchez. It was an undoubtedly hard and tired year for her, but she kept with us when she had some extra free time, even though she could have used that time to have some rest (because she really needed it), or just continue doing the infinite tasks she had to accomplish. It wasn’t an easy process for any of us, but we succeed at the end, and that’s, in part, because of her.
To my parents and sister. They were definitely the best support I had since the very beginning, sometimes believing in me more that even myself. They cheered me up every time I needed it, and why not to say this? when it was unnecessary, too. Without their everlasting support, I wouldn’t get this far in life, and of course, I wouldn’t be typing these words.
To my friends, workmates, and girlfriend. When I needed to have some fun, get distracted, or simply when I wanted to spend some of my little free time with them, they were more than available and willing to come up with something to take me out of the “stress zone” (as I liked to call it). However, not everything was about having fun or partying, they encouraged me to continue in this trip because they believed in me and in my capacities.
To my teachers. Yes, all the teachers that I have had since I started attending school. I can still remember some of their names. From high school: Miss Fernanda, Mister Alejandro, Miss Patricia, Mister Pablo, and many others that I can’t recall right now. From the University: Mister Magana, Mister Arcaya, Miss Carla, Miss Carmen Gloria, Miss Carol, among others. However, I mention these names because I feel their impact in my life was stronger, and they taught how to be an adult who can really look after himself.
IV
impossible to explain every single step of every single part of the course in order for me to succeed and pass the course. I'm beyond grateful because of what I mentioned and because of how supportive she has been during this process. She helped us with the qualitative part of our study, which was a nightmare for me, and she could teach that approach in such a good way that we continued working by ourselves after some sessions.
To my dog. This part might sound crazy, but I truly feel that my pet was a huge emotional support during this process. As this year I went through many things, and I spent some week alone, the only company I had was him: Mocho. I can still remember some afternoons in which I was working on this study and my dog was next to me, looking at me with his innocent, cute face. I know dogs can’t read, but I’m grateful for having him in my life and I felt the need of sharing this with whoever reads our research.
(Fernanda) After an intensive period of almost a year, today is the day: writing this note of thanks is the finishing touch on our dissertation. It has been a period of intense learning for me, not only in the investigation area, but also on a personal level. Writing this thesis has had a big impact on me, and I would like to reflect on the people who have supported and helped me so much throughout this period.
I would first like to thank my fellow researchers and classmates for their wonderful collaboration and team work. We all know it was very hard at the beginning as we did not know how to conduct a thesis all by ourselves, in other words, we were in unknown waters. However, we were able to stand up every single time and keep going until the end. What is more, we were able to support each other and willing to help when necessary.
V
I would also like to show gratitude to all of my teachers that were part of my education during these 4 years, not only for teaching me and being patient in your subjects, but also for teaching me about life and how to overcome any obstacle that I may find on the way. However, there is a crucial person in our thesis and education; Miss Daniela Bascuñan, who was able not only to teach us under her subject, but to keep helping us and guiding us on our thesis. Also, her teaching style and enthusiasm showed in and out her classes made a strong impression on me and will always carried these beautiful memories with me.
Getting through this challenge required more than academic support, and I have many, many people to thank for listening to and, at times, having to tolerate me over the past time. I cannot begin to express my gratitude and appreciation for their friendship. Moreover, for always being there, not only to support each other by talking over our personal and academic problems, but also happily talk about things other than our student’s life.
Most importantly, none of this could have happened without my family. To my parents who offered their encouragement and wise counsel. To my siblings, for their sympathetic ear and all the ways they thought of to cheer me up. As a family we have always been supportive with each other, and that is the reason why I am thankful of having you. For the reason that every time I was ready to quit, you did not let me and I am forever grateful. This thesis stands as a testament to your unconditional love and encouragement.
Thank you very much, everyone!
VI
they really gave me good pieces of advice. Last but not least, my fellow researchers... no one knows better than them the way we lived this tiresome and long process. I want to thank you guys for making such a good team even though it was a bit difficult at the beginning. I’d rather not mention it. We finally made it!
(Vivian) I have to be honest; I never imagined how demanding conducting a research was. Luckily, I was not working alone because I had the most amazing people next to me, and today, when this process comes to an end, I would like to gratefully acknowledge you all.
My deep gratitude goes first to my family because without my mother and sister, I would not be the person I am today. Thank you mom for never giving up, you took care of your two daughters without the help of anyone, and even though it was a really difficult and demanding task, you did it really well. I am sorry if I never understood why you had to work from Monday to Monday without taking breaks. Of course, now that I am an adult, I can understand the reason and your motives behind so much work. Mother, you are always telling me how much you admire me because I was able to learn a foreign language, but mom, I admire so much more for all you have done and the sacrifices you have made only for your daughters to be safe and happy. I never cried or suffered when I was growing up because I have been the happiest girl in the world thanks to you. Dear mother, you taught me that by working hard and believing in my dreams, I could achieve any goal I have.
VII
Thanks also to my boyfriend because sometimes I just wanted to quit and I stopped believing in myself, but you always were there next to me. In some occasions, you knew that a “you can do it” did not work, so you helped me with your love and patience. To be honest, I have never met someone with that amount of patience before. Thank you for truly believing in me and for saying that to me every day.
I would like to extend my sincerest thanks and appreciation to my colleagues because this thesis would not exist without our collaborative and group work. Once, I read that a journey is easier when you travel together. We know that this was not easy at all, but when were together, I felt stronger. Thank you for being the people you are, I know this wouldn´t be possible without you.
I truly believe that when conducting research, you need the help of someone with experience, someone that is able to guide you and help you in all this process. Due to that, I am extremely indebted to my supervisor, Miss Patricia Sanchez who has been guiding us in this whole process. She has provided materials, resources, and everything that was necessary to accomplish our research work. Over her guidance, we learned a lot and at the same time, we overcome many difficulties. She is a really good teacher and due to that, she was busier than any other, but she always was there with us. She is fundamental in our career and in our thesis.
To finish with, I gratefully acknowledge Miss Daniela Bascuñan who has been with us in this process and tried to help as much as she could by answering all our questions and doubts. She always had the patience to explain everything that was necessary over and over again, and it did not matter how little, dumb, or repetitive these questions and doubts were. I think that the base of any professional in any job is the vocation they have, and today, I can affirm that Miss Daniela truly loves what she does. Thank you, Miss because without you, we could not have done it.
VIII
Abstract
In the present research, a quantitative study is conducted in order to know what motivates Chilean students to enter a teaching program at Andrés Bello University. In Chile, pedagogy is a controversial topic due to the fact that for many years, the Chilean government has been trying to attract the most qualified students into teaching programs being the efforts not enough. Therefore, knowing what motivates students would help accomplishing this goal. Motivation was measured applying the FIT-Choice Scale to 143 students from four teaching programs: Elementary Education, Musical Education, Physical Education, and English Teaching. In order to analyse the data, descriptive statistics were implemented which were the mean, standard deviation, and median being crucial exponents to have a complete and reliable base to find results and draw conclusions on the topic. The results obtained in this study showed that shaping the future of children and adolescents was one of the most important factors to choose a teaching career.
Key words: Motivation, Fit-Choice Scale, Teachers Resumen
IX
evidenciaron que Formando el Futuro de Niños y Adolescentes fue uno de los factores más importantes al escoger una carrera relacionada con la pedagogía.
CHAPTER 1: INTRODUCTION
Why do students choose a teaching career? What are their motives to enter a pedagogy career? Where does their motivation come from? Researchers all over the world have been conducting research regarding the motivation students have when choosing a pedagogy program. According to Oxford Dictionary, motivation can be defined as “a reason or reasons for acting or behaving in a particular way.” If this concept is applied to the educational field, it can be said that motivation is what drives students to choose a pedagogy career. The quality of education is strictly related to the quality of teaching. Therefore, it is essential to attract good students into pedagogy programs. Countries which are known for their high quality educational systems such as Finland, Singapore, and New Zealand attract the best candidates into teaching due to the fact that they have policies that encourage students to choose the teaching profession.
In this research, the situation in Chile will be studied because it is totally different from the situation in other countries as there are some factors that affect both students’ perception of the career and students’ motivation towards pedagogy. Therefore, in order to attract the best candidates into pedagogy, the career needs to increase its social value (Bellei & Valenzuela, 2010). Consequently, the Ministry of Education has established some policies, such as Beca Vocación de Profesor1, in order to motivate students who obtained good results in the PSU2 to enter pedagogy careers who will receive financial support during the whole program.
The main objective that the present research intends to achieve is to know what factors influence students’ decision to become teachers in the Faculty of Education at Andrés Bello University. At the same time, it is expected to know whether those factors tend to be the same among pedagogy programs or not. In addition, this research also aims to determine which one of the twelve
1 A scholarship offered to every student who scores over 600 points as an average in the PSU (standardized tests) and postulates to a pedagogy program.
2
CHAPTER 2: LITERATURE REVIEW
2.1 Motivation
As stated before, motivation is a very important factor when deciding what you will be doing for the rest of your life (Bellei & Valenzuela, 2010), but when thinking about teachers, people may not have a clear view or idea of their decision, so they are not able to understand the motivation students have when becoming teachers. Several research studies have been conducted to gain insights into pre-service teachers’ reasons for entering a teaching career since over the last years it has become a relevant subject in most countries. Researchers have revealed that there are factors influencing this decision related to intrinsic, extrinsic, and altruistic motivation. For a better understanding, intrinsic motivation is inspired by personal interests or deeply held values (Ryan & Deci, 1985). In contrast, extrinsic motivation refers to behavioral motivations, not necessarily interesting or perceived as relevant to one’s values (Ryan & Deci, 1985). Altruistic motivation refers to “the desire to enhance the welfare of others at a net welfare loss to oneself” (Serge-Cristophe Kolm & Jean Mercier Ythier, 2006). Knowing what motivates students to choose pedagogy programs would raise initiatives to encourage students to choose teaching. For instance, if students are motivated by the possibility of getting a good salary, government should increase and pay more to teachers, so that outstanding students will feel attracted to choose the career. Additionally, depending on the context, the result will vary from the incentive for ongoing personal development and learning, or contribute to society, to find a secure and stable job, and salary, to name a few (Bastick, 2000; Chong & Low, 2009; Klassen, Al-Dhafri, Hannok, & Betts, 2011; Richardson & Watt, 2005; Rinke, 2008; Watt & Richardson, 2008).
Dennis M. Mcinerney called ‘‘Motivations to teach: Psychometric perspectives across the First Semester of Teacher Education’’ in 2006, data collected from 98 first-year pre-service teachers studying at a large public university in Sydney, Australia, was collected and studied. Although there has been relatively little research using suitable measurement methodologies such as to test the psychometric properties of instruments measuring motivations to teach, the attempt to measure changes over time in pre-service teachers’ motivations to teach, or the attempt to assess the effects of relevant variables (i.e., age or gender) may have on temporal changes in motivations to teach, this study was an attempt to address the issue of creating a more accurate instrument to measure and target these points. From the motivational psychological perspective, identifying motivations associated with attraction, retention, and concentration may have important practical outcomes from the teaching perspective, due to the fact that being able to identify factors attracting people to teaching may help education providers to target those factors and make the program more attractive for candidates (Sinclair, Dowson & Mcinerney, 2006). Additionally, motivations to teach may be externally or internally bore— motivations from primarily involved people or conditions that are external to an individual, while the second one are motivations attributed to beliefs, values, and perceptions of the individual. In this research, an instrument to measure pre-service teachers’ motivations to teach through a new instrument called ‘‘Modified Orientations to Teach Survey’’ or MOTS, based on the OTS (Orientations for Teaching Survey) from Ferrell & Daniel (1993) was created. The MOTS was designed to measure Australian pre-service teachers’ motivations to become teachers; more specifically, to measure 10 specific motivations to teach. Moreover, this instrument comprises 80 items measuring these 10 specific motivations, where 58 of these items were taken from the original OTS. Thus, as the items from OTS had limitations, the instrument had to be modified in order to use a different approach.
The availableevidence seems to suggest that teachers may show a variety of different motivations towards the teaching career and that these motivations can change across a specific period of time. It also provided initial evidence of the concepts targeted pre-service teachers’ motivation to teach do change over time, possibly as an outcome of the reality of working with children in schools, and indicates that there are some age differences in pre-service teacher motivations too. Even though this study may limit generalizations due to the small sample size, it provided an initial empirical basis to inform future psychometric studies on pre-service teachers’ motivations to teach.
study a teaching career, it does not mean that it is going to be a less competent teacher; it only means that that person will be less motivated in the future. Sometimes, external factors such as having a relative who is a teacher may play an important and positive role when choosing the career. In fact, some studies have suggested that “18% to 40% of students who study teaching have one relative who is a teacher.” (Tomsik R., 2016).
Why it is important to know the factors that motivate students? This is important because motivation can be encouraged in order to engage more students into the teaching field. Motivation is also related to curiosity, goals, and comfort. Someone curious will continue engaged because of the desire to know more, and it is motivated to do it. The same happens with someone who wishes to achieve a goal; that person will be prompted to continue until reaching its objective. Lastly, someone who is feeling comfortable doing what he/she is doing will want to keep that feeling.
The access to enter teaching programs in Chile has few requirements in connection to the admission process, which do not recognize the real value that the career has. A career that has more admission requirements and better salaries is more appealing to people and therefore more appreciated by society (Bellei & Valenzuela, 2010). Nonetheless, changing this view would take time since it is necessary to change the society’s negative opinion about the teaching career; however, currently employed teachers do not have that misconception about it. Employed teachers decided to become teachers not because of the working conditions or the amount of money paid, but because of the desire to educate and the social importance, that teaching implies (Centro de Investigación Avanzada en Educación (CIAE), 2015).
therefore, the profile of students who want to become teachers is not only necessary to attract people into the career, but also to keep students in the career.
For many years, the same questions have been all around the world: why choosing pedagogy? Or why people shift from well-paid, high-status jobs into teaching? As Richardson and Watt say, “While there have been many studies of teacher motivation in different contexts over time, there has not been a reliable measure upon which researchers could draw which would permit comparisons across different settings and samples.” Therefore, they found the need of investigating the subject in matter and created the FIT-Choice Scale (Factors Influencing Teaching Choice), which is an instrument developed to assess the main factors that influence the decision of teachers to teach (Richardson & Watt, 2012). This instrument offers the opportunity to measure and compare motivations for different individuals and settings (Richardson & Watt, 2012, 188). Additionally, as the FIT-Choice Scale has shown to predict both positive and negative outcome variables among beginning teachers (Richardson & Watt, 2012), researchers around the world have been using Watt and Richardson’s instrument to apply this tool and start investigating in their own countries. Moreover, as it was shown in the original Australian FIT-Choice sample (Richardson & Watt, 2007), highest rated motivations for teaching were from the intrinsic value of teaching, the desire to make a social contribution, shape the future, and work with children (Richardson & Watt, 2012,188); and the lowest rate registered was choosing teaching as a ‘fallback’ career.
to attract the best candidates into teaching careers. Following the same piece of research done by McKinsey, 25 countries were studied, being 10 the ones with the best educational systems in the world according to the Programme for International Students Assessment (PISA3) from the OECD4. After several investigations related to countries’ investment in education, number of students per classroom, quality of instructors, among others, McKinsey concluded that preparing future teachers before entering the career was the main reason for their success. Additionally, trainee teachers were paid, which was also a motivation for them to make an effort and try to be qualified for studying a pedagogy career (McKinsey, 2007). The latter is the most important because it gives a reason why foreign future teachers choose teaching careers instead of other options.
Internationally, factors influencing students’ motivations to become teachers may vary even though there are some factors which tend to be common such as choosing pedagogy to be able to work with children and adolescents. For this reason, different studies have been conducted in different countries, not only in Europe, but also in Asia, America, and Africa, using Richardson and Watt’s Fit-Choice Scale (2008), which is one of the most significant studies in the field of pre-service teacher motivation based on the expectancy-value framework. Moreover, following the line of Richardson and Watt (2012), in their latest cross-cultural investigation, in which pre-service teachers from Australia, Germany, and Norway were included, it was found that there were no great differences regarding motivation to teach in relation to the country’s context. (Watt, Richardson, Klusmann, Kunter, Beyer, Trautwein, & Baumert, 2012). It was also mentioned that motivation for career choice could be guided by mixed factors within different sociocultural contexts (Watt et.al, 2008). For this reason, developing countries took this subject into consideration resulting in different findings that have demonstrated extrinsic motivation as an
3
PISA is a triennial international survey which aims to evaluate education systems worldwide by testing the skills and knowledge of 15-year-old students.
4
important factor for pre-service teachers in Brunei, Zimbabwe, and Slovakia (Yong, 1995 Yong, B. C. S. (1995) i.e., salary, job security, and career status. Nevertheless, it is interesting to note that the major role in teachers’ motivation for teaching in China was intrinsic motivational factors (Tang, 2011 Tang, W. L. (2011). As a result, these differences could be an indication on how social and cultural contexts affect teachers’ decisions when choosing pedagogy.
Japan is one of the top performing countries for literacy, science, and mathematics in the OECD group proving to be one of the best candidates. In east Asian tradition, teaching is ‘‘a respected profession, a lifetime commitment, a much sought after occupation...because learning is the most valued pursuits and goals in contemporary Japanese life, teachers are still greatly valued’’ (White M.,1987). As Japanese culture views the school as a moral community and a basic training ground for becoming a good citizen, teachers have a broad responsibility for character development and moral education, attitudes, and living habits in students. Moreover, one of the incentives for Japanese students to become teachers is the high salary and retirement benefits that teachers receive. In fact, first-year teacher salaries are generally higher than those of other professions such as businesspersons, engineers, pharmacists, etc. (Hayakawa, 1986). Additionally, a survey conducted by Comings in 1980, which followed the status of occupations in Japan, showed that elementary teachers enjoyed higher prestige, more than civil or mechanical engineers, university profession, and even high-court lawyers (Hayakawa, 1986). To conclude, considering the information regarding Japanese culture, it can be said that teachers in Japan are important because the career is highly valued.
the Motivations for Teaching. Both measurements tackle students’ motivations to choose a teaching program. The idea for this study to be done was the possible connection between personality traits and both intrinsic and extrinsic motivations. The results showed that personality traits better predicted intrinsic motivation in comparison to extrinsic motivation.
and education policymakers “acknowledge the importance of student course alignment which transcends current matriculation system measures of student suitability to engage in a pre-service teacher education program” (Hennessy & Lynch, 2016).
Marjon Fokkens-Bruinsma & Esther T. Canrinus (2012) wanted to know the sustainability of the FIT-Choice Scale. To accomplish this aim, they surveyed students in their first year, in Groningen University, The Netherlands, who were going to teach in lower and upper secondary education. Since the Netherlands had a shortage of teachers, the researchers decided that knowing the reasons to become teachers was important in this matter. The level of affective professional commitment was what Dutch researchers were investigating, and that is the main reason why they conducted the study. They applied the survey twice; when students first entered the program and at the end of that same year. The data collection was obtained from 151 students who voluntarily agreed to participate in the study. Even though they made little modifications to the FIT-Choice Scale, there were no significant changes in previous studies using the same instrument by other researchers. Participants designated self-perception of teaching related ability as the most influential to a teaching career. An agreement among researchers is found because
satisfaction with choice continues to be one of the most highly rated, and salary and status is still one the lowest rated. The results may incentive Dutch governments to “[put more] emphasis on improving the status and salary of the teaching profession” (Fokkens-Bruinsma & Canrinus, 2012). At the end of the research, it was found that self-perception of teaching related ability and social influences were the two most important reasons to become teachers, and it would be an “important aspect to focus on rather than salary or status” since it is what motivates preservice teachers to choose teaching careers (Fokkens-Bruinsma & Canrinus, 2012).
choose to teach for similar or different reasons. Data gathered among students at the beginning of the final part of a program in an Australian university-based teacher training programme located in Dubai suggested that altruistic and/or intrinsic and extrinsic factors were a mediator in the relationship between prior teaching and learning experience and social influence, and choice of a teaching career. The development of this new version of the FIT-choice Scale was informed by a pilot survey among five teaching staff and twenty graduates using the original FIT-Choice Scale. In this pilot survey, some items were merged, a few items such as social dissuasion, task demand factors, and self-perceptions were omitted; and finally, 26 items or motives were included in the final questionnaire. Additionally, a ten-point scale ranging from 1 (not important at all) through to 10 (extremely important) was set to measure the degree to which in-service teachers valued motivation for teaching. The participants represented a wide variety of nationalities, living in different states of the UAE such as Abu Dhabi, Dubai and Sharjah. The survey was taken through an online survey platform and conducted in all three trimesters in 2015 among in-service teachers studying in the said university in Dubai. A convenience sample of 102 teachers working in international schools located in the three major states mentioned before, representing a wide variety of nationalities from Africa, Asia, Australia, Europe, Middle East, and North America. Of these participants, 70% were women out of the total. The available evidence seems to suggest that some gender differences were observed in case of four factors, i.e., fall back career; work with children and adolescents, salary and prior teaching and learning experiences. To finish, the authors developed the claim that the results essayed in this study were apparently unique since no previous studies on teaching motivation had a combined focus on all in-service, expatriate, and Emirati teachers using FIT-Choice Scale.
universities where 80.1% of them were women. In the research, the FIT-Choice Scale was used, and it was also translated and validated by her. Additionally, Gratacós did not only apply on paper questioners, but facilitated surveys through Internet for students. In fact, that version is the one we are using the present research. There were three highest rated factors which were working with children, intrinsic career value and perceived ability. Likewise, the lowest rated factors were teaching as a fallback career and job security. Interestingly, in Spain the results were not very different from the ones in previous studies such as in the USA, Croatia, Australia, and Turkey. It was found that satisfaction that teaching provides in the Spanish context was high being the second highest behind Croatia. Overall, altruistic and intrinsic motivations are, again, confirmed by the study since students are driven by intrinsic motives rather than extrinsic motives.
Several interviews have been applied throughout the years in Chile for knowing what the students’ appreciation towards pedagogy programs is. An example is a study conducted by Elige Educar5 and Adimark GfK6 since 2009, in which Chilean people’s valuation regarding teachers got a positive increase, moving from 56 point in 2014 to 59 points in 2015 (Índice Elige Educar, 2015). Elige Educar had made efforts to encourage students to choose pedagogy careers. One article published in Elige Educar’s webpage includes 9 reasons for students to choose a pedagogy career. Some of them fit better the main aim of this study, which is students’ motivation towards the career. The first point is meant to make people think about how transcendent the career is. Then, the third point tackles the fact that pedagogy is a career that allows teacher to work in almost any place. The fourth point shows a report made by Consejo de Rectores in which the number of student who entered a pedagogy career is presented, moving from 10,443 in 2016 to 12,218 in 2017. The fifth point refers to Beca Vocación de Profesor, which was explained before. The eighth point
5 A Chilean non-profit association born in 2009 because of a private-public alliance that seeks for bringing the most qualified students into pedagogy careers.
consists of a better salary, which depends on the feasible implementation of the Nueva Ley de Carrera Docente. The last meaningful point is the ninth one, which is about the flexibility future teachers will have in comparison to what teachers used to do in the past. Moreover, it was appreciated that the number of students who put pedagogy in their first options increased. Finally, it is presented that in 2016, for the very first time, students’ willingness to enter a pedagogy career equated medicine, and overpassed Architecture and Law. These three points mentioned show that students are more interested in pedagogy, but in this case the motivations they had toward the career is not included.
In addition, the situation in Chile is not the same as other countries since the entrance to pedagogy careers does not have many requirements except for having a minimum score in the PSU (500 points). Furthermore, as a country, we have been striving to get better education for everyone through different initiatives in relation to attracting more qualified students into teaching. Several changes have been made in this direction in order to attract outstanding students; for instance, a scholarship called “Beca Vocación de Profesor”7 was created in 2011. Among the initiatives, new policies to enter teaching careers have been issued. For example, “Nueva Ley Carrera Docente”8 that was enforced in 2016 is one of the examples of the efforts made to make sure that the students who are willing to enter the career are the most qualified ones (Elige Educar, 2009). These initiatives were created in order to increase the social value of the teaching career since in Chile it is not socially appreciated. According to a survey conducted by “Elige Educar” and “BID”9, among high school students who have an outstanding performance at school, pedagogy was placed as one of the three careers with lower status (Elige Educar and BID,
7
A scholarship created to engage students who scored over 600 in the PSU to enter a pedagogy career.
8It is a project proposed by Ministerio de Educación de Chile. Its main purpose is to test teachers and rank them into 5 different levels; Initial, Early, Advance, Superior, and Expert, being the first three mandatory.
9
2011). The purpose of this study was to know the value pedagogy careers have for Chilean students and due to this survey, it can be noticed the low value pedagogy careers have in Chile. Besides, students are not motivated to enter careers related to education if the salary is not appealing enough for their needs and wants. While some students think pedagogy careers are not highly valued in the Chilean society, others think careers related to pedagogy are easy to study. Therefore, if students do not have another alternative or motivation to study a specific career, they tend to go into pedagogy careers due to the fact these are considered easy to be admitted in.
Another example is a survey applied by Ministerio de Educación de Chile and Universidad de Chile in 2005, in which the 3 highest percentages of reasons why students selected a pedagogy program: they like to teach children and adolescents (57%), they think that education has an important role in society (56%), and they were interested in the subject they are teaching (53%). One last example is a piece of news shown in Ministerio de Educación de Chile’s webpage, but published by the web page “mifuturo.cl”. This page shows 5 reasons why students should choose a pedagogy program. These reasons are: high employability (79.2%), higher salaries (when Carrera Docente starts being applied in the country), high percentage of accredited programs (an 80% approximately depending on the type of pedagogy), better income profile (students with higher PSU scores are entering a pedagogy career), and finally the existence of Beca Vocación de Profesor (as mentioned before, students who scored more than 600 point in PSU standardized test have the possibility to study a pedagogy without paying tuition or fees).
The text called “¿Cómo Llevar los Mejores Talentos a la Sala de Clases?”
another tool used is social media, which is a really diverse and has a lot of impact in today’s society. In order to make pedagogy programs more attractive, online platforms like Facebook, Twitter, and YouTube were used to reach younger people. Moreover, “Elige Educar” asked some pedagogy students to present their testimonies to school students with the best performances to persuade them to choose a pedagogy program. The students in charge of giving the testimonies talked about the opportunities that every high-school student has in order to become a teacher, and they also explained why they decided to enter a pedagogy career.
Apart from all the studies previously mentioned, there is a current thesis conducted by Universidad de Concepción students in which a similar study was led, but with the difference that FIT-Choice Scale was not used. Instead, “Motivación hacia estudios del Magisterio” created by researchers from Universidad Jaume I de Castellón and Universitat de Valencia (Bertomeu et al., 2007). Besides, participants were asked to write their gender, age, type of pedagogy, and in which place they ranked the career (first, second, third, or fourth). The samplings for this study were 279 first-year students from 11 pedagogy programs in Universidad de Concepción. In the results, a 65% of the participants answered that they chose pedagogy as the first option whereas only a 3% wrote that it was their last option. Regarding the options in the questionnaire applied, the five motives which scored the highest percentages were the following: “I liked my type of pedagogy”, “I liked teaching”, “I thought teaching young and little students would be gratifying”, “I wanted to help other people” and “I liked children and/or working with them.”
2.2 FIT-choice Scale
framework has meant researchers have not always concurred on what constitutes intrinsic, altruistic, extrinsic or other motivations” (Watt, Richardson, Klusmann, Kunter, Beyer, Trautwein, & Baumert, 2012). Therefore, as the concern regarding students’ motivation to become teachers is a worldwide issue, the need of a common instrument led Richardson and Watt to create the FIT-Choice Scale in 2007. Besides, they decided to create this instrument due to the need of creating a profile for students who want to go into a teaching career (Watt & Richardson, 2007).
The FIT-Choice Scale is “an instrument that examines different classes of teachers’ motivations: perceived abilities; intrinsic, personal & social utility values; and task perceptions” (Richardson & Watt, 2006; Watt & Richardson, 2007, 2008). The authors of this instrument are two main figures in the field of research regarding students’ motivation to become teachers.
The FIT-Choice Scale is based on the expectancy-value theory, which was proposed by Wigfield and Eccles (1983), and it is a psychological concept which postulated that a person's motivation for doing something directly corresponds to whether the task is perceived as achievable or not. The FIT-Choice Scale is one of the most significant instruments in the field of motivation for trainee teachers because of its interest in pre-service teachers’ motivation to teach derived from the increasing teaching shortage reported in the UK, the US, Australia, Asia and other European countries (OECD, 2005). In this manner, Richardson and Watt investigated factors influencing pre-service teachers’ choice to teach in the Australian context. In the FIT-Choice framework the results of this investigation showed, as it has already been mentioned, that the highest rated motivations for teaching were from the intrinsic value of teaching, the desire to make a social contribution, shape the future, and work with children (Richardson & Watt, 2012,188); and the lowest rate registered was choosing teaching as a ‘fallback’ career.
to help guide future investigations in this area” (Watt & Richardson, 2007). Moreover, this instrument “offers the opportunity to measure and compare motivations for different individuals, from varying settings, and allows us to explore correlates and consequences of motivational dimensions” (Watt & Richardson, 2012). In addition, the scale also predicts both negative and positive variables among students who want to become teachers (Watt & Richardson, 2007), so it does not only give information that can be implemented to attract students into the career, but also information that would help to identify the negative aspects that make students avoid this career.
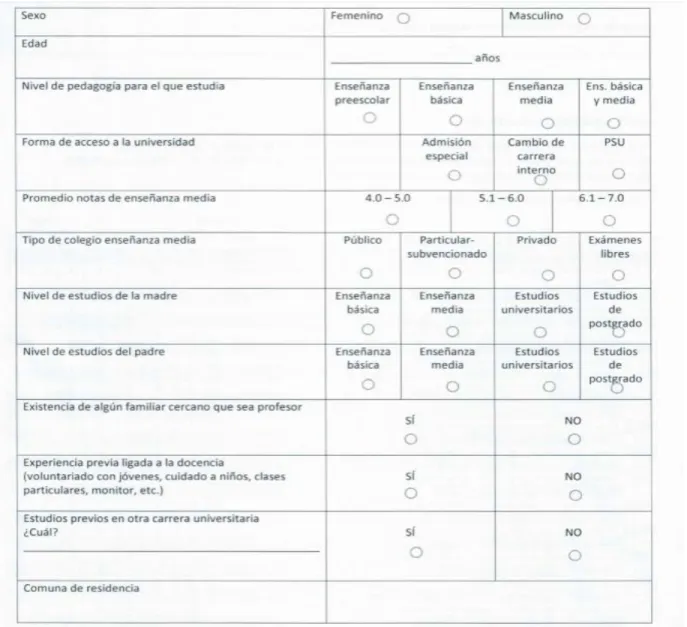
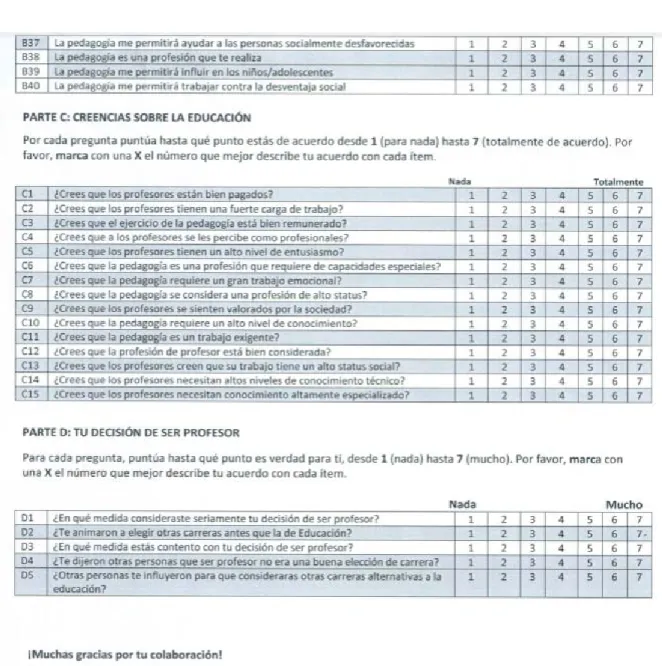
The FIT-Choice Scale is divided into four sections which are a) socio-demographic data, b) influencing factors, c) beliefs about education, and d) your decision to become a teacher. Each section contains items; for instance, part A has nineteen items and open questions, part B has forty items, part C has fifteen items, and part D has only six items. Whereas item A refers to personal information about each participant, items B, C, and D can be scored on a seven-point scale. Part B goes from 1 (unimportant) to 7 (very important). Part C has a rate with 1 meaning not at all agree and 7 which means totally agree. Part D, the last part, includes a rating scale from 1 (nothing) to 7 (a lot). There are eighteen factors that are being measured in this scale. Part B only measures motivational factors whereas in Part C and D perceptual factors on the teaching profession are measured. The motivational factors that part B measures are: working with children, enhancing social equity, shaping future children and adolescents, and making a social contribution which are part of the social utility value. On the opposite side, the personal utility value includes: job security, job transferability, time for family, intrinsic career value, perceived ability, prior teaching and/or learning experiences, social influences, and teaching as a fallback career.
CHAPTER 3: METHODOLOGY
Research is the process of collecting, analysing, and interpreting a data in order to understand a phenomenon (Leedy & Ormrod, 2001). In this research, it was decided to use a quantitative type of approach as it is a replication of similar studies conducted in different countries. Furthermore, as the name suggests, a quantitative approach focuses on the collection and analysis of data in a numeric form. Therefore, it allows us to gather representative sets of data because the information comes from a larger sampling. Additionally, results using a quantitative approach are better displayed to analyse and interpret them (Blaxter, Hughes & Tight, 1996). The research itself is independent of the researcher because he or she only collects the data using the instrument chosen and then quantifies it. As a result, the data measures reality in an objective manner. The purpose of a quantitative research is “to establish, confirm, or validate relationships and also to develop generalizations that contribute to research” (Leedy & Ormrod, 2001). Additionally, Creswell (2003) states that quantitative research “employs strategies of inquiry such as experimental design and surveys, and it collects data on predetermined instruments that yield statistical data”.
job, and salary, to name a few.” (Klassen, Al-Dhafri, Hannok, & Betts, 2011; Richardson & Watt, 2006; Rinke, 2008; Richardson & Watt, 2008).
The present study was conducted at Andrés Bello University, which is a private institution located in Santiago, Chile. Andrés Bello University has a trajectory of 29 years, and it has been ranked as number 64 out of the best private Latin American universities according to the QS University Rankings: Latin America (2012). This university is accredited both nationally and internationally. It has students from all social backgrounds due to the several opportunities it offers to them, such as government or internal scholarships to pay students’ fees and/or CAE10 which is a credit offered to students who receive a loan from the Chilean state to pay the whole program. Therefore, it can be stated that the University represents a large variety of the Chilean society.
3.1 Participants
The participants for the present study are first-year students that entered a pedagogy program at Andrés Bello University in 2017. It was decided that students from all 4 programs were going to be included. The sample chosen were 143 female and male first-year students ranging from 17 to 28 years old at Andrés Bello University. 87 participants were from Physical Education, 9 from Elementary Education, 12 from Musical Education, and finally 35 from English Teaching. We thought that students who are in their first year have good motives to choose the teaching career due to the fact that they have just taken the decision to enter the program and their motives are recent. Hence, they were the most suitable sampling for our study in order to identify which are these motives.
3.2. Instrument
To gather data, the instrument known as FIT-Choice Scale was applied as described in the Literature Review Chapter. This questionnaire was applied by
10 CAE Stands for Crédito con Aval del Estado or—sometimes also called—Crédito con Garantía
the Faculty of Education with the purpose of measuring reading and writing skills of first-year students, and at the end of the questionnaire applied, the Fit-Choice Scale was also included. The questionnaire was in its Spanish version because, according to Corder (1992) students feel more comfortable using their mother tongue and they can provide more realistic and complete type of answers. Moreover, as it was applied in their mother tongue, students would be more relaxed as the use of first language “reduces anxiety” (Auerbach, 1993). This instrument seems to be the most suitable since according to the Literature Review, it has been applied in different settings, contexts, and countries where reliable information has been collected about the topic being addressed.
The Spanish version of this instrument was validated by Dr. Gloria Gratacós in Madrid in 2014. This instrument has four parts; A, B, C and D. Part A asks for the background information of the students, part B for the influencing factors to choose the program, part C about the perception of the teaching career, and part D focuses on what moved them to become a teacher. Unlike the other parts of the questionnaire, part A seeks for personal information about each participant being the only open-ended part of the questionnaire. Part B focuses on the motivational factors participants have towards the decision to become teachers whereas parts C and D are mainly about perceptual factors they have towards the Chilean educational context.
Since the data was collected at the beginning of the term, as part of a larger diagnostic instrument applied by the Faculty of Education, it was not necessary for the present researchers to apply the instrument themselves because they were given the completed questionnaires. To be more specific, only one part of the diagnostic instrument was considered (The FIT-Choice Instrument).
CHAPTER 4: PROCEDURES
In the first place, as previously explained, the instrument was applied in March of 2017 to first-year students from Andrés Bello University by the university; in this way, providing us with the questionnaires. A consent letter was not needed as we were given the fulfilled questionnaires. After that, the questionnaires were gathered and information was quantified by all the researchers, giving emphasis to the results obtained in part B of the FIT-Choice Scale. In this part, the motivational factors are measured whereas part C and D are mainly focused on perceptual factors participants have towards education in the country. Nevertheless, all the parts will be considered because there could be a connection between what participants perceived in parts C and D, and what they answered in part B. Moreover, following the emphasis we want to give to part B, we analysed the twelve motivational factors that were randomly distributed all along in the FIT-Choice Scale. Then, the mean of each motivational factor was calculated to see how they were rated by the students. Likewise, it allowed us to create charts and figures—just like other researchers have done—to answer the research questions.
After quantifying the data, we determined to proceed as following: the statements that were randomly distributed throughout part B were organized according to the score which was in a Likert-type scale from 1 (not important) to 7 (very important). Due to the fact that students answered the questionnaire in paper, we had to transfer the physical results to an Excel document, which helped us to get the final results for the previous concepts as we created different charts in order to organise the gathered data. We chose those three types of descriptive statistics because we could obtain an average of all of the students’ answers and, hence, have a result that represents all participants’ opinions and answers.
deviation was needed to calculate the results, and we all agreed that having less than 0.20 in standard deviation would be repetitive enough since most of the students were likely to have similar answers.
We analysed the data gathered according to the following concepts: mean (M), standard deviation (SD), and median. Two central tendencies were considered—the mean and the median—and one measure of variability, which is standard deviation. The mean is the “total of the scores divided by the number of scores”, standard deviation (SD), “is an indicator of the dispersion or spread of the scores” (Creswell, 2012). To know the middle score among all scores we calculated the median which is also part of the central tendency and divides the scores, rank-ordered from top to bottom in half which means that 50% of the scores lie above their median and 50% lie below the median (Creswell, 2012). In this case, the median was used to identify the presence of outliers and being able to corroborate results along with the mean. Hawkins (1980) described an outlier as an observation that “deviates so much from other observations as to arouse suspicions that it was generated by a different mechanism” (Hawkins, 1980, p.1)
CHAPTER 5: ANALYSIS AND RESULTS
As the present study is a quantitative one, the results obtained were clear to organize and analyse. When the results were obtained, and all the previous steps were completed, we were able to identify what factors influenced students’ decision to become teachers at Andrés Bello University which was our main objective. Moreover, the most repeated factors among first-year students from different teaching programs, among the 12 motivational factors previously mentioned were identified (specific objective 1). In addition, the most highly rated factor was identified as well (specific objective 2). The results obtained in our study are explained in depth in this Chapter, including the average, Standard Deviation, and Median of all twelve motivational factors in each program. Below, in table 1, it can be found the mean, the standard deviation and the median among the four programs. These descriptive statistics allowed us to exemplify the results in tables, going from the general to the more specific information and results of each program. It is important to mention that in this way, the objectives of this study were directly addressed.
Table 1
Twelve motivational factors results
MOTIVATIONAL FACTORS MEAN SD MEDIAN
We decided to compare the four programs in order to know which of the 12 motivational factors is the most highly rated by first-year students from Andrés Bello University. The results showed that the most highly rated factor by the four teaching programs was Shaping Future Children and Adolescents
having a mean of 6.43. All the results are displayed in Table 1. The questions that were part of the most highly ranked factor (Shaping Future Children and Adolescents) were:
● B9. Teaching will allow me to shape children and adolescents values. ● B10. I want to help children and adolescents to learn.
Shaping Future Children and Adolescents is not only the most highly rated factor among the programs altogether, but it is also the factor which was most rated individually (see Table 2) since it goes with the nature of the program. Elementary Education obtained M= 6,8 which is the highest mean of the four programs (see Table 2). The median obtained in Shaping Future Children and Adolescents is 7 which means that fifty percent of the participants ranked that factor with the maximum score.
The second factor that was highly, equally rated was Making a Social Contribution since in all programs, the mean was above 6.0 which means that the factors were not repeated among programs, but they were closely related (see Table 1 and 2). The lowest rated factor by the 4 programs was Teaching as a Fall-Back Career with a mean of 1.94 being Elementary Education the lowest rated among the four teaching programs with a mean of 1.29.
If we look at the factor called Fall-back career, the averages were not as high as could be observed in other motivational factors. Thus, we can see that among the four programs, Physical Education was the one that obtained the highest mean (M=3.11) and its standard deviation being 1.94 was also the highest among the four programs meaning that their answers were quite spread among the participants. It means that pre-service teachers of Physical Education may have chosen the program as a last option. Thereby, students rated that factor differently producing a dispersion of 1.94. Furthermore, its standard deviation had a difference of 0.99 points with the program that had the lowest standard deviation which was Elementary Education (SD=0.95).
If we examine the factor called Intrinsic Career Value, English Teaching (M=5.9) and Physical Education (M=5.87) had a difference in their mean of 0.17 and even a sawed-off difference of 0.06 points in their standard deviation. This shows that between these two programs there is not much difference in the range of answers among the participants. It is important to remember that
the program. In contrast, Elementary Education (M=6.72) was the program that obtained the highest mean and the lowest standard deviation (SD=0.65) among the 4 programs, having more than a 50% of the participants agreeing in the answer chosen.
Regarding the second research question, if the factors were repeated among teaching programs (Specific Objective 1), we discovered that not all programs obtained the same average. The repeated factors pinpointed using the standard deviation were Job Transferability (0.15), Prior Teaching and/or Learning Experiences (0.08), and Social Influences (0.11). As it was previously mentioned, all factors having a standard deviation below 0.20 were considered since the results were less spread, which means that the answers given by the participants were similar. This can be verified using the median since in Job Transferability the median is 4, matching with the mean. In Prior Teaching and/or Learning Experiences the median is 6.5, matching the mean which is 6.02. Finally, in Social Influences the median is 4 being very close to the mean which is 3.63. The match between these two factors is important because if the average among the participants is as high as the median, it can be stated that at least half of the group analysed agrees.
In addition, the three highest averages obtained among all the factors were considered the most repeated using the mean (M) as part of complementing the idea previous paragraph. In this case the repeated factors were Shaping Future Children and Adolescent (M = 6.43), Making a Social Contribution (M = 6.04), and Prior Teaching and/or Learning Experiences (M = 6.02). All the results are shown in Table 1.
CHAPTER 6: DISCUSSION
Since teachers are shaping the future of children and adolescents, we believe that most pre-service teachers think that they might be able to change the future and create something better. We are aware of the fact that this type of research (quantitative) represents only a generalization of the topic as not all the participants are part of the sampling; nevertheless, as a large number of them answered the questionnaire, the results can be considered as a valid representation of the total group of students.
job that gratifies them, showing in this case that is not a program chosen after running out of options.
Regarding the second research questions of the study: Are there any factors repeated among students from different teaching programs? It was obtained that there are specific factors that were repeated between two programs; as well as some other factors repeated between the other two programs; for instance, Intrinsic Career Value, English Teaching and Physical Education had similar results while Elementary Education and Musical Education were different. Nevertheless, no factors were repetitive in the four programs. For instance, the standard deviation (SD) between English Teaching and Musical Education in Job Transferability the results were the same (SD = 1,88), but Elementary Education was far from being similar (SD = 2,20). Interestingly, the same happened to different factors showed in Tables 2 and 3 where some programs were similar while others were completely different--in terms of mean and standard deviation.
Along similar lines, focusing on the Mean obtained through the results of the participants, none of the factors were repetitive among the 4 programs, yet the results were much closer to each other. For example, in working with children English Teaching and Musical Education had a difference of 0.36 points among the results, which is an indicator of similarity. Meanwhile, in shaping future children and adolescents the scores in the mean between the lowest mean and the highest was of 0.8 points, which is not a big difference, but goes beyond the 0.5 points of difference stipulated by the researchers. However, there were three of the programs that were in the range stipulated, being English teaching (M=6.32), Elementary Education (M=6.8), and Physical Education (M=6.42). On the basis of the evidence currently available, it seems fair to suggest that none of the factors are repetitive among the 4 programs when having a look at the Mean.
among different studies; which is Shaping Future Children and Adolescents. Our results are in line with previous findings such as the one conducted in Australia by Richardson and Watt (2012), in which one of the most highly rated factor was
CHAPTER 7: CONCLUSIONS
The present research aimed to contribute with our understanding of the factors that motivated students to become teachers which is supported by previous studies such as the one conducted by Gratacós (2014), Watt & Richardson (2012), and Hennessy & Lynch (2015). We found that the motivations varied according to the nature of the different programs. However, there was a commonality in terms of Shaping Future Children and Adolescents
since in other studies the same factor was also the highest ranked. The intrinsic part was the most influential when choosing teaching as a career. In this case, as Shaping Future Children and Adolescents was the most highly rated among the four programs, it can be said that the statements that shaped this motivational factor are what motivates them the most in order to study a teaching program.
As highlighted in the Literature Review Chapter, the most typically selected factors among the studies conducted in other countries were Shaping Future Children and Adolescents, Making a Social Contribution, and Working with Children in studies such as Bieger & Yu (2013), etc. Additionally, we observed supporting evidence in our results—and literature review--showing that there is no single factor that can be applied to all the programs as the most important one. Though it can be stated that the intrinsic part is greatly pivotal for students choosing a teaching program since they were the most selected ones.
from our future teachers because it is what education requires in order to have the best candidates.
7.1 Suggestions for further studies
Since the present research did not attempt to compare results among different studies conducted in different countries, it would be intriguing to know the motivations of students from other universities nationwide and worldwide. Another important issue that would be interesting to analyse would be why some motivational factors scored such a small average among the four programs studied. That is to say, as we gathered data in order to analyse the most highly rated motivational factors among students, we also obtained the least highly rated ones. However, we did not go deeper in that area because the present study only focuses on the factors that were chosen with the highest score by the majority of the sampling. A mixed approach study using the same topic and questionnaire would be another possible idea for researchers to focus on. Including part A of the FIT-Choice scale and connecting the background of the participants with their motivations and perceptions towards the present topic could give more interesting answers about the reasons students have to choose some answers over the others. Moreover, future researchers could conduct a study using the same participants from this study but in their last year of the program to see if the same motivation remains or changed at the end of the program. Likewise, further studies could be focused on the change of motivation students may or may not have at the moment of starting their practicums in comparison to what they had answered in their first year of the program. Students may have some expectations regarding their practicums and the experience could be different from what they had expected, therefore as the experience may not fulfil those expectations, their motivation might change.
students or every 5 years due to the fact that the factors that motivate students to choose teaching programs might change throughout the years. In this way, institutions would be able to; change in favour of their students, realize which are the factors that motivate students, and make the necessary changes to attract the best candidates into teaching.
7.2 Limitations of the study
The first limitation about the study is present in all the quantitative pieces of research; the lack of conscientious responses. It is impossible to know if participants are answering the questionnaire with total honesty, so researchers have no other option but to trust participants’ answers. Skipped questions were also a limitation for our study. As the questionnaire had 60 questions as a total, it was very likely to find participants getting bored or distracted while answering the questions, having as a result participants skipping answers or simply not answering. We had a starting number of participants who answered the questionnaire, but some papers were not possible to be included as part of the final analysis as some students skipped one or more statements from part B of the FIT-Choice Scale. This situation led us not to include the whole questionnaire of those participants in the study. Another limitation of the study was that the FIT-Choice Scale had never been applied in Chile. In fact, apart from the study in Concepcion in 2011, which was conducted with another questionnaire, there is no further data of the topic in matter. Due to this issue, there was no data connected to previous results obtained in Chile using the same instrument.
7.3 Personal reflections of the study
we truly believe that attracting the best candidates into teaching would make a difference in our country and Chile will be as good in terms of education as some European or Asian countries.
We firmly believe that when entering teaching programs, motivation is closely related to the performance that students will have in the future. Even though motivation is not easy to measure, we realized that by identifying the factors that motivate students, it is possible to generate an idea of the motivation they have when entering teaching programs.
7.4 Pedagogical Implications
The present study adds knowledge to all the previous studies conducted in several countries, and among different years. Moreover, it is outstanding as it was conducted in a Chilean private university in 2017. In this way, this research innovates in the sense of applying the FIT-Choice Scale in a Chilean institution, something that has never been done in the past. Moreover, as every country has a different culture, the results obtained in our research can be used in order to compare them to similar studies applied using the same instrument and confirm if the context of each country has to do with the results in different countries.
Another issue worth to mention is the fact that in Chile there have been several problems connected to attract possible candidates into teaching programs. To be more specific, a gap that we could find connected to our Chilean context is the lack of studies conducted towards what motivates students to enter a pedagogy program. This gap in comparison to the countries in which there is a deeper investigation about motivation on students who want to enter a teaching program, it can be seen that Chile is not in their level in terms of teaching career’s perception in the society, dropping the program, and/or creating policies that drag students to enter teaching programs.
REFERENCES
Andere, E. (2015). Are teachers crucial for academic achievement? Finland educational success in a comparative perspective. Education Policy Analysis Archives, 23(39). Retrieved from http://dx.doi.org/10.14507/epaa.v23.1752 Auerbach, E. (1993). Re-examining English only in the ESL classroom. TESOL
Quarterly, 27(1), 9-32. Retrieved from
http://www.ncela.us/files/rcd/BE019020/Reexamining_English_Only.pdf Bastick, T. (2000). The Measurement of Teacher Motivation: Cross-Cultural and
Gender Comparisons. Retrieved from
https://files.eric.ed.gov/fulltext/ED451254.pdf
Bellei, C., Valenzuela, J. (2010). ¿Están las condiciones para que la docencia sea una profesión de alto estatus en Chile? Retrieved from https://www.researchgate.net/publication/273143530_Estan_las_condiciones _para_que_la_docencia_sea_una_profesion_de_alto_estatus_en_Chile Bertomeu, F., Canet, G., Gil, V. & Jarabo, J. (2007). Las Motivaciones hacia los
estudios de Magisterio. Ponencia presentada en las Jornadas de Fomento de la Investigación, Universidad de Jaume I de Castellón y Universidad de Valencia. Retrieved from http://www.uji.es/bin/publ/edicions/jfi12/32.pdf
Blaxter, L., Hughes, C., & Tight, M. (1996). How to Research, Buckingham, Open
University Press. Retrieved from http://abcreorg.weebly.com/uploads/9/9/8/2/9982776/how_to_research.pdf
Brookhart, S. M., & Freeman, D.J. (1992). Characteristics of entering teacher candidates. Review of Educational Research, 62(1), 37-60. Retrieved from https://doi.org/10.3102/00346543062001037
Brown, S.,M. (2006). Confirmatory Factor Analysis for Applied Research. New York:
The Guilford Press. Retrieved from http://www.kharazmi-statistics.ir/Uploads/Public/book/Methodology%20in%20the%20Social%20Sc iences.pdf
A60&dq=education+in+finland&ots=bPue-TEDfX&sig=wsZ2IGcTVZ-A6sklL5Vi4r9ozVQ#v=onepage&q=education%20in%20finland&f=false
Butler, R. (2007). Teachers´ achievement goal orientations and associations with teachers´ help seeking: Examination of a novel approach to teacher motivation. Journal of Educational Psychology, 99, 241-252. http://dx.doi.org/10.1037/0022-0663.99.2.241
Centre on international education Bench marking (n.d). Finland: Teacher and Principal Quality. National Center on Education and the Economy. Washington, DC, 20037. Retrieved from
http://ncee.org/what-we-do/center-on-international-education-benchmarking/top-performing-countries/finland-overview/finland-teacher-and-principal-quality/ Corder, S. P. (1992). A role for the mother tongue. Language transfer in language
learning, 18-31.
Chong, S. & Low, E. (2009). Why I want to teach and how I feel about teaching-formation of teacher identity from pre-service to the beginning teacher phase. Educational Research Policy and Practice, 8, 59-72.
Creswell, J. (2003). Research design: Qualitative, quantitative and mixed methods approaches (2nd ed.). Thousand Oaks, CA: SAGE Publications. ISBN
0-7619-2441-8. Retrieved from
https://ucalgary.ca/paed/files/paed/2003_creswell_a-framework-for-design.pdf
Crouch, D. (June, 2015). Highly trained, respected and free: Why Finland’s teachers are different. The Guardian. Retrieved from
https://www.theguardian.com/education/2015/jun/17/highly-trained-respected-and-free-why-finlands-teachers-are-different
Deci, E., Ryan, R. (1985). Intrinsic and Extrinsic Motivations: Classic Definitions and
New Directions. Ideal Library. Retrieved from 0https://mmrg.pbworks.com/f/Ryan,+Deci+00.pdf [Accessed 18 Jun. 2017].