Desarrollo de un protocolo de análisis de la expresión génica mediante «differential display» que reduce el número de falsos positivos
12
0
0
Texto completo
(2) 194. VIEITES JM, SÁNCHEZ-POZO A, GIL A, SUÁREZ A. INTRODUCCIÓN. INTRODUCTION. Uno de los mayores misterios de la vida desde un punto de vista fisiológico consiste en conocer cómo 25.000 genes integrados en nuestro Genoma son expresados de forma regulada y coordinada en el plano temporal y espacial para dar lugar a los diferentes tejidos y órganos, en suma, a la vida. La enfermedad o su desarrollo genera en numerosos casos cambios drásticos en la expresión de genes de las células en diferentes tejidos y órganos. En la actualidad, numerosos grupos de investigación y empresas estudian activamente las alteraciones en la expresión de genes producidas por distintas enfermedades, con la intención de identificar dianas terapéuticas o de establecer perfiles de expresión asociados a resistencias farmacológicas, a la posibilidad de metástasis en los tumores o a predicciones de la evolución de las enfermedades (Nature visión genoma). La metodología experimental empleada para estudiar los cambios en la expresión de los genes ha evolucionado mucho en los últimos años: la hibridación sustractiva 2-4 , la expresión diferencial de genes (DD)5-7, el análisis seriado de la expresión génica (SAGE) 8,9 y, por último, los "microarrays" y "macroarrays" de DNA10,11. Son éstos últimos los mas empleados actualmente por su simplicidad de manipulación, reproducibilidad de resultados y la cantidad y calidad de la información biológica obtenida. En concreto, el método de análisis de la expresión diferencial de genes mediante PCR con cebadores al azar (DD) fue descrita por Liang and Pardee5,12-14. La técnica mostró ser una técnica simple en cuanto a manejo y aptitudes, versátil, pues se puede aplicar a pequeñas muestras de cualquier origen y, eficaz, ya que los cambios en la expresión se pueden evaluar directamente en el primer paso, el gel de poliacrilamida. Esta técnica se emplea actualmente en los estudios de expresión de genes en muestras cuyo genoma no es conocido y, por lo tanto, no puede analizarse mediante "microarrays". No obstante, presenta varias inconvenientes experimentales: el elevado número de análisis necesarios para estudiar los cambios totales en la expresión de genes de una muestra y la cantidad elevada de falsos positivos15,16.. One of the greatest mysteries of life from a physiological point of view is to know how the 25,000 genes integrated within our Genome are expressed in a regulated and coordinated way in terms of time and space, in order to give rise to the growth of different tissues and organs, or in other words, to life itself. Diseases or their development generate numerous cases of dramatic changes in the expression of genes in the cells of different tissues and organs. Today, numerous research groups and private companies are actively studying the alterations in gene expressions produced by varying illnesses, as a means to identifying therapeutic targets, or to establishing expression profiles associated with pharmacological resistence, to assessing the posibility of metastasis of tumours, or to predicting the evolution of diseases (Genome vision, Nature). The experimental methodology used to study changes in gene expressions has evolved a great deal during recent years: subtractive hybridisation2-4, differential gene display (DD)57 , serial analysis of gene expression (SAGE)8,9, and finally those of DNA «microarrays» and «macroarrays»10,11. The last two of these are the most currently used, because the method is easily manipulated, the results are reproducible and the quantity and quality of the biological information obtained is high. The method for analysing differential gene expression through PCR with random primers (DD) was described by Liang and Pardee5,1214 . The technique proved to be appropriate and straightforward to handle, versatile, given that it may be applied to small samples of any origin, and efficient, given that changes in the expression can be evaluated directly at the first stage, that is, during polyacrylamide gel analysis. This technique is currently used in gene expression studies in samples, whose genome is unknown and therefore, cannot be analysed through microarray analysis. However, the method also presents some disadvantages: the high number of analyses required to be able to study the total changes in the gene expression of a sample, and the high number of false positives 15,16. In this work, our research group has provided a series of solutions to the problems. Ars Pharm 2005; 46 (2): 193-204..
(3) DESARROLLO DE UN PROTOCOLO DE ANÁLISIS DE LA EXPRESIÓN GÉNICA MEDIANTE «DIFFERENTIAL DISPLAY»... THE DEVELOPMENT OF A PROTOCOL FOR THE ANALYSIS OF GENETIC EXPRESSION THROUGH «DIFFERENTIAL DISPLAY».... El presente trabajo recoge una serie de soluciones aportadas por nuestro grupo, que aplicadas a la técnica, permiten reducir el número de falsos positivos y aumentar su efectividad que reduce drásticamente el trabajo de validación posterior de los resultados obtenidos.. MATERIALES Y MÉTODOS Material biológico y diseño experimental Se usaron células epiteliales de intestino embrionario de rata IEC-6, proporcionadas por la American Type Culture Collection (ATCCCRL 1592), que se cultivaron en frascos de plástico de 25 cm2 o de 75 cm2 y en placas de 6 pocillos de aproximadamente 10 cm2 de superficie, en un incubador a 371/4 C, 5% de CO2 y un 95% de humedad relativa. Se usó medio de cultivo DMEM (SIGMA, Ilinois, USA), conteniendo 4.5 g/L de glucosa, 0.6 g/ L de glutamina, 100 U/mL de penicilina y 100 mg/mL de estreptomicina, 0.2 U/ml de insulina y 10% de suero bovino fetal (FBS) libre de complemento. Se realizaron pases de la línea celular cada 3-4 días. Se indujo la diferenciación de las células IEC-6 mediante su cultivo sobre una matriz extracelular proteica (MATRIGEL, Collaborative Research, Bedford, MA, USA), que contiene laminina, colágeno, heparán-sulfato, proteoglicanos, entactina (nidogen), TGF-β, activador del plasminógeno tisular y otros factores de crecimiento. El producto comercial se descongeló a 4 1/4 C durante toda la noche, previa a su dosificación y se mantuvo en hielo. Las pipetas, placas y tubos utilizados también fueron enfriados previamente. Se repartieron alícuotas de 0.5 mL de Matrigel en cada pocillo (placas de 6 pocillos de 10 cm2/pocillo), lo que supuso una concentración de gel de, aproximadamente, 0.8 mg de proteína/cm2 de superficie de cultivo. Las placas con Matrigel se mantuvieron a 371/4 C durante, al menos, 30 min. antes de la siembra de las células, para que el producto gelificara. Las células fueron recogidas 24 h después de extendidas.. 195. presented by this method, which on application result in a lower number of false positives and an improvement in efficiency, which dramatically reduces the subsequent work involved in the validation of the results obtained.. MATERIALS AND METHODS Biological material and experimental design Intestinal epithelial cells from rat embryo, IEC-6, provided by American Type Culture Collection (ATCC-CRL 1592), were cultured in plastic jars of 25 cm2 or 75 cm2 , and on trays of six dishes of approximately 10 cm2 in surface area, in an incubator at 37 1/4 C, 5% CO 2 and 95% relative humidity. Culture medium DMEM was used (SIGMA, Ilinois, USA), containing 4.5 g/L of glucose, 0.6 g/L of glutamine, 100 U/mL of penicillin and 100 mg/ mL of streptomycin, 0.2 U/ml of insulin and 10% of complement free fetal bovine serum (FBS). Cell line performances were carried out every 3-4 days. Differentiation of IEC-6 cells were induced through culturing on an extra cellular matrix protein (MATRIGEL, Collaborative Research, Bedford, MA, USA), containing laminin, collagen, heparan sulphate, proteoglycans, entactin (nidogen), TGF-β, tissue plasminogen activator and other growth factors. The commercial product was defrosted overnight at a temperature of 41/4, prior to its dosification, and was stored in ice. The pipettes, dishes and tubes used were also previously cooled. The 0.5 mL aliquots of Matrigel were added to each dish (trays of 6 dishes of 10 cm2 per dish), giving a gel concentration of approximately 0.8 mg of protein/cm2 of culture surface area. The trays were then kept at 371/4 C for at least 30 mins. before seeding the cells, in order to gellify the product. The cells were collected after a period of 24hrs.. RNA EXTRACTION Total RNA was obtained following the guanidine thiocynate /phenol-chloroform 17 method of extraction from frozen cells at – Ars Pharm 2005; 46 (2): 193-204..
(4) 196. Extracción de RNA El RNA total se obtuvo siguiendo el método de extracción con tiocianato de guanidina/ fenol-cloroformo17 a partir de células congeladas a -801/4 C. Se descongelaron las células e inmediatamente se les añadió de forma secuencial y agitando en cada paso: 1 volumen de GT/M, 0.1 volumen de acetato sódico 2 M, 1 volumen de Fenol, 0.2 volumen de cloroformo:alcohol isoamílico (49:1). Tras la última adición, las muestras se agitaron fuertemente durante 15 s, se incubaron 15 min. a 41/4 C y se centrifugaron durante 20 min. a 1100 x g a 41/4 C, separándose así la fase acuosa de la orgánica. Se recuperaron las fases acuosas, son las que contienen el RNA, y se les añadió 1 volumen de isopropanol para precipitar el RNA, incubando a -201/4 C durante al menos 1 h. Tras centrifugar de nuevo, en las mismas condiciones que la última vez, se lavaron los precipitados con etanol al 70%, se secaron a temperatura ambiente y se resuspendieron en un volumen determinado de H20-DEPC.. Tratamiento con DNasa I Para evitar la posible interferencia del DNA contaminante en el RNA obtenido de las muestra, se trataron éstas con DNasa I siguiendo el protocolo descrito a continuación. Mezclamos 50 µg de RNA total con 1µL de inhibidor de nucleasas de RNA (1U/ µL), 1 µL de DNasa I y completamos hasta un volumen final de reacción con tampón de DNasa 10X. Incubamos la reacción durante 30 min. a 37 1/4C. Para detener la reacción e inactivar la enzima añadimos 100 µL de Fenol/cloroformo (3:1) y agitamos en un vortex durante 30 segundos. Centrifugamos a 14000 rpm durante 10 min. a 41/4 C. Recuperamos la fase acuosa (superior) y la transferimos a un nuevo tubo libre de RNasas. Precipitamos el RNA añadiendo 5 µL de Acetato sódico 3M (pH 5) y 200 µL de Etanol absoluto (100%). Mezclamos bien e introducimos las muestras a -801/4 C durante al menos 30 min.. Centrifugamos a 14000 rpm durante 20 min. y a 4 1/4 C. Eliminamos el sobrenadante con cuidado y lavamos el preciArs Pharm 2005; 46 (2): 193-204.. VIEITES JM, SÁNCHEZ-POZO A, GIL A, SUÁREZ A. 801/4 C. After defrosting, the cells were immediately added sequentially and shaken at each stage: 1 volume of GT/M, 0.1 volume of 2 M sodium acetate, 1 volume of Phenol, 0.2 volume of chloroform:isoamilic alcohol (49:1). After the last addition, the samples were shaken rigorously for 15 secs and incubated for 15 mins at 41/4 C, and subsequently centrifuged for 20 mins at 1100 x g at 41/4 C, in order to separate the aqueous and organic phases. The aqueous phases containing the RNA were collected and 1 volume of isopropanol was added to precipitate the RNA, through incubation at –201/4 C for at least 1hr. After further centrifugation, under the same conditions as before, the precipitates were washed with ethanol at 70%, dried at room temperature and re-suspended in a determined volume of H20-DEPC.. DNase 1 TREATMENT In order to avoid any possible interference from DNA contamination of the RNA obtained, the samples were treated with DNase 1, in accordance with the following protocol: 50 µg of total RNA were mixed with 1 µL of inhibitor of RNA nuclease (1U/ µL), 1 µL of DNase 1 and completed to final reaction volume with DNase 10x buffer. The reaction solution was incubated for 30 min. at 37 1/4C. In order to stop the reaction and deactivate the enzyme, 100 µL of phenol/chloroform (3:1) were added and shaken in a vortex mixer for 30 seconds. Following centrifugation at 14000 rpm for 10 min. at 41/4 C, the aqueous phase (upper) was collected and transferred to a tube free of RNase. The RNA was then precipitated by adding 5 µL of 3M sodium acetate (pH 5) and 200µL of Absolute Ethanol (100%). After thorough mixing the samples were kept at 801/4 C for at least 30 min., and then centrifuged at 14000 rpm for 20 min. at 4 1/4 C. The supernatant was then eliminated carefully, and the precipitant washed with ethanol at 70%. The samples were then dried at room temperature and re-suspended in a determined volume of H2ODEPC..
(5) DESARROLLO DE UN PROTOCOLO DE ANÁLISIS DE LA EXPRESIÓN GÉNICA MEDIANTE «DIFFERENTIAL DISPLAY»... THE DEVELOPMENT OF A PROTOCOL FOR THE ANALYSIS OF GENETIC EXPRESSION THROUGH «DIFFERENTIAL DISPLAY».... pitado con etanol al 70%. Dejamos secar las muestras a temperatura ambiente. Resuspendemos en un volumen determinado de H 2ODEPC.. Expresión diferencial de genes Para llevar a cabo este estudio hemos utilizado el RNAm Profile System de HIEROGLYPH (Beckman, Coulter, USA), diseñado para producir fragmentos de DNAc con un tamaño máximo de 1-1.2 Kb de longitud a partir de RNA total, con perfecta reproducibilidad entre los duplicado. Dicho protocolo presenta los siguientes pasos: Primero: síntesis de DNAc de cadena simple a partir de RNA total de las distintas muestras. Para ello se utilizó la enzima transcriptasa inversa que sintetiza el nuevo DNAc en los sitios determinados según el tipo de cebador utilizado. Mezclamos 2 µL de RNA total (200 ng) con 2 µL del apropiado cebador oligo-dT ARP e incubamos a 651/4C durante 5 min.. Inmediatamente enfriamos a 41/4C. Añadimos a cada tubo de transcripción inversa 16µL conteniendo 4 µL de tampón 5X, µL de la mezcla de dNTPs 250 µM de cada uno (1:1:1:1), 2 µL de DTT 100 mM, 1 µL de inhibidor de nucleasas de RNA (20 U/ µL), 0.2 µL de transcriptasa inversa (SuperScript II RT) (200 U/ µL) y agua-DEPC hasta un volumen final de 16 µL. Aplicamos un pulso en una microfuga a las muestras y las ponemos en un termociclador con el siguiente protocolo de temperaturas: 10 min. a 25 1/4C, 1 h a 42 1/4C, 15 min. a 701/4C para enfriar rápidamente las muestras a 41/4C. Las muestras pueden ser utilizadas inmediatamente o ser almacenadas a -201/4C hasta su uso. Se realizo la síntesis de DNAc por duplicado para cada muestra. Segundo: Reacción en cadena de la polimerasa. Amplificación del DNAc de cadena simple sintetizado en la transcripción inversa mediante una reacción en cadena de la polimerasa utilizando cebadores específicos de secuencia. Mezclamos en un tubo de 0.2 µL los siguientes componentes: 2 µL de la transcripción inversa, 2 µL de tampón 10X, 1.6 µL de la mezcla de dNTPs 250 M, 1.2 µL MgCl2 25 mM, 2 µL del correspondiente randon primer, 2 µL del correspondiente anchored. 197. Differential expression of genes In order to perform this study, the mRNA Profile System, HIEROGLYPH, was used (Beckman, Coulter, USA), which was designed to produce cDNA fragments, with a maximum size of 1-1.2 Kb in length, from total RNA, with perfect reproducibility between duplicates. This protocol consists of the following stages: Stage one: simple cDNA chain synthesis from total RNA obtained from the samples. In order to carry out such a process we used the reverse transcryptase enzyme, which synthesises the new cDNA in determined sites, according to the type of primer used. 2 µL of total RNA were mixed with 2 µL of appropriate oligo dT primer ARP, incubated at 65 1/4 C for 5 min. and then cooled immediately at 41/4C. To each tube of reverse transcription we added; 16 µL of solution consisting of 4 µL of 5X buffer, µL of dNTP mixtures 250µM of each (1:1:1:1), 2 µL of DTT 100mM, 1µL of RNA nuclease inhibitor (20 U/ µL), 0.2 µL of reverse transcriptase (SuperScript II RT) (200 U/ µL) and DEPC water to a final volume of 16 µL. A pulse was applied to the samples in a microfuge, which were subsequently placed in a thermoclycler, according to the following protocol of temperatures: 10 min. at 251/4C, 1 h at 421/4C, 15 min. at 701/4C to cool the samples rapidly to 4 1/4C. The samples could then be used immediately or stored at –20 1/4 C until use. cDNA synthesis was then performed in duplicate for each sample. Stage two: polymerase chain reaction. Amplification of the simple cDNA chain synthesized in the reverse transcription through a chain reaction in the polymerase using specific sequential primers. A 0.2 µL solution of the following components were mixed in a tube: 2 µL of reverse transcription, 2 µL of 10X buffer, 1.6 µL of 250 mM dNTPs mixture, 1.2 mL of MgCl2 25 mM, 2 µL of corresponding random primer, 2 µL of corresponding anchored primer, 0.2 µL of polymerase (2.5 U/ µL), 0.25 µL [α-33P]dCTP. All of which was completed with water to a final volume of 20 µL. The samples were then subjected to the following program in the thermocycler: 1 cycle at 951/ 4 C, 2 min. 4 cycles at : 951/4C/15 sec., 461/4C/ 30 sec., 721/4C/2 min. 28 cycles at : 951/4C/15 Ars Pharm 2005; 46 (2): 193-204..
(6) 198. VIEITES JM, SÁNCHEZ-POZO A, GIL A, SUÁREZ A. primer, 0.2 µL de polimerasa (2.5 U/ µL), 0.25 µL [α-33P]dCTP y completamos con agua hasta un volumen final de 20 µL. Sometemos las muestras al siguiente programa en el termociclador: 1 ciclo a 951/4C, 2 min. 4 ciclos a: 951/4C/15 s, 461/4C/30 s, 721/4C/2 min. 28 ciclos a: 951/4C/15 s, 601/4C/30 s, 721/4C/2 min. 1 ciclo a 721/4C/10 min. Finalizando la PCR a 41/4C. Las muestras obtenidas pueden ser usadas inmediatamente o guardadas a 201/4C hasta su uso. El DNAc puede ser almacenado al menos durante 6 meses a -201/4C. Se realizó la síntesis por duplicado para cada muestra. Tercero: Electroforesis de las muestras: Se separaron los distintos fragmentos procedentes de cada muestra en geles de policacrilamdia al 6% en condiciones desnaturalizantes. Dicha electroforesis se llevó a cabo en las siguientes condiciones: 2700 voltios, 100 W, 50 1/4C durante 3 h. Cuarto: Revelado y selección de las bandas. Una vez realizada la electroforesis, se procedió al secado de los geles y a la colocación de la correspondiente película. Realizamos la exposición durante unas 16 h y procedimos al revelado. Una vez seca la película seleccionamos las bandas de interés en función de si su intensidad aumentaba o disminuía con respecto a su control.. RESULTADOS Y DISCUSIÓN El desarrollo de técnicas para la evaluación de cambios en la expresión de genes en sistemas celulares y en organismos completos ha supuesto una revolución en el análisis y en la comprensión de las alteraciones biológicas generadas por multitud de variables experimentales, desde sustancias químicas, ya sean fármacos, tóxicos, mutágenos o compuestos dietéticos hasta situaciones fisiológicas como proliferación, migración, división y diferenciación celular, y patológicas como el cáncer, la enfermedad inflamatoria intestinal, etc.18,19. La técnica de expresión diferencial (DD) puede usarse para comparar las expresiones de RNAm de muchas muestras bajo condiciones experimentales múltiples, permitiendo detectar tanto genes inhibidos como genes activados. La caracterización de estos genes y Ars Pharm 2005; 46 (2): 193-204.. sec., 601/4C/30 sec., 72 1/4C/2 min. 1 cycle at 721/4C/ 10 min. PCR was finally completed at 41/4C. The samples obtained were available for immediate use or were stored at –201/4C until later use. At –201/4 C, cDNA can be stored for at least 6 months. Synthesis was carried out in duplicate for each sample. Stage three: Electrophoresis of the samples: The different fragments from each sample in polyacrylamide gels at 6% under denaturised conditions were separated. This electrophoresis was carried out under the following conditions: 2700 volts, 100 W, 50 1/4C for 3hrs. Stage four: Film developing and the subsequent selection of wavelengths. Once electrophoresis had taken place, the gels were dried and the corresponding film was placed on them. After an exposure time of 16 hrs., the film was developed. Once the film had dried, the most significant wavelengths, selected on the basis of the increase or decrease of intensity in comparison with control, were studied.. RESULTS AND DISCUSSION The development of techniques used to evaluate changes in gene expressions, in both cellular systems and complete organisms, represents a revolution in the analysis and understanding of biological alterations generated by a multitude of variables. Such variables may be of varying origins, from chemical origin, such as medicines, toxins, mutagens or dietetic compounds, to physiological situations, such as proliferation, migration, cell division and differentiation, as well as those of pathological origin, as in the case of cancer, inflammatory intestinal disease, etc.18,19. The differential display technique (DD) can be used to compare mRNA expressions in many samples, under multiple experimental conditions, enabling both inhibited and activated genes to be detected. The characterization of these genes and their proteins may lead to the development of selective antagonists and inhibitors to be used clinically in the treatment of a wide range of disorders, including cancer, cardiovascular disease, CNS disorders, inflammation, tissue repair, etc. Today, it is the system of selection for analysis of gene expressions, when the Genome of the orga-.
(7) DESARROLLO DE UN PROTOCOLO DE ANÁLISIS DE LA EXPRESIÓN GÉNICA MEDIANTE «DIFFERENTIAL DISPLAY»... THE DEVELOPMENT OF A PROTOCOL FOR THE ANALYSIS OF GENETIC EXPRESSION THROUGH «DIFFERENTIAL DISPLAY».... sus proteínas puede llevar al desarrollo de antagonistas e inhibidores selectivos de utilidad clínica en el tratamiento de una amplia variedad de desórdenes, incluyendo el cáncer, la enfermedad cardiovascular, desórdenes del SNC, inflamación y reparación tisular, etc. Es en la actualidad el sistema de elección para los análisis de la expresión de genes cuando el Genoma del organismo que se estudia es desconocido. En este trabajo, hemos estudiado los cambios de expresión de genes asociados a la diferenciación de células epiteliales de intestino de rata IEC-6. Estas células inician la diferenciación celular in vitro cuando son cultivadas sobre una matriz de proteínas extracelulares. Los cambio estudiados son los producidos tras 24 horas de diferenciación. Una vez extraído el RNA total de las células, aplicamos el protocolo estándar de DD del kit Hyeroglyph Gene Expression de Beckman. Los resultados permitieron la identificación de un gran número de fragmentos de DNA generados a partir de genes expresados diferencialmente en las células intestinales (Figura 1). No obstante, la definición de las bandas era deficiente y la posibilidad de identificación de falsos positivos, que no pueden ser confirmados por Northern blot, era muy alta, teniendo grandes dificultades para discernir los productos de DNA cuya expresión estaba regulada por nuestra condición experimental, incluso usando α -33P (isótopo recomendado por la casa comercial) para el marcaje, y que genera bandas muy discretas en la radiografía (Figura 1). Ante este hecho decidimos realizar una serie de modificaciones en el protocolo comercial para la RT-PCR que nos permitieran una selección fiable de los fragmentos de DNA generados a partir de RNAm.. 199. nism being studied is unknown. In this work, we have studied the changes in gene expression associated with the differentiation of epithelial cells in rat intestines (IEC-6). These cells initiate cellular differentiation in vitro when they are cultivated upon a matrix of extra cellular proteins. The changes studied are those that have occurred after 24 hours of differentiation. Once total RNA has been extracted from the cells, the standard DD protocol for the Hieroglyph Gene profile kit (Beckman) is applied. The results enabled a high number of DNA fragments generated from differentially displayed genes from intestinal cells to be identified (Figure 1). However, the definition of wavelengths was found to be deficient and the possibility of identifying false positives that cannot be confirmed by the Northern blot, was very high. Great difficulty was encountered in the differentiation of the DNA products whose expression was regulated by our experimental conditions, even when the isotope α33 P (recommended by its manufacturers) was used as marker, and the wave lengths that were generated were found to be very discrete on the x-ray (Figure 1). In the face of such a finding, we decided to carry out a series of modifications to the commercial protocol for RT-PCR which would allow for a reliable selection of DNA fragments generated from mRNA.. Ars Pharm 2005; 46 (2): 193-204..
(8) 200. VIEITES JM, SÁNCHEZ-POZO A, GIL A, SUÁREZ A. FIGURA 1. Análisis comparativo de la expresión de genes en células epiteliales de intestino de rata en estado proliferativo (P) o diferenciado (D). Los fragmentos de PCR fueron separados mediante electroforesis en gel de poliacrilamida y revelados con placa fotográfica (geles A, B, C y D). Los cebadores empleados fueron: AP1, T7(dT12)GA; AP2, T7(dT12)GC; AP3, T7(dT12); ARP1, M13r-CGACTCCAAG; ARP2, M13r-GCTAGCATGG; ARP3, M13r-GACCATTGCA. El recuadro rojo enmarca el caso de un gen expresado en el estadio proliferativo y reprimido en estadio diferenciado. FIGURE 1. Comparative analysis of gene expression in epithelial cells in rat intestine, in proliferative (P) or differentiated (D) state. PCR fragments were separated through electrophoresis in polyacrylamide gel and developed on photographic plates (gels A, B, C & D). The primers used were: AP1, T7(dT12)GA; AP2, T7(dT12)GC; AP3, T7(dT12); ARP1, M13r-CGACTCCAAG; ARP2, M13r-GCTAGCATGG; ARP3, M13rGACCATTGCA. The red box frames genes expressed in proliferative and repressed differentiated state.. Ars Pharm 2005; 46 (2): 193-204..
(9) DESARROLLO DE UN PROTOCOLO DE ANÁLISIS DE LA EXPRESIÓN GÉNICA MEDIANTE «DIFFERENTIAL DISPLAY»... THE DEVELOPMENT OF A PROTOCOL FOR THE ANALYSIS OF GENETIC EXPRESSION THROUGH «DIFFERENTIAL DISPLAY».... La mayoría de los trabajos dedicados a la optimización del método se han enfocado a la optimización de las condiciones de PCR y al diseño de los cebadores utilizados, sobre todo del cebador 3'18-21. No obstante, ningún método reduce de forma significativa el número de falsos positivo, en parte atribuidos a factores como los tubos de PCR, la degradación de RNA o la contaminación de las muestras con DNA 22. En nuestro caso, las modificaciones aportadas en la optimización del método conllevaban una serie de cambios en el protocolo general. El primer cambio fue el introducido en el marcaje de los fragmentos de DNA generados por PCR. En el protocolo comercial el isótopo -32P se incorpora a la cadena de DNA durante la realización de la PCR, de forma que la cantidad de isótopo incorporado dependía entre otros parámetros de: por un lado la eficiencia de la reacción de PCR y, por otro lado, de la competencia con el nucleótido frío. En nuestro caso, el isótopo fue incorporado en el fosfato 5' del cebador T7(dT12)MN, de tal forma que los fragmentos de DNA generados por PCR son con toda seguridad extremos 3' de RNAm y eliminamos la visualización e interferencia de amplificaciones con el cebador AP exclusivamente. Las reacciones de PCR fueron precipitadas y cuantificada la cantidad de radiactividad lo que nos permitía cargar la misma cantidad de cpm en los distintos pocillos del gel de poliacrilamida, obteniendo una mayor uniformidad en la señal observada en las radiografías. Ambos cambios mejoraron sensiblemente el poder resolutivo de la técnica (Figura 1).. 201. Most of the research carried out with the aim of optimising this method has been focussed on the optimisation of PCR conditions, and on the design of the primers used, above all in the case of the primer 3’ (18-21). Nevertheless, no method has been found to reduce the number of false positives, which are in part attributed to factors such as the PCR tubes, RNA degradation, or DNA contamination in the samples 22. In our work, the modifications applied to optimise the method brought about a series of changes to the general protocol. The first of such changes was the marking of the DNA fragments generated through PCR. In the commercial protocol, the isotope a-32P is incorporated into the DNA chain while PCR is being carried out. Consequently, the quantity of isotope inserted depends, among other parameters, on the following: on the one hand, the efficiency of the PCR reaction, and on the other, competition from the cold nucleotide. In our case, the isotope was inserted in the phosphate 5' of the primer T7(dT 12)MN, in such a way that the DNA fragments generated by PCR are in all certainty 3' extremes of mRNA. We exclusively eliminated the visualisation and amplification interference with the AP primer. PCR reactions were precipitated and the degree of radioactivity was quantified. This allowed us to load the same quantity of CPM into the different polyacrylamide gel dishes, so as to obtain a greater degree of uniformity for the signal observed in x-ray analyses. Both changes greatly improved the resolution of the technique (Figure 1).. Ars Pharm 2005; 46 (2): 193-204..
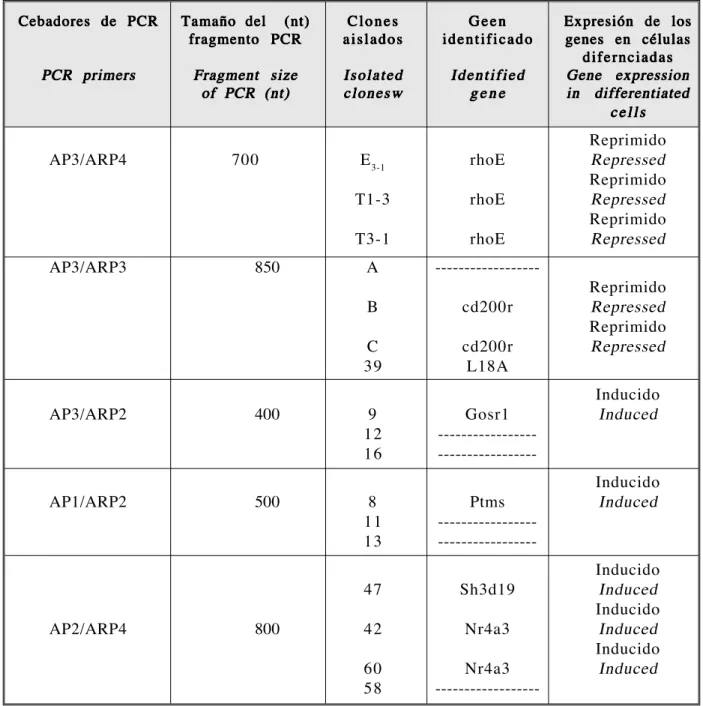
(10) 202. VIEITES JM, SÁNCHEZ-POZO A, GIL A, SUÁREZ A. TABLA 1. Resultados obtenidos en la amplificación de genes expresados diferencialmente entre el estadío proliferativo y el diferenciado en células epiteliales de intestino de rata. TABLE 1. Results obtained from the amplification of differentially expressed genes in proliferative and differentiated states, in epithelial cells of rat intestine. Cebadores de PCR. Tamaño del (nt) fragmento PCR. Clones aislados. Geen identificado. PCR primers. Fragment size of PCR (nt). Isolated clonesw. Identified gene. AP3/ARP4. 700. E 3-1. rhoE. T1-3. rhoE. T3-1. rhoE. A. ------------------. AP3/ARP3. 850. B. cd200r. C 39. cd200r L18A. AP3/ARP2. 400. 9 12 16. Gosr1 ---------------------------------. AP1/ARP2. 500. 8 11 13. Ptms ---------------------------------. 47. Sh3d19. 42. Nr4a3. 60 58. Nr4a3 ------------------. AP2/ARP4. 800. En segundo lugar, realizamos 2 reacciones de transcripción inversa y dos PCR de cada una de ellas para cada muestra. Es decir, cada muestra estaba representada por 4 reacciones de PCR, no por 2 reacciones como en todos los protocolos experimentales publicados5-7, 25,26. Para seleccionar los fragmentos de DNA de interés, empleamos un criterio de selección muy exigente: los fragmentos debían verse Ars Pharm 2005; 46 (2): 193-204.. Expresión de los genes en células difernciadas Gene expression in differentiated cells. Reprimido Repressed Reprimido Repressed Reprimido Repressed Reprimido Repressed Reprimido Repressed Inducido Induced. Inducido Induced. Inducido Induced Inducido Induced Inducido Induced. Secondly, two reverse transcription reactions and two PCR for each of these were carried out on every sample. In other words, each sample was represented by 4 PCR reactions, rather than by the 2 reactions described in published experimental protocols5-7, 25,26. In the selection process of the most interesting DNA fragments, we chose to apply very strict criteria of selection: the fragments had to be.
(11) DESARROLLO DE UN PROTOCOLO DE ANÁLISIS DE LA EXPRESIÓN GÉNICA MEDIANTE «DIFFERENTIAL DISPLAY»... THE DEVELOPMENT OF A PROTOCOL FOR THE ANALYSIS OF GENETIC EXPRESSION THROUGH «DIFFERENTIAL DISPLAY».... diferencialmente expresados en las cuatro reacciones de PCR. En tercer lugar, las bandas seleccionadas fueron recortadas y los fragmentos reamplificados para su posterior clonaje. De cada fragmento, realizamos tres clonajes independientes para comparar sus secuencias y confirmar la identidad del fragmento amplificado, datos recogidos en la Tabla 1. Los resultados de nuestras modificaciones se aprecian tanto en las imágenes de las separaciones electroforéticas (Figura 1) como en la identificación de los genes amplificados (Tabla 1). Tras realizar un conjunto de 5 reacciones de amplificación con distintos cebadores al azar (AP*) y cebadores dT (ARP*), identificamos con claridad 9 fragmentos de DNA amplificados de forma diferencial al comparar las muestras de células en proliferación con respecto a células diferenciadas (Tabla 1). Sólo 5 de ellos pudieron ser reamplificados para su clonaje por triplicado y el estudio de su secuencia. Tan sólo hubo identidad total de secuencia de los tres clones en el fragmento AP3/ARP4. El análisis bioinformático de las secuencias permitió identificar que pertenecían a RNAm transcritos a partir de varios genes (Tabla 1). La expresión diferencial de estos RNAm fue confirmada por RT-PCR semicuantitativa (datos no mostrados). En conclusión, mediante la aplicación de nuestro protocolo de DD hemos identificado una serie de genes (Tabla 1) cuya expresión está regulada durante la transición de células en proliferación a células en diferenciación en células epiteliales de intestino de rata (IEC6) diferenciadas sobre una matriz de proteínas extracelulares (MATRIGEL),. 203. differentially expressed in all four PCR reactions. Thirdly, the selected wavelengths were cut out and the fragments were re-amplified for subsequent cloning. Three different cloning processes were carried out on each fragment, as a means to comparing their sequences and confirming the identity of the amplified fragment. This data is represented in Table 1. The results of our modifications can be observed both in the images of the electrophoretic separations (Figure 1) and in the table of amplified gene identification (Table 1). After a set of 5 amplification reactions were performed with different random primers (AP*) and dT (ARP*) primers, 9 differentially amplified DNA fragments were clearly identified, when a comparison of the samples of proliferation cells and samples of differentiated cells was carried out (Table 1). Only 5 of these could be re-amplified for triplicate cloning and the study of its sequencing. There was only total sequence identity of the three clones in the fragment AP3/ARP4. The bioinformatic analysis of sequences allowed us to identify which sequence from the various genes belonged to transcribed mRNA (Table 1). The differential display of these mRNA was confirmed through semi quantitative RT-PCR (data not shown). In conclusion, the application of our DD protocol has allowed us to identify a series of genes (Table 1), whose expression is regulated, throughout the transition of cells in proliferation to cells in differentiation, in epithelial cells in rat intestine (IEC-6), that were differentiated on a extra cellular protein matrix (MATRIGEL).. BIBLIOGRAFIA/BIBLIOGRAPHY 1. H. Varmus. In oncogenes and the molecular origins of cancer. R.A. Weimberg, Ed. Cold Spring Harbor Laboratory, Cold Spring Harbor, NY, 1989;pp: 3-44 2. S.W.Lee, C.Tomasseto, R. Sager. Positive selection of candidate tumor-suppressor genes by subtractive hybridization. Proc. Natl. Acad. Sci. U.S.A.1991;88(7):2825-9 3. Kavathas P, Sukhatme VP, Herzenberg LA, Parnes JR. Isolation of the gene encoding the human T-lymphocyte differentiation antigen Leu-2 (T8) by gene transfer and cDNA subtraction. Proc Natl Acad Sci USA. 1984;81(24):768892 4. Hubank M, Schatz DG. Identifying differences in mRNA expression by representational difference analysis of cDNA. Nucleic Acids Res. 1994; 22(25):5640-8 5. Lian P, Pardee A.B. Differential display of eukaryotic messenger RNA by means of the polymerase chain reaction. Science 1992, 257: 967-971. Ars Pharm 2005; 46 (2): 193-204..
(12) 204. VIEITES JM, SÁNCHEZ-POZO A, GIL A, SUÁREZ A. 6. Bauer D. et al. Identification of differentially expressed mRNA species by an improved display technique (DDRT-PCR) Nucleic Acids Res. 1993; 21: 4272-4280 7. Lian P, Pardee A.B. Differential display methods and protocols. Methods in molecular biology. 1997 Humana Press, Totowa, New Jersey. 8. Lambrechts AC, Van't Veer LJ, Rodenhuis S. the detection of minimal numbers of contaminating epithelial tumor cells in blood or bone marrow: use, limitations and future of RNA-based methods. Ann Oncol. 1998; 9(12): 1269-76. 9. Carulli JP et al. High throughput analysis of differential gene expression. J. Cell Biochem Suppl. 1998; 30-31:286-96. 10. Hibi K et al. Serial analysis of gene expression in non-small cell lung cancer. Cancer Res. 1998; 58(24):5690-4 11. McBurney MW, Yang X, Jardine K, Cormier M. A role of RNA processing in regulating expression from transfected genes. Somat Cell Mol Genet. 1998; 24(4):203-15 12. Linskens M.H.K. et al. Cataloging altered gene expression in young and senescent cells using enhanced differential dispaly. Nucleic Acids Res. 1995; 23: 3244-3251. 13. Keshav S, McKnight AJ, Arora R, Gordon S. Cloning of intestinal phospholipase A2 from intestinal ephitelial RNA by diferential display PCR. Cell Prolif. 1997; 30(10-12):369-83 14. Gaede KI et al. Analysis of differential regulated mRNAs in monocytes cells induced by in vitro stimulation. J.Mol.Med 1999; 12: 847-852 15. Ledakis P, Tanimura H, Fojo T. limitations of diferencial display. Biochem Biophys Res Commun. 1998; 251(2):653-6 16. Mou L et al. Improvements to the differential display method for gene analysis. Biochem. Biophys. Res. Comm. 1994; 199: 564-569. 17. Chomczynski P, Sacchi N. Single-step method of RNA isolation by acid guanidinium thiocyanate-phenol-chloroform extraction. Ana Biochem. 1987; 162(1):156-9 20. Liang P, Averboukh L, Pardee AB. Distribution and cloning of eukaryotic mRNAs by means of differential display: refinements and optimization. Nucleic Acids Res. 1993; 21(14):3269-75 21. Li F, Barnathan ES, Kariko K. Rapid method for screening and cloning cDNAs generated in differential mRNA display: application of northern blot for aaffinity capturing of cDNAs. Nucleic Acids Res. 1994; 22(9):1764-5 22. Rosok O et al. Solid phase method for differential display of genes expressed in hematopoietic stem cells. Biotchniques. 1996 221(1):114-21 23. Zhao S, Ooi SL, and Pardee A.B. New primer strategy improves precisison of differential display. Biotechniques 1995; 18:842-850 24. Chen Z et al. A cautionary note on the reaction tubes for differential display and cDNA amplification in thermal cycling. Biotechniques 1994; 16:1003-1006. Ars Pharm 2005; 46 (2): 193-204..
(13)
Figure
Documento similar
dente: algunas decían que doña Leonor, "con muy grand rescelo e miedo que avía del rey don Pedro que nueva- mente regnaba, e de la reyna doña María, su madre del dicho rey,
No había pasado un día desde mi solemne entrada cuando, para que el recuerdo me sirviera de advertencia, alguien se encargó de decirme que sobre aquellas losas habían rodado
Abstract: This paper reviews the dialogue and controversies between the paratexts of a corpus of collections of short novels –and romances– publi- shed from 1624 to 1637:
Y tendiendo ellos la vista vieron cuanto en el mundo había y dieron las gracias al Criador diciendo: Repetidas gracias os damos porque nos habéis criado hombres, nos
Entre nosotros anda un escritor de cosas de filología, paisano de Costa, que no deja de tener ingenio y garbo; pero cuyas obras tienen de todo menos de ciencia, y aun
o Si dispone en su establecimiento de alguna silla de ruedas Jazz S50 o 708D cuyo nº de serie figura en el anexo 1 de esta nota informativa, consulte la nota de aviso de la
Products Management Services (PMS) - Implementation of International Organization for Standardization (ISO) standards for the identification of medicinal products (IDMP) in
This section provides guidance with examples on encoding medicinal product packaging information, together with the relationship between Pack Size, Package Item (container)
