A sliding box approach to detecting people in images of indoor environments using wide baseline stereo camera systems
183
0
0
Texto completo
(2) PONTIFICIA UNIVERSIDAD CATOLICA DE CHILE SCHOOL OF ENGINEERING. A SLIDING-BOX APPROACH TO DETECTING PEOPLE IN IMAGES OF INDOOR ENVIRONMENTS USING WIDE-BASELINE STEREO CAMERA SYSTEMS. CHRISTIAN PHILIP PIERINGER BAEZA. Members of the Committee: DOMINGO MERY ALVARO SOTO MIGUEL TORRES JAVIER RUIZ RENÉ VIDAL CRISTIAN VIAL Thesis submitted to the Office of Graduate Studies in partial fulfillment of the requirements for the Degree of Doctor in Engineering Science Santiago de Chile, January, 2015.
(3) In memory of my father, my best friend, who taught me to lift the head up, and never lose the faith ....
(4) ACKNOWLEDGMENTS. Throughout this journey, there are ties that go beyond that the process of growth as a doctoral student. What is visible and permanent are those persons with whom I shared a friendship, long hours of work, successes and failures. I want to thank my advisor Prof. Domingo Mery for relying on my work and for his tireless support during my research. He provided me with the main tools for carrying out my research and for my future challenges. Thanks to Alvaro Soto for his help in the development of the models used in this thesis and the improvements of my research skills. I also want to thank the members of the committee for supporting this proposal, and for their reviews which help me to improve this document. To my doctoral friends Billy, Vladimir, Miguel, Tomás, Hans, Pablo, Karim, and Alberto with whom I shared my work, subjects and courses. I thank you for all your friendship, support, and for showing me that when you cannot win at everything you can still laugh at everything. My family was a special support for me during this process. I thank to my mother Angélica, and my brothers Johnny and Oskar, for their prayers, support and love at distance. To my father, Jonny, who would have loved to see this work completed. I thank you for all you done and all we share. To my son, Dante, thank you to keep my feet on the ground and teach me everyday the simple things of the life. To Laura, thank you to show me the world with a smile. And I specially thank so much to my wife, Isabel, for her unconditional support and love. Thank you for trusting in my decision and accompanying me in this adventure.. iv.
(5) Contents. ACKNOWLEDGMENTS . . . . . . . . . . . . . . . . . . . . . . . . . . . . . . . . . .. iv. List of Figures . . . . . . . . . . . . . . . . . . . . . . . . . . . . . . . . . . . . . . . .. viii. List of Tables . . . . . . . . . . . . . . . . . . . . . . . . . . . . . . . . . . . . . . . .. xv. RESUMEN . . . . . . . . . . . . . . . . . . . . . . . . . . . . . . . . . . . . . . . . .. xvi. ABSTRACT . . . . . . . . . . . . . . . . . . . . . . . . . . . . . . . . . . . . . . . . . xviii INTRODUCTION . . . . . . . . . . . . . . . . . . . . . . . . . . . . . . .. 1. 1.1.. Hypothesis . . . . . . . . . . . . . . . . . . . . . . . . . . . . . . . . . . . . .. 4. 1.2.. Objectives . . . . . . . . . . . . . . . . . . . . . . . . . . . . . . . . . . . . .. 5. 1.2.1.. General Objective . . . . . . . . . . . . . . . . . . . . . . . . . . . . . . .. 6. 1.2.2.. Specific Objectives . . . . . . . . . . . . . . . . . . . . . . . . . . . . . . .. 6. 1.3.. Summary of Contributions . . . . . . . . . . . . . . . . . . . . . . . . . . . . .. 7. 1.4.. Document Organization . . . . . . . . . . . . . . . . . . . . . . . . . . . . . . .. 7. BACKGROUND . . . . . . . . . . . . . . . . . . . . . . . . . . . . . . . .. 9. Image Features . . . . . . . . . . . . . . . . . . . . . . . . . . . . . . . . . . .. 9. 2.1.1.. Sparse Local Sampling . . . . . . . . . . . . . . . . . . . . . . . . . . . . .. 10. 2.1.2.. Dense Sampling . . . . . . . . . . . . . . . . . . . . . . . . . . . . . . . .. 12. Classification Methods . . . . . . . . . . . . . . . . . . . . . . . . . . . . . . .. 15. 2.2.1.. Support Vectors Machines . . . . . . . . . . . . . . . . . . . . . . . . . . .. 16. 2.2.2.. Boosting Classifiers . . . . . . . . . . . . . . . . . . . . . . . . . . . . . .. 16. People Detection . . . . . . . . . . . . . . . . . . . . . . . . . . . . . . . . . .. 17. 2.3.1.. Single View Approaches . . . . . . . . . . . . . . . . . . . . . . . . . . . .. 17. 2.3.2.. Multiple View Approaches . . . . . . . . . . . . . . . . . . . . . . . . . . .. 19. 2.3.3.. Related Approaches for Detection . . . . . . . . . . . . . . . . . . . . . . .. 21. 2.4.. Non-Maximal Suppression . . . . . . . . . . . . . . . . . . . . . . . . . . . . .. 25. 2.5.. Focus-of-Attention . . . . . . . . . . . . . . . . . . . . . . . . . . . . . . . . .. 26. 2.6.. Discussion . . . . . . . . . . . . . . . . . . . . . . . . . . . . . . . . . . . . .. 30. Chapter 1.. Chapter 2. 2.1.. 2.2.. 2.3.. v.
(6) PROPOSED APPROACH . . . . . . . . . . . . . . . . . . . . . . . . . . .. 33. 3.1.. Spatial Focus-of-attention . . . . . . . . . . . . . . . . . . . . . . . . . . . . . .. 36. 3.2.. Multi-view Projection . . . . . . . . . . . . . . . . . . . . . . . . . . . . . . . .. 37. 3.3.. Feature Extraction . . . . . . . . . . . . . . . . . . . . . . . . . . . . . . . . .. 41. 3.4.. Multiple View Classifier . . . . . . . . . . . . . . . . . . . . . . . . . . . . . .. 44. 3.4.1.. Ensemble of Features . . . . . . . . . . . . . . . . . . . . . . . . . . . . .. 45. 3.4.2.. Ensemble of Classifiers . . . . . . . . . . . . . . . . . . . . . . . . . . . .. 46. 3.4.3.. Bootstrap Training . . . . . . . . . . . . . . . . . . . . . . . . . . . . . . .. 48. 3.4.4.. Best Collection of Aspects . . . . . . . . . . . . . . . . . . . . . . . . . . .. 49. Non Maximal Suppression . . . . . . . . . . . . . . . . . . . . . . . . . . . . .. 50. METHODOLOGY AND IMPLEMENTATION . . . . . . . . . . . . . . . .. 54. 4.1.. Hardware . . . . . . . . . . . . . . . . . . . . . . . . . . . . . . . . . . . . . .. 54. 4.2.. Datasets Details . . . . . . . . . . . . . . . . . . . . . . . . . . . . . . . . . . .. 54. 4.2.1.. Train Dataset . . . . . . . . . . . . . . . . . . . . . . . . . . . . . . . . . .. 55. 4.2.2.. Test Dataset . . . . . . . . . . . . . . . . . . . . . . . . . . . . . . . . . .. 58. Evaluation Methodology . . . . . . . . . . . . . . . . . . . . . . . . . . . . . .. 59. 4.3.1.. Detection Evaluation . . . . . . . . . . . . . . . . . . . . . . . . . . . . . .. 60. 4.3.2.. Heat Maps . . . . . . . . . . . . . . . . . . . . . . . . . . . . . . . . . . .. 61. 4.3.3.. Per-Windows Evaluation . . . . . . . . . . . . . . . . . . . . . . . . . . . .. 61. Publications . . . . . . . . . . . . . . . . . . . . . . . . . . . . . . . . . . . . .. 61. 4.4.1.. Flaws Detection . . . . . . . . . . . . . . . . . . . . . . . . . . . . . . . .. 62. 4.4.2.. Head Modeling. . . . . . . . . . . . . . . . . . . . . . . . . . . . . . . . .. 63. 4.4.3.. Head Detection Using Sliding-Boxes In Multiple Views . . . . . . . . . . . .. 64. Chapter 5.. EXPERIMENTS AND RESULTS . . . . . . . . . . . . . . . . . . . . . . .. 66. 5.1.. Implementation Details . . . . . . . . . . . . . . . . . . . . . . . . . . . . . . .. 66. 5.2.. Detection Performance . . . . . . . . . . . . . . . . . . . . . . . . . . . . . . .. 67. 5.3.. Enriched features . . . . . . . . . . . . . . . . . . . . . . . . . . . . . . . . . .. 79. 5.4.. Focus-of-Attention . . . . . . . . . . . . . . . . . . . . . . . . . . . . . . . . .. 79. 5.5.. Using of Geometrical Cues to Detection . . . . . . . . . . . . . . . . . . . . . .. 81. DISCUSSION . . . . . . . . . . . . . . . . . . . . . . . . . . . . . . . . .. 85. Chapter 3.. 3.5.. Chapter 4.. 4.3.. 4.4.. Chapter 6.. vi.
(7) 6.1.. Conclusions . . . . . . . . . . . . . . . . . . . . . . . . . . . . . . . . . . . . .. 85. 6.2.. Future Work . . . . . . . . . . . . . . . . . . . . . . . . . . . . . . . . . . . .. 89. References . . . . . . . . . . . . . . . . . . . . . . . . . . . . . . . . . . . . . . . . . .. 92. APPENDIX A.. Flaw Detections In Aluminium Die Casting . . . . . . . . . . . . . . . .. 112. APPENDIX B.. Head Modeling . . . . . . . . . . . . . . . . . . . . . . . . . . . . . .. 126. APPENDIX C.. Head Detection Using Sliding-boxes in Multiple Views . . . . . . . . . .. 137. vii.
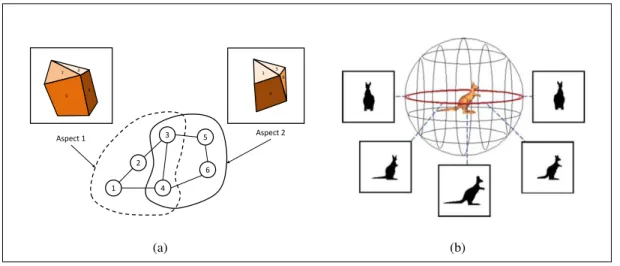
(8) List of Figures. 1.1. General framework and flow of visual surveillance based on image processing. This process involves N cameras and six optional steps for each device. Approaches based on background subtraction involve steps related to environmental modeling and motion segmentation. The fusion of information follows from any of these six steps. . . . . .. 1.2. 2. Diagram of the proposed approach for detecting people in a multiple view configuration. Our approach requires N calibrated cameras C1 , . . . , CN . In this example the sliding-box B runs through various positions (X, Y, Z), scanning the entire space S of the scene in which heads could be located. The sliding-box B is projected from 3D space onto images I1 , . . . , IN , retrieving N detection windows Wi1 , . . . , WiN . Using 3D information allows us to directly scan the image at a suitable scale for human heads. . . . . . . . . . . .. 2.1. 6. Examples of image sampling methods. (a) sparse local sampling: image regions are selected using a salient region detector. (b) dense representation: the image is sampled using a dense grid. . . . . . . . . . . . . . . . . . . . . . . . . . . . . . . . . . . .. 2.2. 10. Examples of methods for sampling images. (a) Multi-scale pyramid decomposition sampling strategy: the image is downsampled and smoothed at every level and then sampled at smaller subregions. (b) Spatial pyramidal decomposition strategy: the image is sampled at smaller subregions by dividing the image until a maximum number of levels is achieved. . . . . . . . . . . . . . . . . . . . . . . . . . . . . . . . . . . . . . . .. 2.3. 15. Examples of an aspect-graph. (a) Two views or aspects of a polyhedral object. These aspects correspond to projected faces, which form a graph according with their adjacency, i.e., faces 1, 2, and 4 in the Aspect 1 appear connected because they are adjacent. (b) The viewing sphere sampled at regular intervals. During sampling, images are captured every five degrees. An iterative procedure combines views into aspects using prototypes which represent each aspect. . . . . . . . . . . . . . . . . . . . . . . . . . . . . . . . . .. 3.1. 23. (a) Example of the aspects collected from multiple view projections using our proposed approach 1. The set of projections form a collection of aspects of the head. We use this projection strategy to collect all of the information available from all of the viewpoints in viii.
(9) the camera system. (b) Block diagram of the proposed method. Our approach includes five main steps: spatial focus-of-attention, multi-view projection, feature extraction, classification and non-maximal suppression. In the example, we use N = 4 cameras. The algorithm begins with an input scene composed of I1 , . . . I4 images. Then, the spatial focus-of-attention reduce the number of head hypotheses. Next, the algorithm computes the projections of the box Bi onto the image Ij as Wij , forming a collection of aspects. Afterwards, we extract a set of features for each projection Wij and apply the model for sequences. Finally, a spatial NMS procedure allows us to eliminate multiple detections. 3.2. 35. Explanation of the focus-of-attention procedure. (a) Blue dots show the potential head positions detected by our focus-of-attention procedure. This process provides hypotheses with more likely location of heads within the region of interest S and helps us to drastically filter the spatial detections. (b) Yellow circles shows ground-truth heads examples within the subspace S. . . . . . . . . . . . . . . . . . . . . . . . . . . . . . . . . . . . . .. 3.3. 37. Shows the triangulation between head hypotheses from two images I1 and I2 at different viewpoints. Hypotheses {h11 , h21 , h31 } in image I1 generate epipolar lines l1 , l2 and l3 in image I2 . The pairs set of head hypotheses {h11 , h12 } and {h21 , h22 } share the same 3D position M̂1 and M̂2 , respectively. We estimate these spatial positions by triangulation using least square minimization along the ray hij Ci . Due to there are no head hypothesis near to epipolar line l3 , the h31 do not generate potential head position. . . . . . . . .. 3.4. 38. Projection diagram of a sphere quadric Q defined on Mi with radius r. In this example, for N = 4, Q is projected onto the images I1 , . . . I4 as a conic C. The projections Wij are defined as the maximum quadrilateral subscribed over C and showed as dashed red circles in this figure. The elements Wij represent the projection of Bi onto the camera j. All of these elements define a collection of aspects which represents the box Bi seen from each camera. Each element Wij was cropped and then rescaled to 64 × 64 pixels before feature extraction to cope with projection at different size. . . . . . . . . . . .. 3.5. 41. Diagram of the space of interest S inside of a room and defined as parallelepiped with set of boundaries [Xa , Xb ]; [Ya , Yb ]; [Za , Zb ]. We use this contextual information to limit the action of our sliding-box Bi within the space S. This allows to us to search for people’s heads in areas in which they are likely to appear according to the context. . . . . . . .. 42 ix.
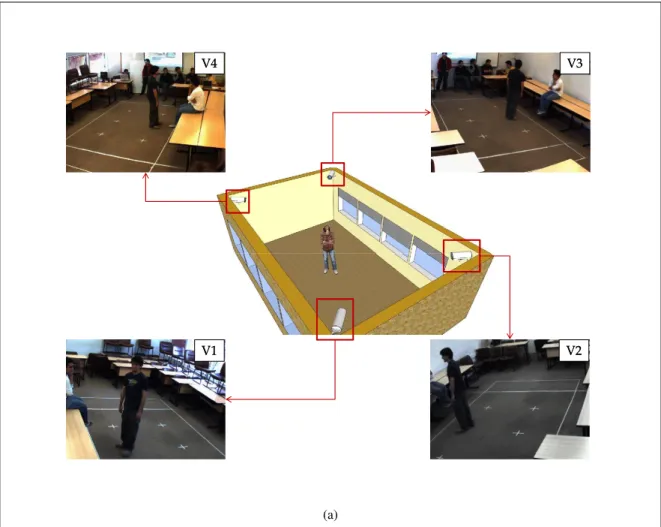
(10) 3.6. Example of the pyramidal feature extraction on a Wij patch. Features are computed in l = 0, 1, 2 levels of the image patch. In each level, the image has 4l cells. The final descriptor has Nf = 59 × (1 + 4 + 16) = 1, 239 bins. . . . . . . . . . . . . . . . .. 3.7. 43. Example of the pyramidal feature extraction on a Wij patch. Features are computed in l = 0, 1, 2 levels of the image patch. In each level, the image has 4l cells. The final descriptor has Nf = 59 × (1 + 4 + 16) = 1, 239 bins. . . . . . . . . . . . . . . . .. 3.8. 44. Training process diagram of features ensemble scenario. Once we extract features from each element Wij , we concatenate all of the Nf features in a single descriptor with Ns bins. We use a single SVM classifier to learn a model βf e using examples of head sequences. . . . . . . . . . . . . . . . . . . . . . . . . . . . . . . . . . . . . . . .. 3.9. 47. Training process diagram for the classifier ensemble scheme. We use an ensemble of classifiers divided into two layers: (a) shows the first layer, which is formed by multiclass SVM classifiers. This layer can identify frontal head, rear head, and background. (b) shows the second layer, which is trained using the scores (fβ1 , . . . , fβk ) obtained by applying the first layer of classifiers to each element Wij . This process yielded the model β, which can classify the image sequence. . . . . . . . . . . . . . . . . . . . . . . .. 49. 3.10 Diagram of best collection searching. The algorithm receives an input collection of aspects without a priori knowledge about its correct alignment. We apply a set of circular shifts to generate the total number of four collections of aspects, including the input collection. After applying the multiple view classifier to each collection, we choose the most confident one using an argmax criterion. In the diagram, the multiple view classifier assigns a set of confidence values to each collection of aspects: fβ (x0i ) = −1.25,. +2 0 fβ (x+1 i ) = −0.12, fβ (xi ) = 1.75, fβ (xi ) = 0.75. Finally, our algorithm selects the. collection of aspects generated with the second shift because it best matches the training samples. . . . . . . . . . . . . . . . . . . . . . . . . . . . . . . . . . . . . . . . . 4.1. 51. We mounted four Point Grey Flea2 cameras in a classroom to simulate an indoor environment where we could detect people. The four cameras were calibrated to ensure the geometric reconstruction of 3D points and synchronized to acquire the images at same time. . . . . . . . . . . . . . . . . . . . . . . . . . . . . . . . . . . . . . . . . . .. 55 x.
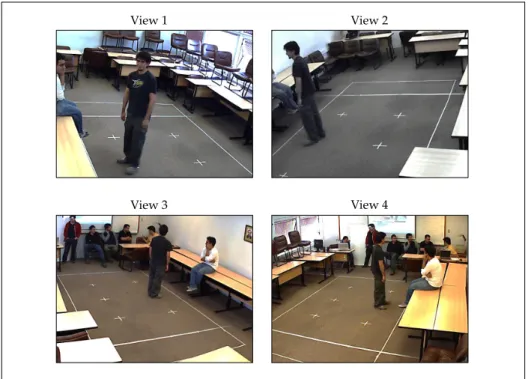
(11) 4.2. Example of our GUI for labeling a set of four images representing the same scene at different viewpoints. A head is labeled selecting two matching points and we estimate its 3D location throughout the geometric model. This location is re-projected onto the images as bounding boxes which represent the head in all viewpoints. . . . . . . . . .. 4.3. 56. Example of images collected for training. Each image comes from one view in the camera system. People stand over the white crosses on the floor and spin around their Z axis to generate various views of the head.. 4.4. . . . . . . . . . . . . . . . . . . . . . . . . . .. 57. Examples of aspects collection used for training. (a) positive instance of people’s head retrieved from multi-view camera system and (b) background samples of classroom environment. We used four cameras in both examples, where j = 1, . . . , 4 . . . . . .. 4.5. 58. Example of images collected for testing. Both test datasets contain images of people in a classroom at different activity levels and under various occlusion conditions. (a) The first test sequence contains people moving and changing their appearances. (b) The second test sequence consists of people sitting observing a lecture. Their appearances change less than the first sequence, and although there is occlusion, it is less frequent. . . . . . . .. 4.6. 59. Example of heat map used to analyze the most frequently visited areas. This map shows a top-view of the classroom used for our experiments. Pseudo color indicates the number of detections at each location. Red areas are equivalent to a high number of detections, blue areas point a low number of detections. Similar as we describe in Fig. 3.5, the space of interest S is limited by the yellow square. The dashed region marks the space that we do not take into account during detection. . . . . . . . . . . . . . . . . . . . . . . .. 4.7. 62. Concept testing for our approach, applied to flaws detection in aluminum die casting. We build a flaw sequence using 72 images in a calibrated multiple view system. The classifier learns from simulated flaw sequences and identifies flaws on real images. . . . . . . .. 5.1. Summary of the head model that the DPM learns after training. (a) Example of the model, its gradient map, and parts. (b) Example of detections after applying the model over test images. .. 5.2. 64. 68. Precision-Recall curves comparison of detection performance in sequence sq-01. We compare performances of our methods EF, OVA-EC, and OVO-EC versus performance of single view DPM and the epipolar version of DPM. In general we report high performance level of our OVO-EC approach. The overall performance is represented using the AP xi.
(12) value. (a) Performance evaluation using LMS-NMS. Although detectors performed well, the DPM performed best overall. Our approach based on a one-vs-one ensemble of classifier presented the best performance. We note an improvement in precision on the last part of the curve that allowed to our method to maintain its level of precision at the same recall rates as DPM. (b) Performance evaluation using NMS based in mean-shift procedure. In this case, our approach based on a OVO-EC of classifier performed best. We observed the same improvement in precision on the last part of the curve, but in this case it was more noticeable. In both curves, DPM using epipolar geometry showed marginal improvement after recall of 0.85. This may be due to the way that epipolar geometry helps to eliminate false detections. . . . . . . . . . . . . . . . . . . . . . . . . . . . 5.3. 71. Precision-Recall curves comparison of detection performance in dataset sq-02. Comparisons include our three methods EF, OVA-EC, and OVO-EC versus performance of single view DPM detector and the epipolar version of DPM. In general we report best performance level in the OVO-EC approach. The overall performance is represented using the AP value. (a) Performance evaluation using NMS based on greedy procedure. The three multiple view detectors performed at similar similar levels. All of them outperform the DPM detector in its two versions. Our approach based on a OVO-EC yielded the best performance as in sq-01. We note improvements in precision on the last part of the curve which allowed our method to maintain a level of precision at the same recall rates as DPM. (b) Performance evaluation using NMS based on mean-shift procedure. Our approach based on a one-vs-one ensemble of classifiers performed best. The same improvements in precision are present. In both curves, DPM detector using epipolar geometry does not show an improvement. This may be due to the fact detections near to same epipolar lines are eliminated. . . . . . . . . . . . . . . . . . . . . . . . . . . . . . . . . . . . . .. 5.4. 72. Heat-map of detections using our three detection approaches in sequence sq-01 after applying WMS-NMS and LMS-NMS. Left column are detection using WMS-LMS and right column are detection using LMS-NMS. (a) Heat-map of the ground-truth. (b) and (c) Heat-maps of detections using the EF approach. (d) and (e) Heat-maps of detection using OVA-EC. (f) and (g) Heat-maps of detection using OVO-EC. . . . . . . . . . .. 5.5. 75. Heat-map of detections using our three detection approaches in sequence sq-02 after applying WMS-NMS and LMS-NMS. Left column are detection using WMS-LMS and xii.
(13) right column are detection using LMS-NMS. (a) Heat-map of the ground-truth. (b) and (c) Heat-maps of detections using the EF approach. (d) and (e) Heat-maps of detection using OVA-EC. (f) and (g) Heat-maps of detection using OVO-EC. . . . . . . . . . . 5.6. 76. Detections comparison using WMS-NMS. (a) Detections provided by DPM detector. (b) Detections generated by OVA-EC approach. (c) Detections yielded by OVO-EC approach. (d) Detections generated by applying the EF method. We display detections in red boxes and ground-truth heads in green boxes. The results show that our methods can retrieving heads that the 2D detector missed. Although we retrieve new heads, we also add some noisy detections. . . . . . . . . . . . . . . . . . . . . . . . . . . . . . . . . . . . .. 5.7. 77. Detections examples using NMS based on mean-shift. (a) Detections provided by LatentSVM detector. (b) Detections generated using OVA-CE. (c) Detections yielded by OVOCE. (d) Detections yield by applying FE method. Detections appear as red boxes and ground-truth heads as green boxes. The results show most of the heads missed by the 2D detector were retrieved by our multiple view detector. Although we retrieve new heads we also add some noisy detections due to hallucinations of the classifier. . . . . . . .. 5.8. 78. Performance comparison in per-windows classification. The curves show performance evolution as we add information from the four visual sources of our camera system. (a) precision-recall curve of ensemble of features. This method presents an improvement in performances after the third camera is included, which is the view that includes information about the rear of the head. We conclude that the additional viewpoint contributes to improving the performance. (b) The precision-recall curve of ensemble of classifiers using a one-vs-all strategy. (c) The precision-recall curve of ensemble of classifiers using a one-vs-one strategy. These second method presents improved performance as we add a new viewpoint. It is smoother that the improvement presented by ensemble of features. Overall performance is represented using the AP value. High AP values are yield by all methods when we use the four cameras.. 5.9. . . . . . . . . . .. 80. Sensitivity analysis of confidence vs recall due to use of the spatial focus-of-attention procedure. There is a trade-off between detector sensitivity and the maximum recall reached upstream of the classifier. If we set a low sensitivity for the detector, we increase the ability of the focus-of-attention to retrieve all detections in the scene. Even though a xiii.
(14) low confidence threshold produces more spatial hypotheses and increases the burden for other procedures, it is always better use the focus-of-attention than to run the sliding-box across the entire region of interest S. (a) shows sensitivity for sequence sq-01 where the maximum recall appears to fall between 0 and −0.4 of detector confidence. (b) shows sensitivity for sequence sq-02 where the maximum recall appears to be between −0.4 and −0.7 of detector confidence. . . . . . . . . . . . . . . . . . . . . . . . . . . . . . .. 82. 5.10 Examples of focus-of-attention computed within the region of interest S using the outputs provided by an interest-point detector. The head hypotheses appear as grey circles and the ground-truth as green stars. In accordance with our experiments, the spatial focusof-attention recover most of the ground-truth elements. Though it adds an overhead, it is always better use the focus-of-attention than to run the sliding-box across the region S. Left column shows focus-of-attention build setting a low threshold in the inters-point detector. Right the focus-of-attention using a higher threshold. . . . . . . . . . . . .. 83. 5.11 Random sample of 60 windows evaluated: (a) by a 2D detector, and (b) by our approach. In (a), windows must change their size in order to predict the real size of the object. We improve the search by using the real size of the object what limit to the size and locations of the projected windows, as shown in (b). . . . . . . . . . . . . . . . . . . . . . . . . . . . . . . . .. 84. 5.12 Alignment test of collection of aspects. The figure shows the results of using sliding-box to evaluate among a set of hypotheses and their scores. Box scores are high when the box belongs to the head class, and its projections yield better alignment, as shown in (a) and (b). In (c) we observe background examples and their scores, all of which were negatives. 84. xiv.
(15) List of Tables. 4.1. Details about the training dataset used to train the feature ensemble. Each instance is a collection of aspects, as shown Fig. 4.4 . . . . . . . . . . . . . . . . . . . . . . . . . . . . . . .. 57. 4.2. Details about the training dataset used for training individual models. . . . . . . . . . . . .. 58. 4.3. Details about test dataset used for testing the detector. Sequences were called sq-01 and sq-02. We show an average number of people per image and the total number of frames in each sequence.. 5.1. Repeatability analysis of our three approaches in dataset sq-01. Results show little variation after detection. All methods show significance over the 95% of confidence level. . . . . . . . . .. 5.2. 73. Repeatability analysis of our three approaches in dataset sq-02. The results show little variation in detection that passes the 95% of confidence level. . . . . . . . . . . . . . . . . . . . . .. 5.3. 59. 73. Summary of the burden reduction due to the spatial focus-of-attention. Although there is an overhead due to applying an interest-point detector, it is always better use this procedure than perform an exhaustive search across the region of interest. . . . . . . . . . . . . . . . . .. 81. xv.
(16) PONTIFICIA UNIVERSIDAD CATÓLICA DE CHILE ESCUELA DE INGENIERÍA. UN ENFOQUE DE VOLÚMENES DESLIZANTES PARA LA DETECCIÓN DE PERSONAS EN IMÁGENES DE AMBIENTES INTERIORES USANDO UN SISTEMA MULTICÁMARAS Tesis enviada a la Dirección de Postgrado en cumplimiento parcial de los requisitos para el grado de Doctor en Ciencias de la Ingenierı́a. CHRISTIAN PHILIP PIERINGER BAEZA RESUMEN En las últimas dos decadas ha aumentado masivamente el uso de cámaras en sistemas de vigilancia y monitoreo de actividades, haciendo difı́cil su seguimiento el 100% del tiempo por operadores humanos. La detección de personas ha provocado gran interés en investigadores de la comunidad de visión por computador, con el fin de generar herramientas de vigilancia automática. Los primeros trabajos de detección se basaron fuertemente en técnicas de procesamiento de imágenes, las que a pesar de su rapidez y simplicidad son sensibles a los cambios de iluminación, oclusión, y variación de las poses humanas. Actualmente, los enfoques de aprendizaje de máquina basados en ventanas deslizantes han tenido éxito significativo en la detección de personas. Este éxito se debe en parte al uso de poderosos modelos de aprendizaje de máquina, caracterı́sticas visuales nuevas y más informativas y modelos basados en partes capaces de manejar la variabilidad de los objetos. Un denominador común de estas técnicas es que ellos confian principalmente en métodos de aprendizaje estadı́stico que usa información de la intensidad de las imágenes para capturar las caracterı́sticas de apariencia de los objetos. Una limitación importante de estos enfoques basados en apariencia es que no incorporan información geométrica relevante que provea pistas espaciales tales como el tamaño real de los objetos a detectar, profundidad o la ubicación más probable de estos objetos en la escena. Algunos trabajos recientes consideran el beneficio de incorporar información de varios puntos de vista. La detección usando una sola cámara es apropiada cuando existe occlusión leve, sin embargo, para casos de mayor oclusión el uso de múltiples vistas permite mejorar la detección.. xvi.
(17) A pesar de que existen técnicas para relacionar la información en múltiples vistas, aún quedan desafı́os importantes que resolver. En esta tesis, proponemos un enfoque para detección de personas que une avances en detección basada en aprendizaje de máquina con geometrı́a de múltiples vistas. La idea principal de nuestro método es barrer un volumen virtual a través del espacio con el fin de analizar solo la parte de las imágenes donde este elemento es proyectado. Este esquema nos permite resolver problemas relacionados al establecimiento de correspondencias entre cámaras, incluir información espacial, y enriquecer los modelos de detección usando caracterı́sticas enriquecidas. Este documento describe nuestro enfoque y su evaluación en detección de personas en ambientes interiores. Los experimentos demuestran que nuestro método mejora detectores 2D del estado del arte en 10% respecto del precision-recall promedio de su mejor vista, usando iguales condiciones de entrenamiento. Los resultados muestran que nuestro enfoque puede ser usado efectivamente para detección de personas en sistemas de múltiples vistas. Palabras Claves: detección de personas, ventanas deslizantes, ambientes interiores, múltiples vistas, red de cámaras, SVM.. Miembros de la Comisión de Tesis Doctoral DOMINGO MERY ALVARO SOTO MIGUEL TORRES JAVIER RUIZ RENÉ VIDAL CRISTIAN VIAL. Santiago, January, 2015. xvii.
(18) PONTIFICIA UNIVERSIDAD CATÓLICA DE CHILE COLLEGE OF ENGINEERING. A SLIDING-BOX APPROACH TO DETECTING PEOPLE IN IMAGES OF INDOOR ENVIRONMENTS USING WIDE-BASELINE STEREO CAMERA SYSTEMS Thesis submitted to the Office of Graduate Studies in partial fulfillment of the requirements for the Degree of Doctor in Engineering Sciences by CHRISTIAN PHILIP PIERINGER BAEZA ABSTRACT Over the past two decades, there has been a massive increase in the use of digital cameras in surveillance systems and monitoring activities. This has made it difficult for human operators to provide 100% coverage at all times. The ability to detect human forms in video images has generated a great deal of interest among researchers in the computer vision community who are working on the design of automatic visual surveillance tools. Previous studies of this topic were strongly based on image processing techniques, which in spite off their speed and simplicity are sensitive to changes in lighting, occlusion and the variability of human poses. Recently, machine learning approaches based on sliding windows have proven to be successful in people detection. This significant success is due in part to the use of powerful machine learning models, new and more informative visual features, and part-based models which cope with object variability. A common denominator of these techniques is that they rely mainly on statistical learning methods that exploit image-intensity information to capture object appearance features. An important limitation of appearance-based approaches is that they do not incorporate relevant geometric information that can provide important, useful spatial cues such as the real size of the object to be detected, depth, and likely spatial appearance location in the scene. A few recent works consider the benefits of including information from various viewpoints. Detection using one camera is suitable when there is mild occlusion, however, if there is heavy occlusion multiple views help to improve final detection. Despite the existence of techniques for linking information across multiple views, significant challenges remain. In this thesis, we propose a multiple view detection approach in order to bridge xviii.
(19) the gap between advances in machine learning-based object detection and multiple view geometry. The key idea is to run a virtual volume across the space in order to analyze only the corresponding portion of the images where this 3D element is projected. This allows us to solve problems related to correspondence among cameras. We also can include useful spatial cues and enhance detection models with enriched features descriptors. This document describes our approach to people detection in video images of indoor environments and its evaluation. The experiments show that our framework improves detection levels of 2D state-of-the-art methods in 10% of the average precision-recall at their optimal view using the same training conditions. These results suggest that our approach can be used effectively to detect objects in multiple views.. xix.
(20) Chapter 1. INTRODUCTION. Over the past two decades, there has been an increase in the number of digital video cameras used in security and monitoring systems. The early devices were only used in private surveillance and retail environments. Over time, their applications shifted towards the area of public space surveillance (Kuno et al., 1996; Dee & Velastin, 2007). Initially, security personnel could monitor these devices easily due to the small number of cameras used. However, the intensive use of these devices has made it impractical to depend on human operators to provide all monitoring services all of the time. Two main factors limit the practicality of the exclusive use of human monitoring: the amount of information gathered and limited attention spans and concentration. The use of techniques from the fields of image processing, computer vision and machine learning has allowed for the design of intelligent systems which help operators engage in automated monitoring using visual information. According to Hu et al. (2004); Valera and Velastin (2005); Cristani et al. (2010), the basic elements of an automated vision system are the environment model and motion segmentation, object detection or object classification, tracking, behavior interpretation and personal identification, and fusion of information from multiple cameras (see Fig. 1.1). The major tasks developed for these systems are people and object detection, detection of abandoned objects, and the tracking of specific subjects (Hu et al., 2004). The goal is to generate complex information about scenes such as the number of people present, the identities of those individuals, activity and behavior recognition, borders of hazardous or forbidden areas, and flow analysis. One important aspect of this field of inquiry is the evaluation of these systems. Influential conferences such as PETS, CREDS, i-LIDS, ETISEO, and PASCAL have set forth metrics which allow researchers to compare their algorithms performance (Dee & Velastin, 2007). Early work on detection was strongly based on image processing techniques. The main task at that time was to separate foreground objects from the background. The essential stage of the identification of these elements is the background subtraction process. Once this segmentation is complete, the objects appear as blobs that can be classified according to shape, color, movement or another distinctive feature. Because the segmentation process uses consecutive frames, this approach is commonly used in video sequences. The most frequently cited studies for background subtraction address frame differences, Gaussian moving average Wren et al. (1997), mixture of. 1.
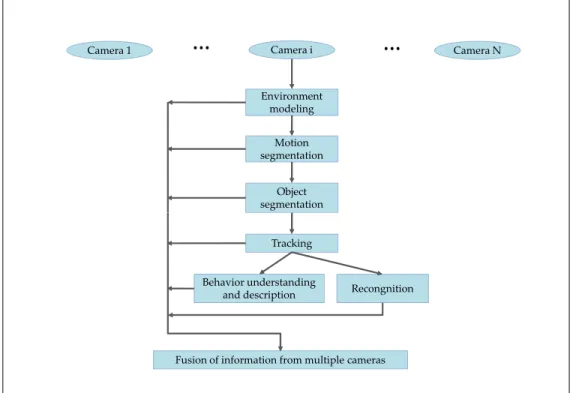
(21) Camera 1. …. Camera i. …. Camera N. Environment modeling Motion segmentation Object segmentation Tracking Behavior understanding and description. Recongnition. Fusion of information from multiple cameras 70. Figure 1.1. General framework and flow of visual surveillance based on image processing. This process involves N cameras and six optional steps for each device. Approaches based on background subtraction involve steps related to environmental modeling and motion segmentation. The fusion of information follows from any of these six steps.. Gaussians Stauffer and Grimson (1999), temporal median filter Lo and Velastin (2001), and codebook models Kim et al. (2005). Background subtraction is a simple and computationally efficient method, but it requires background initialization and background updating. Its main challenges and drawbacks are related to objects that have moved, time of day, light changes, oscillating objects, occlusions or camouflage, bootstrapping, foreground aperture, sleeping foreground or persistent objects, shadows, and reflections (Cristani et al., 2010). A new generation of algorithms based on machine learning techniques is addressing the task of detecting people in static or still images. These methods have received a great deal of attention due to their performance level and the independence of the segmentation processes, which is sensitive to lighting changes. This significant progress in people detection is due in part to the use of powerful machine learning models, new more informative visual features, and part-based models which cope with the objects variability (Viola et al., 2005; Dalal & Triggs, 2005; Felzenszwalb et al., 2009; Girshick et al., 2014; Dean et al., 2013). In general, these algorithms use a sliding-window approach 2.
(22) to sample the input image at several scales. Then every window is represented by a set of features or measurements coded as a vector that describes shape, color, texture, etc. Afterwards, windows are classified according to an object target class using a previously learned model. Finally, a nonmaximal suppression step avoids the multiple detections. The most successful detection algorithms use local descriptors in order to extract global and local spatial information from each instance and to cope better with inter-class variability (Ojala et al., 2000; Lowe, 2004; Mikolajczyk & Schmid, 2004; Dalal & Triggs, 2005; Lazebnik et al., 2006; Bosch et al., 2007). Though most of this algorithms have a high computational demand during training, some allow for real-time detection and can be used through frames in video sequences. As stated in Dollar et al. (2011), although there have been some detection improvements the overall performance is still poor. A common denominator of those techniques is that they mainly rely on statistical learning methods that exploit image-intensity information to capture object appearance features. Their goal is to uncover visual spaces where visual similarities carry enough information to achieve robust visual recognition. As a relevant limitation, appearance-based approaches do not incorporate relevant geometric information that can provide useful and relevant spatial cues such as the real size of the object to be detected, depth, and spatial likely appearance location. There are some notable exceptions of approaches that combine detection based on machine learning algorithm with additional spatial information about the objects in order to discard false detections (Helmer & Lowe, 2010; Salas & Tomasi, 2011; Spinello & Arras, 2011; Espinace et al., 2013). Results show that there have been improvements in regard to recovering the spatial information lost during image acquisition. Though they do have some advantages, these methods are focused on mobile robots and require supplementary hardware such as stereo and depth cameras to recover these cues. The large number of cameras installed today makes it possible to obtain information from different viewpoints simultaneously and to exploit the same spatial cues, establishing relationships across the views in a camera system. This provides opportunities to combine and integrate information from various visual sources. Detection using one camera is suitable when there is mild occlusion, but in situation of heavy occlusion the relationships between multiple views contributes to identify targets across views when the visual appearance alone is insufficient (Mittal & Davis, 2003; Khan & Shah, 2006; Eshel & Moses, 2010; Liem & Gavrila, 2013; M. Song et al., 2013). Some researchers have proposed. 3.
(23) using geometric techniques to establish relationships across views in a camera network, providing efficient ways to combine and integrate this information (Szeliski, 2010). Detection in multiple camera configuration present two main challenges. On the one hand, there are practical constraints related to the establishment of correspondence between observations when the appearance of the target object change drastically among viewpoints. And on the other hand, difficulties arise in non-overlapped configurations when similar appearances are simultaneously present in the camera network (M. Song et al., 2013). Although there are well-established detection approaches based on machine learning techniques, the current methods still present several drawbacks that must be overcome. On the one hand, we observe that in general single view approaches to detecting people or objects mainly i) use a sliding-window at various scales to compensate scale changes of the object target class in images that produces false positives due to hallucinations at several scales; ii) do not take into account the use of additional cameras to improve the overall detection; and iii) do not take into account useful 3D information such as real sizes of people or objects, and the positions in which the target object classes are likely to be found at the scene. On the other hand, wide baseline stereo systems present limitations related to correspondence matching in cases in which the same object has various poses or variations simultaneously. We address some of these issues by proposing an approach based on the idea of enhancing the total amount of information available in a camera system, and using the advantages from machine learning and multiple view geometry.. 1.1. Hypothesis Computer vision applications based on multiple views use geometric rules to determine the structure of the scene. This set of rules allow us to establish relationships among the elements in each view of the camera system. It can be also generated using prior knowledge from the vision system itself such as its projection matrices and a calibration model, or they can also be estimated using landmarks from the scene. However in this last case, the metric information cannot not be directly recovered (Hartley & Zisserman, 2003; Szeliski, 2010). A calibration model provides a geometric relationship between the world coordinates and the images, and relationships among cameras in a multiple views configuration. For example in the detection problem, this geometric structure would allows us to filter out false detections present 4.
(24) in one view when detections are not consistent in the remaining views. Correspondence analysis increases total detection performance through collaboration among all of the cameras in the vision system. In addition, knowledge of the geometric structure of the scene and the objects within it can add useful information related to their actual size and most likely location. Using this knowledge, we can exclude people or objects outside of a specified area and eliminate detections that have been included by mistake when the 2D detector tries to predict the real size of the objects. Unfortunately, if there are significant differences in appearance between one viewpoint and the next, matching algorithms cannot guarantee that correspondence will be established correctly. We propose a method for detecting people in a calibrated multiple view system in which a volume element is tailored to size as the object target class to be detected. We call this volume a sliding-box, and we define it as a 3D virtual volume element B as shown in Fig.1.2. This box passes through the three directions (X, Y, Z) of the spatial domain in the scene where people are likely to appear. Our approach is designed to inspect the corresponding portion of the images where this volume has projections according to its size, Fig. 1.2. This method is based on the standard slidingwindow approach in which a detection window runs through an input image in the 2D domain, with both horizontal and vertical direction at various scales (Viola & Jones, 2004; Dalal & Triggs, 2005). Instead, we propose a sliding-box in 3D at fixed size. This allow us to avoid searching at various scales and combine information in a multiple views camera system. However, the same idea could be used in a single 2D detector to guide the scale changes. Thus, our hypothesis is as follows: The use of a sliding-box allows us to generate a set of potential candidates according to the physical dimensions and positions of the people in the image. In doing so, it allows information from various viewpoints to be combined using correspondent regions. These properties make it possible to increase the effectiveness of detection relative to the single view detection described in the state-of-the-art with and without the use of multiple views.. 1.2. Objectives This section presents the general and specific objectives of the study. We will first present the general objective. Specific objectives will be described throughout the study. 5.
(25) C1. Z. S. CN. B. X Y C2. I1. IN. I2. …. Wi1. Wi2. WiN. Figure 1.2. Diagram of the proposed approach for detecting people in a multiple view configuration. Our approach requires N calibrated cameras C1 , . . . , CN . In this example the sliding-box B runs through various positions (X, Y, Z), scanning the entire space S of the scene in which heads could be located. The sliding-box B is projected from 3D space onto images I1 , . . . , IN , retrieving N detection windows Wi1 , . . . , WiN . Using 3D information allows us to directly scan the image at a suitable scale for human heads.. 1.2.1. General Objective According to the hypothesis, the main objective of this thesis is to develop a framework for detecting people in images of indoor environments that allows for the information coming from various viewpoints be combined without depending on correspondence establishing among detections, enriching the information used by a detection algorithm. The results of this framework is the increase of the detection performance.. 1.2.2. Specific Objectives In order to achieve our main objective, we must meet the specific objectives listed below: • build a multiple view environment for testing in order to imitate indoor conditions, 6.
(26) • build a multiple view dataset for training and testing classifiers according to the environment, • investigate and design algorithms for people detection in single and multiple views, • develop an algorithm for detecting people in video images of indoor environments based on the simultaneous projection of a virtual volume which allows us to include spatial and appearance information during the detection process; and, • extend the proposed approach to other detection problems.. 1.3. Summary of Contributions The proposed approach offers several promising advantages in object detection, including the following three main contributions of this thesis: (i) A method that uses geometric information to improve the traditional sliding-window approach applied to current appearance-based detectors, but a sliding box approach that offers the following advantages: a) we reduce correspondence problem at level of detection object by projecting the sliding-box onto multiple views simultaneously, instead of using matching methods based on low-level pixel or interest points; b) we include useful 3D cues that allow us to focus in the relevant parts of the 3D world in order to filter false candidates; and c) we guide the search for people by moving the sliding-box within a 3D space of interest, avoid searching in places where people must not be detected. (ii) A classification approach based on combining information from multiple views. This allows us to enrich the data used to train the models. Thus, we are able to include all of the visual information from different visual sources in a single model. (iii) Verification of the relevance of the previous ideas for the case of people counting using head detection showing that the proposed approach provides a substantial increase in recognition performance with respect to alternative state-of-the-art techniques.. 1.4. Document Organization This study is divided into six main chapters and three appendixes with publications related to this research. The contents of each chapter are described below: 7.
(27) • Chapter 1 presents the motivations for this work, an overview of our approach, and a summary of the contributions of our work. • Chapter 2 describes the theoretical foundations needed to develop the process described and includes a review of previous studies related to people detection in single and multiple views. • Chapter 3 provides a detailed discussion of the proposed method for detecting people using multiple views. • Chapter 4 describes the methodology used to verify our hypothesis and provides a discussion of its implementation. • Chapter 5 presents experimental analysis of this work, which was applied to people detection in images of indoor environments. • Chapter 6 presents conclusions related to the work developed in relation to the specific objectives of this study and discusses areas that may be explored in the future. • Appendix A presents a concept and its results to apply our approach on flaws classification to aluminum die casting. This text has been accepted for publication as an article in INSIGHT journal. • Appendix B describes a preliminary approach to modeling human heads. This results has been accepted for publication as an article in the Chilean Workshop of Pattern Recognition (CWPR, 2012). • Finally, Appendix C presents an summary of the results and conclusions included in this research. This text has been submitted to the journal of Machine Vision and Applications.. 8.
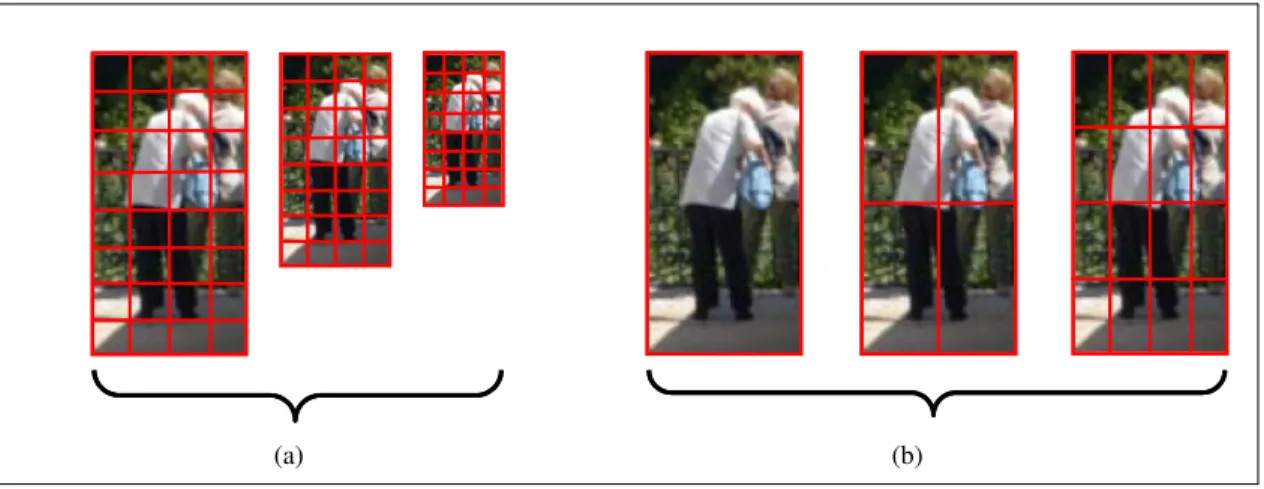
(28) Chapter 2. BACKGROUND. Modern visual object detection systems are based on machine learning algorithms that analyzes images and generate outputs at locations where the confidence or probability to the target object classes is sufficiently high. These machine learning algorithms generally present four stages: i) collection of data from the environment, ii) feature extraction, iii) selection of the most relevant features to the process, and iv) classification. The end result of this process is the detection of the object (Szeliski, 2010; Murphy, 2012). Features and the strategy used to extract these measures plays an important role in the final performance of the algorithm. Both the strategy and the type of features determine the design of the learning algorithm. Researchers have proposed novel and powerful learning algorithms that can deal successfully with the high dimensional descriptors currently used in object detection. However, detection based on visual information can be improved using geometric information about the scene and the object present in. New approaches include spatial information lost during image acquisition that allows them to eliminate noisy detections. These studies have paved the way for further analysis conducted in an effort to provide the detection system with these spatial cues. We review the main theoretical aspects of this study in the following four sections: image features, classification methods, people detection, and discussion.. 2.1. Image Features Raw images are arrays of pixels that contain light information of a scene picked up by sensor in a digital camera. This large set of data require to be pre-processed in order to transform the visual information into a new space of variables less redundant and more informative than the image domain. The measures used for compressing the visual information are commonly called features. These features need to be discriminative to allow for making the distinction between different classes, while providing invariance to light changes, noise and differences in viewpoint (Szeliski, 2010; Nixon & Aguado, 2012). Advanced detection algorithms based on machine learning use local image descriptors to cope better with objects variation. Further, several kinds of strategies can be used to sample the image and represent these image descriptors. Without loss of generality, we will divide those strategies into two groups based on how they sample the input image: sparse local sampling, dense sampling of image regions. In addition, dense sampling can also be divided 9.
(29) (a). (b). Figure 2.1. Examples of image sampling methods. (a) sparse local sampling: image regions are selected using a salient region detector. (b) dense representation: the image is sampled using a dense grid.. into two categories: sampling using multi-scale pyramid decomposition and sampling using spatial pyramidal decomposition. reduce the dimensionality and compress the redundant data into a compact representation called features. After the feature extraction, 2.1.1. Sparse Local Sampling Sparse sampling takes relevant local image regions from the image, as shown in Fig. 2.1a. These salient regions are selected using either key point detectors or parts detectors. The key point detectors select more informative local regions, which are more stable, repeatable and reliable. These factors directly impact the overall detector performance. The most relevant key point detectors are: Difference of Gaussians (DoG) (Lowe, 2004), invariant Harris-Laplace (Mikolajczyk & Schmid, 2004), Maximally Stable Extremal Regions (MSER) (Matas et al., 2004), and affine invariant salient regions (Kadir et al., 2004). In general, these keypoints perform well in problems in terms of establishing matches in order to compose image panoramas. However, saliency detectors work best in object classification (Mikolajczyk & Schmid, 2005; Savarese & Fei-Fei, 2007). Once the regions have been selected, descriptors are computed over them. The most influential descriptor for sparse representation are the Scale Invariant Feature Transformation (SIFT) (Lowe, 2004) and the Speeded-Up Robust Feature (SURF) (Bay et al., 2008). The SIFT descriptor contains a set orientation histogram weighted on gradient magnitude and the region scale. These gradients are 10.
(30) computed over rectangular grids. The SURF descriptor goes further and improve some features of SIFT descriptor that let it to speed-up the computation performance. This algorithm approximates the DoG using a set of box filters based on a sum of 2D Haar wavelet responses, allowing that the convolution to be computed by summations over integral images as proposed Viola and Jones (2001). In 2010, Calonder et al. use the same idea of representing salient regions by a descriptor and propose a binary string descriptor called BRIEF. This method is able to directly compute binary strings from image patches avoiding to calculate the full descriptor before further processing. It also includes a Gaussian smoothing that reduce the effect of noise sensitivity in complex scenes. The algorithm computes the binary string descriptor via the intensity comparison of pixel-pairs. Results show that BRIEF easily outperforms other fast descriptors such as SURF in terms of speed, and it also outperforms them in terms of recognition rate in many benchmark datasets. Then, Rublee et al. (2011) propose ORB that is a very fast binary descriptor based on the BRIEF descriptor. The method produce a descriptor invariant to rotation and resistant to noise. ORB finds potential salient point locations on an image pyramid using the FAST edge detector (Rosten & Drummond, 2006) and picks the top set of points as salient points applying a Harris corner measure. The descriptor improves BRIEF comparing the intensity of patch-pair to form the binary string vector. Results demonstrate its improvements in performance and efficiency relative to other features. However, authors do not adequately address the scale invariance of the pyramid and they also do not explore per keypoint scale. In the same year, Leutenegger et al. (2011) propose the BRISK descriptor. This method handles the problem of detecting, describing and matching image keypoints for cases without sufficient priori knowledge about the scene or viewpoint. Similar to ORB, this algorithm detect the interest regions using the FAST edge detector, but instead it uses a novel sampling pattern. It consists of sample points equally distributed on concentric circles centered around the salient point. Then, the algorithm determines orientation by computing local intensity gradients. Finally, the binary descriptor is a pairwise comparison of intensities. Experiments show this method offers a dramatically faster alternative at comparable matching performance than state-of-art interest region descriptors. Recently, Alahi et al. (2012) propose a novel descriptor based on human retina system, called FREAK. This method introduces a sampling retinal pattern that samples pairs of pixels. 11.
(31) and then compares their intensities. The descriptor outperforms state-of-the-art keypoint descriptors while remaining simple faster with lower memory load which make it an excellent choice for mobile applications. Most of these region descriptors have been recently compared in Z. Song and Klette (2013) and Wu and Lew (2013). Both evaluations agree that there is no a better interest region detector in all aspects, but that are dependent on the task. Wu and Lew (2013) reports that the FAST detector present highest repeatability score than other detectors, moreover and it had the least detection time cost per point. Their results also show that SIFT, BRISK, and FREAK are the best affine invariant descriptors, and the time complex showed the binary descriptors provide a very efficient description and matching. However, Z. Song and Klette (2013) report that SIFT is the best robustness descriptor with respect to rotation and scale changes, but its time issue has been confirmed again. In general, sparse key point approaches are characterized by their compact representation, i.e. there are fewer regions than image pixels. However, the key point detection algorithms do not guarantee repeatability for general object classification due to these interest regions are image dependent. This is a limitation in object categorization if the detector does not fire within the region occupied by the object. We defer the reader to these surveys for specific details about the evaluations.. 2.1.2. Dense Sampling This strategy proposes extracting features densely on the image or detection window and binding those features into a high-dimensional descriptor as shown in Fig.2.1b. The image is sampled using a grid to define local regions. Each region is represented using the intensity images, gradients or another appearance representation. The grid elements may be overlapping or not. Current algorithms use histograms of the computed feature to represent each local region. The local dense representation allows us to code visual features simultaneously with their location within the detection window. In addition, these representations avoid repeatability problems because they do not depend on search heuristics to find relevant regions. The most successful algorithms for dense representation are Haar wavelet coefficients (Papageorgiou & Poggio, 2000), Histogram of the oriented Gradients (HOG) (Dalal & Triggs, 2005), and Local Binary Patterns (LPB) (Ojala et al., 2000). In general, dense regular grid instead of interest points have shown work better for classification (FeiFei & Perona, 2005). In addition, this sampling method works better for discriminative classifiers 12.
(32) that can handle in an optimal way high dimensional feature vectors, such as Support Vector Machines (SVM) , Artificial Neural Networks (ANN) or boosting strategies (Tuzel et al., 2008). There are two variations related to the use of dense sampling that we describe below: multi-scale pyramid decomposition and spatial pyramidal decomposition. Multi-scale pyramid decomposition comes from multi-resolution analysis using wavelet and space-scale analysis (Lindeberg, 1993). This sampling technique is popular in multi-scale analysis, where the objective is to extract features at various levels of detail by downsampling and smoothing the input image, as shown in Fig. 2.2a. In 2000, Papageorgiou and Poggio proposed a multi-scale detector with a set of wavelet features computed at fixed scales to represent samples of people, cars, and faces. The multi-scale detector uses the trained model and the same downsampling and smoothing procedure on a set of test images. In addition of the method, the authors submit the MIT dataset showing good performance of this method. Then, Dalal and Triggs (2005) introduce HOG feature that consists of a dense grid of gradient histograms with trilinear interpolation and local normalization. This feature shares properties with SIFT. The method uses a SVM with polynomial kernel to classify the multi-scaled windows sets. Results show an excellent performance level on the MIT pedestrian database and also on their new database, the INRIA Person. In 2009, Wang et al. propose the combination of the HOG feature and Local Binary Patterns (LBP). The LBP descriptor are invariant to strict monotonic changes in intensity, making this feature robust against changes in lighting. This combination aims to use the best from both features, while capturing shape and texture information. Maji et al. (2008) propose multi-scale histogram of oriented edge energy feature, similar to HOG, but with a simpler design and lower dimensionality. This method exploits the additivity property of the intersection kernel, in which the resulting decision function can be independently computed for each dimension. Results show on the one hand, an improvement in running time that is logarithmic in the number of support vectors, and on the other hand it produces classification rates significantly better than the linear SVM. In 2009, Dollar et al. propose using sums of a collection of low-level feature channels such as the CIELUV color space, gradients, and vote strengths for different HOG bins. The sums are computed using the integral image technique in order to accelerate the computation times while producing state-of-the-art results. Tuzel et al. (2008) introduce the covariance matrices descriptor as a way to combine different localized lowlevel features such as, intensity and gradients. They also use Riemannian manifolds, showing a substantial improvement over the INRIA Person dataset. In 2010, Felzenszwalb et al. use a similar 13.
(33) feature approach to Dalal and Triggs (2005) but representing the objects by a multi-resolution HOG over a deformable part-based model (DPM). Afterwards, Park et al. (2010) add scale as another latent variable to the DPM, using models specialized for the respective resolution ranges and a fixed HOG-like template at low resolutions. Results of using these sets of multi-resolution features show improvements in detection of large and small pedestrians. Recently, Dollar et al. (2014) improve the running time to compute a set of multi-resolution features that is the bottleneck of many modern detectors. They use an extrapolation method that is inexpensive as compared to the feature computation. Their results show that using this approach the DPM methods are completely suitable for real-time detector with fine sampled pyramids. The pyramidal decomposition involves extracting features on smaller subregions of the image or detection window (Lazebnik et al., 2006; Bosch et al., 2007) as shown in Fig.2.2b. Unlike the dense representation, these subregions are generated by successively dividing each subregion until a maximum number of levels is reached. Thus, the use of the descriptor at various scales make it similar to the multi-scale pyramid decomposition. The spatial pyramidal decomposition aims to achieve both a global and local representation of the image. All features are collected in a high-dimensional vector. However, the decomposition levels should be limited in order to prevent over-fitting. In 2006, Lazebnik et al. introduce a simple and novel method for recognizing scene categories based on a spatial pyramid sampling. This technique consists in to partitionate the image into increasingly fine sub-regions and computing histograms of local features inside each sub-region. Aurthors use a SIFT-like feature to describe these sub-regions and finally form a codebook based on the k-means clustering algorithm. Classification results show that this technique increases the performances for the datasets described in state-of-art methods. In the same way, Bosch et al. (2007) propose a method to classify images according to the object categories that they contain. They use a descriptor that represents local image shape and its spatial layout. These allows for the shape correspondence between two images can be measured by the distance between their descriptors by a spatial pyramid kernel. Their results significantly improves classification performance. In 2009, Yang et al. present a novel strategy based on sparse coding and a multi-scale spatial max pooling to generate discriminative codebooks from a spatial pyramids sampling. This approach reduces the complexity of SVMs in training and in testing. Another novelty factor is the use of sparse coding with appearance descriptors like SIFT features. Classification results show that this approach always significantly outperforms the linear with Spatial Pyramid Matching kernel on histograms. Recently, C. Zhang et 14.
(34) (a). (b). Figure 2.2. Examples of methods for sampling images. (a) Multi-scale pyramid decomposition sampling strategy: the image is downsampled and smoothed at every level and then sampled at smaller subregions. (b) Spatial pyramidal decomposition strategy: the image is sampled at smaller subregions by dividing the image until a maximum number of levels is achieved.. al. (2013) propose an image classification approach based on a spatial pyramid robust sparse coding technique. This sparse coding search a the maximum likelihood estimation by optimizing over the codebook and the feature coding parameters. This optimization allows the algorithm to filter out more outliers than traditional sparse coding methods. The visual codebooks formed using this sampling strategy generate more discriminative codebooks helps to improve the image classification performance. Results demonstrate the effectiveness of this method on the Scene 15 dataset and the Caltech 256 dataset. 2.2. Classification Methods Building classification models is a crucial step in machine learning methods. These models are required in order to determine whether a set of features belongs to a specific class. There are two approaches to generating those models: discriminative and generative. Most of the detection applications based on sliding windows have been implemented using discriminative models due to their high level of performance, embedded ability to select relevant features, and ease of use. The most popular discriminative models are Support Vector Machines and Boosting. Part of the appeal for Support Vector Machine is that non-linear decision boundaries can be learnt using the so called the kernel trick. Though this classification algorithm have faster training speed, the runtime complexity of a non linear SVM classifier is high. Boosted decision trees on the 15.
(35) other hand have faster classification speed but are significantly slower to train and the complexity of training can grow exponentially with the number of classes. Thus, linear kernel SVMs have become popular for real-time applications as they enjoy both faster training and classification speeds, with significantly less memory requirements than non-linear kernels due to the compact representation of the decision function (Maji et al., 2008). 2.2.1. Support Vectors Machines Support Vector Machines algorithm (SVM) is a discriminative model that finds the separating hyperplane that maximizes the margin between two classes (Cortes & Vapnik, 1995). The output of the SVM does not provide posterior probabilities, however it can be calculated using the Platt method (Platt, 1999). SVM works either on the input features or a kernelized version of them. Let the training dataset comprise N input feature vectors x1 , . . . , xN and their labels y1 , . . . , yN ∈ {−1, 1}. The SVM maximize the objective function: min w,ξ,b. (. N. X 1 kwk2 + C ξi 2 i=1. ). subject to: yi (w · xi − b) ≥ 1 − ξi ,. ξi ≥ 0,. where w is the normal vector to the hyperplane, ξi is the slack variable which measures the degree of misclassification of the feature vector xi , C is a cost constant to increase the penalization of errors, and xi is the instance i in the train dataset. An important property of SVM is that the determination of the model parameters corresponds to a convex optimization problem. It ensures that any local solution is also a global optimum (Bishop et al., 2006). There are various kinds of kernels such as the Radial-basis kernel (RBF), Chi-square kernel, intersection kernels, etc. The selection of the kernel impacts the running time and the performance of the classifier. Previous studies have mainly used linear kernels because they perform better with large and sparse descriptors such as HOG and LBP (Dalal & Triggs, 2005; Felzenszwalb et al., 2009; Yang et al., 2009). 2.2.2. Boosting Classifiers This is also a discriminative framework based on the idea of combining weak learners to get a strong classifier (Schapire, 1990). In 1995, Freund and Schapire proposed AdaBoost, which is an 16.
(36) adaptive version of boosting in which misclassified instances increase their weight during training. There are several versions of the boosting algorithm which were designed to deal with different problems and yield several kinds of outputs. In general, this framework is used to train cascades of weak classifiers. Despite the slow training time of the cascades, they represent an improvement in the run-time of the final detector. Specifically, an AdaBoost algorithm builds a strong classifier as a linear combination of weak classifiers.. f (x) =. T X. αt ht (x). t=1. where T is the number of training rounds or iterations; h(t) is the weak classifier or can be thought of as features; and αt is the weight of the feature t in the linear combination. The final or the strong classifier is defined as. H(x) = sign. T X t=1. αt ht (x). !. 2.3. People Detection Single view approaches have received special attention from researchers as potentially useful for solving the people detection problem. Although there are multiple view approaches, most are still based on background subtraction frameworks with the inherent drawbacks of those approaches, as we discussed in Chapter 1. New methods include 3D cues, however, most of them work on single view camera configuration or require additional hardware. A specific analysis of each framework is provided in the next three subsections. 2.3.1. Single View Approaches Significant progress has been reported in the use of machine learning in people detection. As we note in our literature review, there is a main group of single view approaches which use robust machine learning models and advanced features such as part-based models to cope with object variations or poses. In 2000, Papageorgiou and Poggio propose a general framework of object detection, including people, which use sliding windows, Haar wavelet features and a SVM model. 17.
(37) Then, Viola and Jones (2001) demonstrate that is possible to achieve real-time object detection by introducing integral images, a focus of attention mechanism. These same authors expand this work by including patterns of motion to improve people detection (Viola et al., 2005). In 2005, Dalal and Triggs introduce the histogram of oriented gradient features (HOG) to represent object categories. The method also uses a sliding-window approach to detect object instances, but in this case it was slower than the model used by Viola et al. (2005). Using the same method, Dalal et al. extend their work for detecting standing and moving people in videos based on orientated histograms of differential optical flow (HOF) (Dalal et al., 2006). They combine these motion-based descriptors with their HOG appearance descriptors, removing the false positive and increasing the overall detection performance in the state-of-art video datasets. In 2007, Sabzmeydani and Mori propose a set of mid-level features to improve classification. The method uses a set of AdaBoost classifiers trained with regions of low-level features on the detection window to built a set of mid-level features that capture more information than the low-level feature sets. Then, Tuzel et al. (2008) present an algorithm to detect pedestrians in still images based on covariance descriptors (Porikli & Tuzel, 2006; Tuzel et al., 2006) and Riemannian manifolds. The descriptors form a d-dimensional nonsingular covariance matrices represented as a connected Riemannian manifold. Then, the classifier uses the geometry of the space to discriminate points lying on a the manifold. This approach can be combined with any boosting method. This algorithm achieves remarkable detection rates on the INRIA and DaimlerChrysler pedestrian data sets than state-of-the-art methods. In 2009, Wang et al. propose a people detection approach based on the combination of the HOG feature and Local Binary Patterns (LBP). The combination of both features allows the algorithm to capture the shape and the texture information simultaneously. This method also allow the detector to handle with occlusion using the SVM responses to infer the visible blocks in each window. The SVM score contributions of each block lets the algorithm to check if the contribution of the blocks is similar inside the detector window. When the SVM scores are inconsistent across the detector window, the algorithm employs a partial model trained using the portion of the window that is assumed to be visible. Schwartz et al. (2009) continues the idea of combining different types of features into high-dimensional feature vectors, over 170,000 dimensions. They propose pedestrian detector based on Partial Least Square Regression (PLSR) to reduce the dimensionality of the feature space. This technique allows any classifier to handle the problem of low amount of high-dimensional training data. The PLSR analysis is an efficient dimensionality 18.
Figure

+7


Documento similar
These pictures include images of the parking spaces reserved for people with disabilities and a general view of the accessible equipment available in the beach (shaded area,
No obstante, como esta enfermedad afecta a cada persona de manera diferente, no todas las opciones de cuidado y tratamiento pueden ser apropiadas para cada individuo.. La forma
The expansionary monetary policy measures have had a negative impact on net interest margins both via the reduction in interest rates and –less powerfully- the flattening of the
Jointly estimate this entry game with several outcome equations (fees/rates, credit limits) for bank accounts, credit cards and lines of credit. Use simulation methods to
Secondly, we have also proposed the combination or fusion of six independent appearance based people detectors at decision-level and their combination with our motion based
Assign the axle type [V ] k L to the vehicle infor- mation [V ] k B,F (ID, class and plate) using the time information, obtaining the final output [V ] k B,F,L a set with
For this reason, firstly, the different processing tasks involved in the automatic people detection in video sequences have been defined, then a proper classification of the state
In this section, we describe the experiments carried out for testing the proposed people system over our video dataset and we compare the results of our approach Edge, with three
