Accepted Manuscript
Study of the effect of the presence of silver nanoparticles on migration of bisphenol a from polycarbonate glasses into food simulants
C. Reguera, S. Sanllorente, A. Herrero, L.A. Sarabia, M.C. Ortiz
PII: S0169-7439(17)30481-1
DOI: 10.1016/j.chemolab.2018.03.005 Reference: CHEMOM 3599
To appear in: Chemometrics and Intelligent Laboratory Systems
Received Date: 25 July 2017 Revised Date: 18 December 2017 Accepted Date: 8 March 2018
Please cite this article as: C. Reguera, S. Sanllorente, A. Herrero, L.A. Sarabia, M.C. Ortiz, Study of the effect of the presence of silver nanoparticles on migration of bisphenol a from polycarbonate glasses into food simulants, Chemometrics and Intelligent Laboratory Systems (2018), doi: 10.1016/ j.chemolab.2018.03.005.
M
AN
US
CR
IP
T
AC
CE
PT
ED
STUDY OF THE EFFECT OF THE PRESENCE OF SILVER NANOPARTICLES ON MIGRATION OF BISPHENOL A FROM POLYCARBONATE GLASSES INTO
FOOD SIMULANTS
C. Reguera1, S. Sanllorente1, A. Herrero1, L.A. Sarabia2, M.C. Ortiz1,*
1
Dept. of Chemistry, 2Dept. of Mathematics and Computation
Faculty of Sciences, Universidad de Burgos Plaza Misael Bañuelos s/n, 09001 Burgos (Spain)
Abstract
The impact that the presence of nanoparticles in food can have on the migration from food contact materials (FCMs) of substances, which occurrence in foodstuffs is regulated, is posed in this paper through a case-study. Migration of bisphenol A (BPA) is tested from polycarbonate glasses into aqueous food simulant B (3 % acetic acid, w/v) and simulant D1 (50 % ethanol, v/v), both in the absence and presence of silver nanoparticles. The analysis of the amount of BPA released into the food simulants is conducted by comparing population results instead of using the classical location and scatter estimates. β-content tolerance intervals are used to model the statistical distribution of BPA migrated from the polycarbonate glasses. Experimental measurements are performed by HPLC-FLD, and partial least squares regression models are then fitted to determine the concentration of BPA. The analytical procedure fulfils the trueness property. The capability of detection of the method is between 1.7 and 2.3 µg L-1 when the probabilities of false positive and false negative are fixed at 0.05. Using β-content tolerance intervals, in 90 % of the specimens of a population of polycarbonate glasses, the amount of BPA migrated into simulant B in the presence of AgNPs is 13.34 µg L-1, at least twice the quantity that migrated in the absence of them.
Keywords: PLS; HPLC-FLD; bisphenol A; migration test; food simulants; silver
nanoparticles.
1. Introduction
Nanotechnology in food industry concerns with, among other things, developing food products and packaging materials with new and improved properties. Many naturally food occurring substances exist at the nanoscale, but new food products with prolonged shelf-life, novel tastes and textures, health benefits, etc., are being developed and engineered in this field [1,2,3]. The high surface area to mass ratio of nano-sized substances can lead, for example, to a reduction in the use of additives since small amounts may provide a high level of functionality or because of their ability to disperse uniformly in foodstuffs.
M
AN
US
CR
IP
T
AC
CE
PT
ED
properties and better temperature performance [4,5,6]. The antimicrobial and antifungal food packaging properties of silver nanoparticles (AgNPs), for example, are well known [5,7]. For this reason, AgNPs have been used to prepare packaging containing antimicrobial agents in order to extend the product life, despite the possible health risk of exposure to nanoparticles [8,9]. The use of AgNPs in food plastic containers is not allowed in the European Union (except for certain silver zeolites and rubber seals) [10], but it is usual in markets outside Europe; AgNPs are the most widely inorganic nanoparticles employed for antimicrobial packaging [5]. Nanoparticles may reach the food contact surface and release into the food [11]; several studies on the migration of silver from FCMs can be found in the literature where silver speciation and quantification of the fraction migrated in the silver nanoform are performed [12,13,14]. However, it seems that the overall conclusion from the analysis performed so far is that consumer exposure is negligible [14] because the concentrations of AgNPs found are very low.
Nanoparticles may be present in foods as a consequence of the manufacture and processing of food or because they are transferred from the FCMs. The presence of nanoparticles in food that comes into contact with FCMs might have effect on the migration of other substances such as non-intentionally added substances (NIAS) that may be present in the FCM as a result of reaction or degradation processes that take place in that material [15]. In fact, the reactivity of many nanoparticles (metallic and magnetic nanoparticles, carbonaceous and silicon nanomaterials and polymer-based nanosorbents) has led to their increasing use as sorbents in sample preparation [16,17,18].
The aim of this work is to study the impact that the presence of nanoparticles in food could have on the migration behaviour (from FCMs) of substances such as bisphenol A, formaldehyde, aromatic amines or phthalates, the occurrence of which in foodstuffs is regulated [10]. As an example to illustrate the procedure, the issue is addressed through a case-study, to assess if the release of bisphenol A (PBA) from polycarbonate (PC) tableware into food simulants [19] is different in the presence and in the absence of AgNPs.
Bisphenol A was chosen because it is a compound released from FCMs that may be present in food [20]. This substance is authorized [10] for use as a monomer in plastic FCMs, with a specific migration limit in food of 0.6 mg kg−1, although the European Union maintains the ban of BPA in PC infant feeding bottles [21]. It is used as a monomer in the manufacture of polycarbonates, which in turn are used in FCMs such as tableware, storage containers or microwave ovenware. BPA displays estrogenic properties and acts as an endocrine-disrupting agent, which constitutes a risk to human health; in fact, its epigenetic properties have been confirmed [22,23].
M
AN
US
CR
IP
T
AC
CE
PT
ED
spectroscopy [28], etc. are used. European standard EN 13130-13 [29] specifies a method for the determination of BPA in some food simulants by HPLC-UV, which is applicable at a minimum level of 200 µg per kilogram of food simulant.
In the present work, to study the effect of AgNPs on migration of BPA, clear PC glasses are subjected to different test conditions under which the residual monomer in the polycarbonate could migrate into simulant, thereby releasing BPA. Two food simulants, simulant B (3 % acetic acid, w/v) and simulant D1 (50 % ethanol, v/v), are used to carry out the migration tests; these food simulants represent acidic (with pH 4.5 or less) and fatty (amphiphilic and milk) foods, respectively [19].
The concentration of BPA released into the simulant is analysed on a population basis rather than on sample measurements because, in practice, it is impossible to carry out a migration test on the same glass in the presence and absence of nanoparticles; the validity of classical location and scatter estimates may be not clear in this case. β-content tolerance intervals [30,31,32] are used to model the statistical distribution of BPA migrated from the PC glasses into the food simulants. The authors in reference [33] already has stated that the migration can be very different from one glass to another.
Experimental measurements are performed by HPLC-FLD, analytical method that makes it possible to reach around 1-2 µg L-1 of BPA, well below the specific migration limit in food simulants indicated above, levels necessary in this work given the low released quantities. The determination of BPA is carried out by multivariate calibration through partial least squares (PLS) regression.
2. Experimental
2.1 Reagents and samples
2,2-bis(4-hydroxyphenyl)propane or BPA (CAS no. 80-05-7; 99 % minimum purity) is supplied by Aldrich (Saint Quentin Fallavier, France). Silver nanoparticles (CAS no. 7440-22-4; 20 nm, 0.02 mg/mL in 0.002 M sodium citrate) are purchased from Alfa Aesar (Karlsrue, Germany).
Ethanol (96 % vol, HiPerSolv Chromanorm) and glacial acetic acid (HiPerSolv Chromanorm) are purchased from VWR (Fontenay-sous-Bois, France). Methanol (LiChrosolv for liquid chromatography) is supplied by Merck (Darmstadt, Germany). Deionised water is obtained by using the Milli-Q gradient A10 water purification system from Millipore (Bedford, MA, USA).
M
AN
US
CR
IP
T
AC
CE
PT
ED
are added to standard solutions to get 33.33 µg L-1 of nanoparticles. All these solutions are stored at 4 ºC and protected from light.
Clear PC glasses are purchased from a local food store and first analysed by means of Fourier transform infrared spectroscopy (FTIR) and differential scanning calorimetry (DSC) to confirm what material they are made of.
2.2 Instrumental
Analyses are carried out on an Agilent 1260 Infinity HPLC system (Agilent Technologies, Santa Clara, CA, USA) that consists of a quaternary pump VL (G1311C), standard autosampler (G1329B), thermostated column compartment (G1316A) and fluorescence detector (G1321B). The chromatographic column used is a Kinetex® C18 100A (150 mm length × 4.6 mm i.d., 5.0 µm particle diameter) column (Phenomenex, Torrance, CA, USA). A P-Selecta model 210 thermostatically controlled oven is used to incubate the test samples.
2.3 Migration tests
Migration tests are carried out using two aqueous food simulants, simulant B (3 % acetic acid, w/v) and simulant D1 (50 % ethanol, v/v). Different temperatures and contact times are assessed for the two food simulants, both in the presence and absence of AgNPs (see Table 1). Migration experiments are performed by glass filling with simulant D1 at 74 °C for 24 h (Experiment_1 and Experiment_1NP, in the absence and presence of AgNPs, respectively), with food simulant B at 100 °C for 24 h (Experiment_2 and Experiment_2NP), with simulant D1 at 70 °C for 10 h (Experiment_3 and Experiment_3NP), and with simulant B at 100 ºC for 10 h (Experiment_4 and Experiment_4NP). That is, a total of eight migration experiments are carried out, four of them in the presence of AgNPs (those labelled Experiment_*NP) and the other four in the absence of them.
A population of 30 PC glasses is considered for each experiment. In most cases, glasses filled with simulant containing AgNPs and with just simulant are intermingled in the oven under the same migration conditions.
M
AN
US
CR
IP
T
AC
CE
PT
ED
2.4 Reuse migration tests
As PC glasses are very often used more than once, migration tests were carried out six times on four glasses of each Experiment_1, Experiment_1NP, Experiment_2 and Experiment_2NP, to study the influence of long term use conditions in BPA release. Once the test sample is taken from the glasses after the first migration test, the glasses are refilled with fresh simulant and the entire migration procedure detailed in Section 2.3 is repeated five times.
2.5 Chromatographic procedure
Standards and test samples are filtered through a 0.22 µm-pore-size filter before the analysis. A volume of 20 µL is injected into the chromatographic system. The mobile phase consists of 70 % MeOH and 30 % water. The flow rate is set to 1 mL min-1 in isocratic elution mode. The column compartment temperature is 20 ºC. Excitation and emission wavelengths of the fluorescence detector are set at 280 nm and 310 nm, respectively.
2.6 Software
PLS models were performed with the PLS Toolbox [34] for use with MATLAB [35]. The β -content tolerance intervals were calculated through a MATLAB routine made in house. The least squares (LS) regression models were estimated with STATGRAPHICS Centurion XVII [36]. Decision limit, CCα, and capability of detection, CCβ, were determined using the DETARCHI program from ref. [37] where the pseudocode for its implementation is available.
3. Results and discussion
3.1 Calibration model
Harsh temperature and time conditions were chosen for the migration tests, taking into account the composition of simulants B and D1, to force the migration of bisphenol A from polycarbonate and seeing the possible effect of the nanoparticles on the amount of bisphenol A released into the food simulants. Figure 1 shows the time window used for the analysis of some chromatograms obtained in the migration tests carried out.
M
AN
US
CR
IP
T
AC
CE
PT
ED
A calibration model is estimated for predicting the concentration of BPA in the test samples, in such a way that, in all the cases, the appropriate set of standards is measured in the same experimental session than the test samples derived from each migration experiment. A regression model is fitted with standards in the absence of AgNPs and another one with standards containing nanoparticles for predictions on test samples, obtained for each simulant at each migration conditions.
Using PLS regression models has been necessary because the poor signal-noise ratio of the analytical technique at the lowest levels of concentration makes it so difficult to quantify the area of the corresponding chromatographic peaks. As predictor variables, 27 fluorescence emission intensities within the retention time interval of 2.50 to 2.91 min (at intervals of 0.016 min) are considered. All the multivariate models are performed throughout the manuscript with the mean-centered data (predictor and response variables) and using leave-one-out cross-validation.
When migration tests are performed in the conditions of Experiment_1 and Experiment_1NP, PLS models are fitted and predictions on test migration samples are made. However, when the scores of the two first latent variables of the two PLS models (in the absence and presence of AgNPs) are plotted, two groups of samples were found in each case, depending on what oven tray the glasses are. This was caused because the oven was not working properly at the bottom tray. The proper operation of the oven at the top tray was regularly tested. For that reason, Experiment_1 and Experiment_1NP were repeated placing the glasses only in the top oven tray, to avoid this effect, and from that moment all the migration experiments are performed in this way.
Ten new standards with concentrations of BPA from 0 to 30 µg L-1, which are prepared in simulant D1 (50 % ethanol, v/v) both in the absence and presence of AgNPs, are measured to fit new PLS regression models. These standards are measured in the same experimental session than the repeated migration samples of Experiment_1 and Experiment_1NP. The third standard of the model obtained in the absence of AgNPs is lost, and the first and third standards of the model corresponding to the presence of AgNPs are removed from the training set because they have a studentized residual higher than 2.5. The multivariate regression models fitted with one latent variable explain 99.0 % and 98.4 % of the variance of the response, respectively; these are PLS models 1 and 2 in Table 1.
M
AN
US
CR
IP
T
AC
CE
PT
ED
Less severe migration conditions are tested in the remaining migration tests. Seven standards are prepared (concentrations of BPA from 0 to 15 µg L-1), both in the absence and presence of AgNPs, in simulant D1 and in simulant B, as appropriate. The PLS regression models established for both simulants (models 5 and 6 and models 7 and 8 in Table 1, respectively) explain over 99.2 % of the variance of the concentration of BPA (see Table 1 for more details).
3.2 Figures of merit
Some figures of merit are estimated as a part of the validation of the analytical method. Accuracy is described by trueness and precision, figures of merit that may be established through the validation line, which is the regression line “calculated concentration” vs. “true concentration”. Table 2 shows the parameters of the validation lines estimated for the analytical method performed in simulant D1 and B, both in the absence and presence of AgNPs, from predictions of PLS regression models. The joint hypothesis “slope is 1 and intercept is 0” is checked to establish the trueness of the analytical method. The joint confidence regions (confidence ellipse) at 95 % of confidence estimated for slope and intercept in the different media include the point (1,0) in all the cases, i.e. trueness is guaranteed for the determination of BPA.
The precision of the analytical method is estimated in this work from the residual standard deviation of the validation lines (Table 2), which may be considered an estimation of the intermediate precision in the analysed concentration range [38], from 0 to 15 µg L-1 in all cases.
The concept of decision limit, or CCα, is described in ISO 11843 [39] as “the value of the net
concentration the exceeding of which leads, for a given error probability
α
, to the decisionthat the concentration of the analyte in the analysed material is larger than that in the blank
material”. And the detection capability, or CCβ, for a given probability of false positive α, is
“the true net concentration of the analyte in the material to be analysed which will lead, with
probability 1−
β
, to the correct conclusion that the concentration in the analysed material islarger than that in the blank material”. CCα and CCβ are also calculated from the validation
lines since a multivariate calibration technique is used in the analysis [40].
Recently a new procedure for calculating the CCβ in partial least squares calibration has been published [41]. The procedure is based on the errors in variable model and adopts the form of
M
AN
US
CR
IP
T
AC
CE
PT
ED
ISO 11843 [39], IUPAC guidelines [42] and Commission Decision 2002/657/EC [43] than that of ref. [41]. For this reason, we have applied the former one.
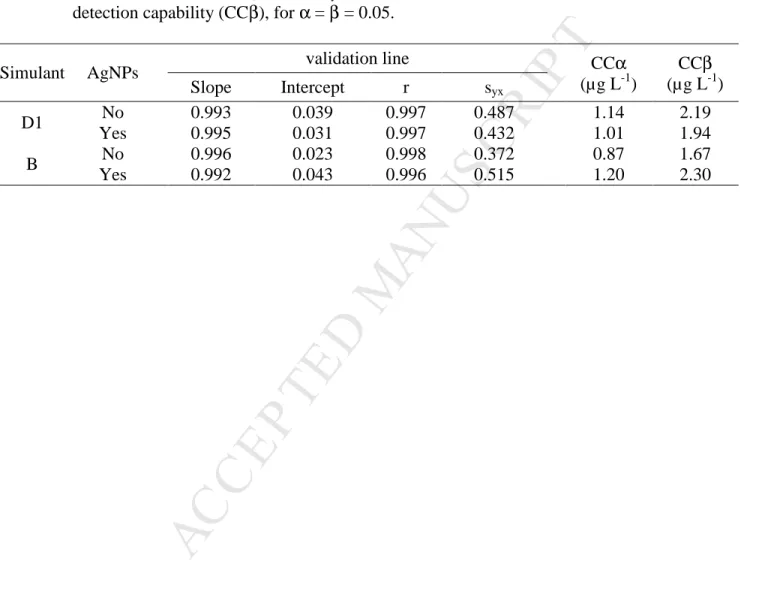
The values reached for CCα and CCβ (for α = β = 0.05) are shown in Table 2; they are between 0.87 and 1.20 µg L-1 and 1.67 and 2.30 µg L-1 respectively, far below the specific migration limit established by EU [10] for BPA in food, 600 µg kg-1. These values are also below that reached by the method specified in EN 13130-13 [29].
3.3 Determination of BPA migrated from glasses and analysis of results
3.3.1. Determination of the concentration of BPA in test samples
Firstly, the fitted PLS regression models are used to predict the concentration of BPA released from the glasses of the different migration experiments performed. Models 1 and 2 in Table 1 are used to calculate the amount of BPA released from glasses of Experiment_1 and Experiment_1NP respectively, after these articles are in contact with simulant D1 for 24 h at 74 °C. However, one of the test samples of Experiment_1 and another one of
Experiment_1NP have simultaneously Q residual and Hotelling’s T2 indices above the
threshold values at 95 % confidence level, so they are outliers that have to be removed from the test set, i.e. only 29 values of the predicted BPA concentration are available for each migration experiment. The concentration of BPA found for samples of Experiment_1 and
Experiment_1NP are shown in Figure 2 (a) and 2 (b), respectively.
PLS regression models 3 and 4 (Table 1) are used to predict the concentrations of BPA in the samples of Experiment_2 and Experiment_2NP, respectively. Figures 2 (c) and 2 (d) show the values of concentration calculated from these migration experiments. Higher amounts of BPA are released from the PC glasses into simulant B (for 24 h at 100 ºC) than that found above for simulant D1 (for 24 h at 74 ºC).
Finally, models 5 and 6 and models 7 and 8 in Table 1, are used to calculate the concentration of BPA released into simulant D1 and simulant B for Experiment_3 and Experiment_3NP, and Experiment_4 and Experiment_4NP, respectively. Some of the concentrations estimated are below the corresponding decision limits, so these data are excluded from the further study. The summary statistics of the remaining data are shown in Table 3. In any case, the concentrations found are well below that obtained from the experiments performed in the more severe migration conditions both for simulant D1 and simulant B.
3.3.2. Analysis of results. β-content tolerance intervals
M
AN
US
CR
IP
T
AC
CE
PT
ED
paper, the study is performed by comparing the population results obtained from the PC glasses analysed in each migration experiment, instead of individual measurements. Figure 4 3 shows the cumulative distributions of the values of concentration of BPA obtained in the different migration tests carried out.
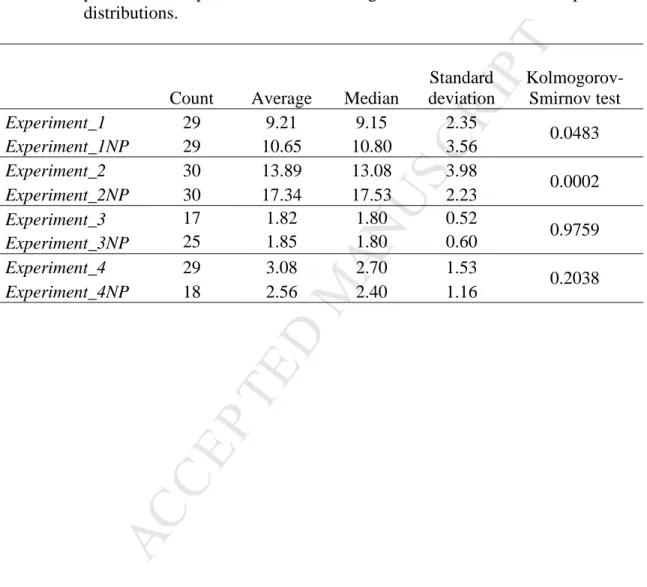
The distribution functions of the results obtained from the different migration experiments performed in the absence and presence of AgNPs are compared through the Kolmogorov-Smirnov test. The null and alternative hypothesis of the test are “there is not a statistically significant difference between the two distributions” and “there is a statistically significant difference between them”, respectively. This test covers differences in the shape of distribution such as midrange behaviour, dispersion, skewness or kurtosis. Table 3 shows the p-values found for this test when comparing the distribution functions of the results of the migration tests.
When comparing the distribution functions of Experiment_3 and Experiment_3NP, as the p-value (in Table 3) is greater than 0.05, the null hypothesis cannot be rejected, and it is the same for the comparison of distribution functions of Experiment_4 and Experiment_4NP. So it is concluded that, at 95 % confidence level, there is not a statistically significant difference between the distribution of the concentration of BPA found in the absence and in the presence of AgNPs both for simulant D1 and B in the less severe migration tests performed.
However, when comparing the distribution functions of the data from Experiment_1 and
Experiment_1NP and from Experiment_2 and Experiment_2NP, the p-values obtained (Table
3) are less than 0.05, so the null hypothesis is rejected and therefore it is concluded that there is a statistically significant difference between the distributions of BPA migrated into both simulant D1 and B in the absence and presence of AgNPs, at 95 % confidence level. In particular, higher medians are found in Experiment_1NP and Experiment_2NP than in
Experiment_1 Experiment_2.
β-content tolerance intervals are used to model the statistical distribution of BPA migrated from each PC glass of the population into the food simulants at the more severe migration
conditions, both in the presence and absence of AgNPs. The β-content tolerance intervals are for a percentage of individual results and not for a mean value as the confidence intervals. They allow one to establish what is the amount of BPA that will be released by a certain
percentage of the glasses (β) when the migration tests are performed.
Formally, given a random variable X (BPA concentration in our case), the one-sided β -content tolerance interval at the confidence level, γ, is expressed as Eq. (1), which establishes that at least a proportion β of the values lies above b [31].
M
AN
US
CR
IP
T
AC
CE
PT
ED
For n data normally distributed with unknown mean and variance, b is calculated by means of equation (2) [30, 32]
confidence level of a t distribution with no central parameter nzβ, and zβis the critical value of a normal distribution at β confidence level.
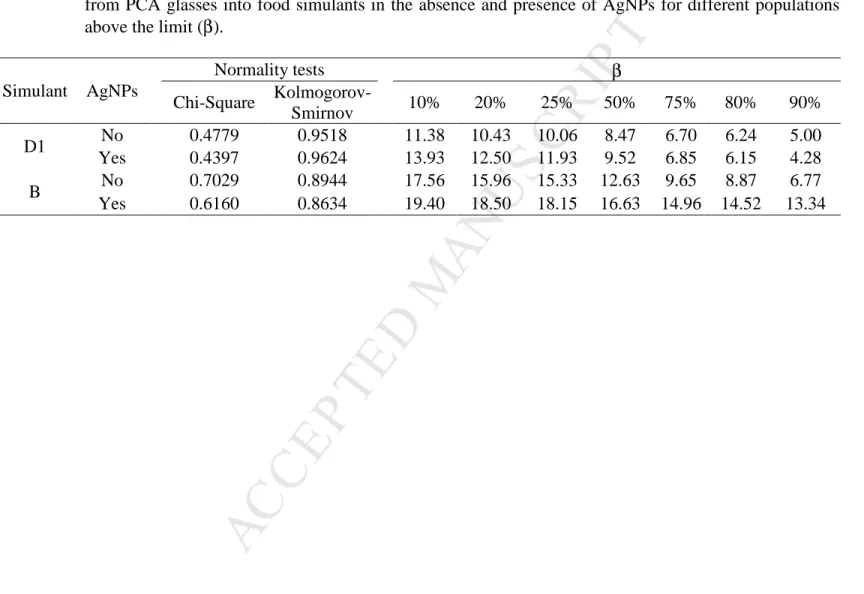
To use Eq. 1 and Eq.2 the normality of the distribution of the results obtained in these migration experiments is checked. Table 4 shows the p-values of the hypothesis tests used to determine whether data come from a normal distribution. The null hypothesis is “the data come from a normal distribution” against the alternative hypothesis “it is not a normal distribution”. The p-values for the Chi-Squared test and the Kolmogorov-Smirnov test are both above 0.05 in all cases, leading to acceptance of the normal distribution at the 5 % significance level.
The β-content tolerance intervals are calculated from the first migration tests for different values of β, assuming normal distribution. The intervals obtained are shown in Table 4. The values of this table mean that, considering for example the last number, one can be 95 % BPA, i.e. the matrix effect of AgNPS, is studied in order to ensure that the nanoparticles do not interfere on the analytical results achieved both for simulant D1 and B. For this purpose, the concentration of BPA is obtained, as described below, for two sets of 15 glasses subjected to migration conditions of Experiment_1NP and Experiment_2NP, in the presence of AgNPs. In each case, the concentration of BPA is estimated using a PLS model built with standards containing AgNPs and in addition, from the same chromatographic signals, using a PLS model built with standards containing no nanoparticles. If there is no matrix effect of AgNPs on the chromatographic signals of BPA, then these concentrations have to be similar.
M
AN
US
CR
IP
T
AC
CE
PT
ED
performed both for simulant D1 and simulant B, so there are two regression lines: y = 1.420 + 0.904 x (r = 0.860; syx = 1.157) for simulant D1, and y = -1.630 + 1.104 x (r = 0.953, syx =
0.880) for simulant B. The joint hypothesis test applied above is used again to statistically check whether slope is 1 and intercept is 0. The p-values found for the regression models obtained for simulant D1 and simulant B are 0.904 and 0.455, respectively. In both cases, the p-value is not less than 0.05, so the null hypothesis is not rejected at the 95 % confidence level, i.e. it is concluded that the no existence of matrix effect makes it possible to apply the PLS calibration models obtained in the absence of NPs to any test sample regardless of whether these samples have NPs.
3.4 Migration curves
Since PC glasses may be reused, experiments to provide information on the migration over several refilling experiments was conducted using other portions of fresh food simulant as indicated in Section 2.4. The study is performed in the most severe migration conditions, both in the absence and in the presence of AgNPs, as stated above, in the migration conditions of
Experiment_1, Experiment_1NP, Experiment_2 and Experiment_2NP. The migrated amounts
of BPA in each case versus reuse migration cycles are shown in Figure 5 4. For each simulant, both in absence and in presence of AgNPs the shape of the curve of growth is similar. For the simulant B the migrated BPA increases linearly whereas for the simulant D1 the increase it is more curved. The amount of BPA migrated is quite the same in the four cases (only four glasses were used for these experiments); and when the cycles of use increase also the dispersion is major in the quantities of BPA found.
4. Conclusions
The analytical methods used for the determination of BPA in food simulants in presence and absence of AgNPs fulfil the trueness property, the capability of detection of these methods are between 1.7 and 2.3 µg L-1. There is not matrix effect of the presence of AgNPs in such determination in none of the simulants considered.
The migration studies show that the migration of BPA into simulant B is higher than into simulant D1, both in the absence and presence of AgNPs.
Using β-content tolerance intervals, in 90 % of the specimens of a population of PC glasses, the amount of BPA migrated into simulant B in the presence of AgNPs is at least twice than that migrated in the absence of them.
M
AN
53157-R) and Junta de Castilla y León (ref. BU012P17) with co-financed European FEDER funds.6. References
[1] Q. Chaudhry, L. Castle, R. Watkins (Eds.), Nanotechnologies in food, 2nd ed., RSC Nanoscience & Nanotechnology, Royal Society of Chemistry, Cambridge, 2017.
[2] Q. Huang, Nanotechnology in the food, beverage and nutraceutical industries, Woodhead Publishing, Oxford, 2012.
[3] R. Busquets (Ed.), Emerging nanotechnologies in food science, Micro & Nano Technology Series, Elsevier, Amsterdam, 2017.
[4] A.M. Grumezescu (Ed.), Food packaging, Vol. 7, in Nanotechnology in the Agri-Food Industry Series, Academic Press, London, 2017.
[5] A.M. Grumezescu (Ed.), Food preservation, Vol. 6, in Nanotechnology in the Agri-Food Industry Series, Academic Press, London, 2017.
[6] T.V. Duncan, Applications of nanotechnology in food packaging and food safety: Barrier materials, antimicrobials and sensors, Journal of Colloid and Interface Science, 363 (2011) 1-24.
[7] A. Llorens, E. Lloret, P.A. Picouet, R. Trbojevich, A. Fernández, Metallic-based micro and nanocomposites in food contact materials and active food packaging, Trends in Food Science & Technology 24 (2012) 19-29.
[8] G. Ramachandran (Ed.), Assessing nanoparticle risks to human health, 2nd ed., William Andrew, Oxford, 2016.
[9] N. Bumbudsanpharoke, S. Ko, Nano-Food Packaging: An overview of market, migration research, and safety regulations, Journal of Food Science, 80 (2015) R910-R923.
[10] Commission Regulation (EU) No 10/2011 of 14 January 2011 on plastic materials and articles intended to come into contact with food, Official Journal of the European Union, L12 (2011) 1-89.
[11] K. Ramos, M.M. Gómez-Gómez, C. Cámara, L. Ramos, Silver speciation and characterization of nanoparticles released from plastic food containers by single particle ICPMS, Talanta 151 (2016) 83-90.
[12] A. Störmer, J. Bott, D. Kemmer, R. Franz, Critical review of the migration potential of nanoparticles in food contact plastics, Trends in Food Science & Technology, 63 (2017) 39-50.
M
AN
commercially available plastic food containers into food simulants. Journal of Nanoparticle Research, 18 (2016) Article 5.[15] C. Nerin, P. Alfaro, M. Aznar, C. Domeño, The challenge of identifying non-intentionally added substances from food packaging materials: A review, Analytica Chimica Acta 775 (2013) 14-24.
[16] M. Ahmadi, H. Elmongy, T. Madrakian, M. Abdel-Rehim, Nanomaterials as sorbents for sample preparation in bioanalysis: A review, Analytica Chimica Acta, 958 (2017) 1-21.
[17] J. González-Sálamo, B. Socas-Rodríguez, J. Hernández-Borges, M.A. Rodríguez-Delgado, Nanomaterials as sorbents for food sample analysis, Trends in Analytical Chemistry, 85 (2016) 203-220.
[18] R. Lucena, B.M. Simonet, S. Cárdenas, M. Valcárcel, Potential of nanoparticles in sample preparation, Journal of Chromatography A, 1218 (2011) 620-637.
[19] Guidelines for performance criteria and validation procedures of analytical methods used in controls of food contact materials, 1st ed., 2009 (EUR 24105 EN).
[20] E.J. Hoekstra, C. Simoneau, Release of bisphenol A from polycarbonate. A review, Critical Reviews in Food Science and Nutrition, 53 (2013) 386-402.
[21] Commission Implementing Regulation (EU) No 321/2011 of 1 April 2011amending Regulation (EU) No 10/2011 as regards the restriction of use of bisphenol A in plastic infant feeding bottles, Official Journal of the European Union, L 87 (2011) 1-2.
[22] Scientific Opinion on the risks to public health related to the presence of bisphenol A (BPA) in foodstuffs: Executive summary, EFSA Journal, 13 (2015) 3978.
[23] R.U. Halden, Plastics and health risks, Annual Review of Public Health, 31 (2010) 179-194.
[24] N. Caballero-Casero, L. Lunar, S. Rubio, Analytical methods for the determination of mixtures of bisphenols and derivatives in human and environmental exposure sources and biological fluids. A review, Analytica Chimica Acta, 908 (2016) 22-53.
[25] A. Ballesteros-Gómez, S. Rubio, D. Pérez-Bendito, Analytical methods for the determination of bisphenol A in food, Journal of Chromatography A, 1216 (2009) 449-469.
[26] Y. Sanchis, V. Yusà, C. Coscollà, Analytical strategies for organic food packaging contaminants, Journal of Chromatography A, 1490 (2017) 22-46.
[27] M.L. Oca, M.C. Ortiz, A. Herrero, L.A. Sarabia, Optimization of a GC/MS procedure that uses parallel factor analysis for the determination of bisphenols and their diglycidyl ethers after migration from polycarbonate tableware, Talanta 106 (2013) 266-280.
[28] M.L. Spagnuolo, F. Marini, L.A. Sarabia, M.C. Ortiz, Migration test of Bisphenol A from polycarbonate cups using excitation-emission fluorescence data with parallel factor analysis, Talanta 167 (2017) 367-378.
M
AN
US
CR
IP
T
AC
CE
PT
ED
[30] J.K. Patel, Tolerance limits. A review, Communications in statistics-Theory and Methods, 15 (1986) 2716–2762.
[31] M. C. Ortiz, L. A. Sarabia, M. S. Sánchez, A. Herrero, Quality of analytical measurements: statistical methods for internal validation, Vol. 1, in Brown S., Tauler R., Walczak B. (eds.) Comprehensive Chemometrics, Elsevier, Oxford, pp. 17-76.
[32] ISO 16269-6, 2014 Statistical interpretation of data - Part 6: Determination of statistical tolerance intervals. Annex A.5. One-sided statistical tolerance interval with unknown mean and unknown standard deviation.
[33] M.L. Oca, L.A. Sarabia, A. Herrero, M.C. Ortiz, Optimum pH for the determination of bisphenols and their corresponding diglycidyl ethers by gas chromatography-mass spectrometry. Migration kinetics of bisphenol A from polycarbonate glasses. J. of Chromatography A, 1360 (2014) 23–38.
[34] B.M. Wise, N.B. Gallagher, R. Bro, J.M. Shaver, PLS Toolbox 7.9.5.19417, Eigenvector Research Inc., Wenatchee, WA, USA., 2015.
[35] MATLAB version 8.4.0.150421 (R2014b), The Mathworks, Inc., Natick, MA, USA, 2014.
[36] STATGRAPHICS Centurion XVII Version 17.1.12 (64bit), Statpoint Technologies, Inc., Herndon, VA, USA, 2016.
[37] L.A. Sarabia, M.C. Ortiz, DETARCHI: A program for detection limits with specified assurance probabilities and characteristic curves of detection, TrAC: Trends in Analytical Chemistry, 13 (1994) 1-6.
[38] M.B. Sanz, L.A. Sarabia, A. Herrero, M.C. Ortiz, A study of robustness with multivariate calibration. Application to the polarographic determination of benzaldehyde, Talanta, 56 (2002) 1039-1048,
[39] International Organization for Standardization, ISO 11843, Capability of detection. Part 1: Terms and definitions, 1997; and Part 2: Methodology in the linear calibration case, 2000. Geneva, Switzerland.
[40] M.C. Ortiz, L.A. Sarabia, A. Herrero, M.S. Sánchez, M.B. Sanz, M.E. Rueda, D. Giménez, M.E. Meléndez, Capability of detection of an analytical method evaluating false positive and false negative (ISO 11843) with partial least squares, Chemometrics and Intelligent Laboratory Systems, 69 (2003) 21-33.
[41] F. Allegrini, A.C. Olivieri, IUPAC-Consistent approach to the limit of detection in partial least-squares calibration, Analytical Chemistry, 86 (2014), 7858−7866.
[42] J. Inczédy, T. Lengyel, A.M. Ure, A. Gelencser, A. Hulanicki, IUPAC Compendium of Analytical Nomenclature, 3rd edition 2000, Port City Press Inc., Baltimore.
M
AN
US
CR
IP
T
AC
CE
PT
ED
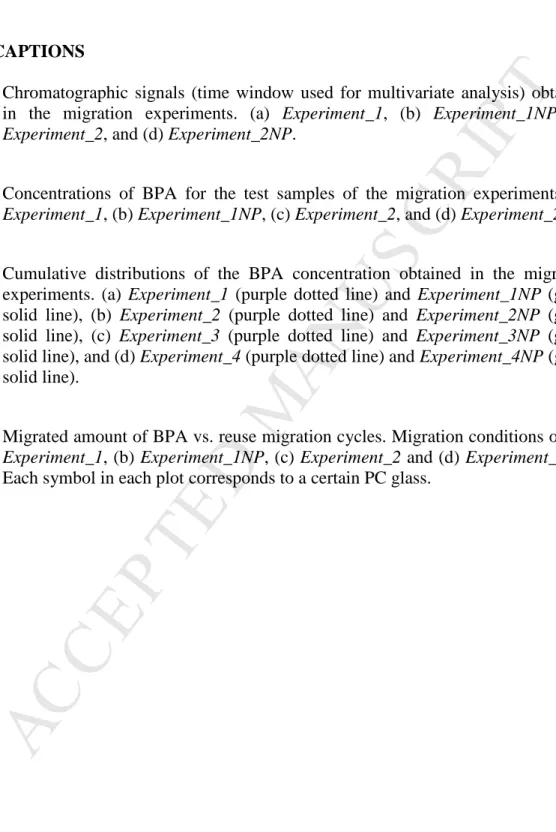
FIGURE CAPTIONS
Figure 1 Chromatographic signals (time window used for multivariate analysis) obtained in the migration experiments. (a) Experiment_1, (b) Experiment_1NP, (c)
Experiment_2, and (d) Experiment_2NP.
Figure 2 Concentrations of BPA for the test samples of the migration experiments. (a)
Experiment_1, (b) Experiment_1NP, (c) Experiment_2, and (d) Experiment_2NP.
Figure 3 Cumulative distributions of the BPA concentration obtained in the migration experiments. (a) Experiment_1 (purple dotted line) and Experiment_1NP (green solid line), (b) Experiment_2 (purple dotted line) and Experiment_2NP (green solid line), (c) Experiment_3 (purple dotted line) and Experiment_3NP (green solid line), and (d) Experiment_4 (purple dotted line) and Experiment_4NP (green solid line).
Figure 4 Migrated amount of BPA vs. reuse migration cycles. Migration conditions of: (a)
Experiment_1, (b) Experiment_1NP, (c) Experiment_2 and (d) Experiment_2NP.
M
AN
US
CR
IP
T
AC
CE
PT
ED
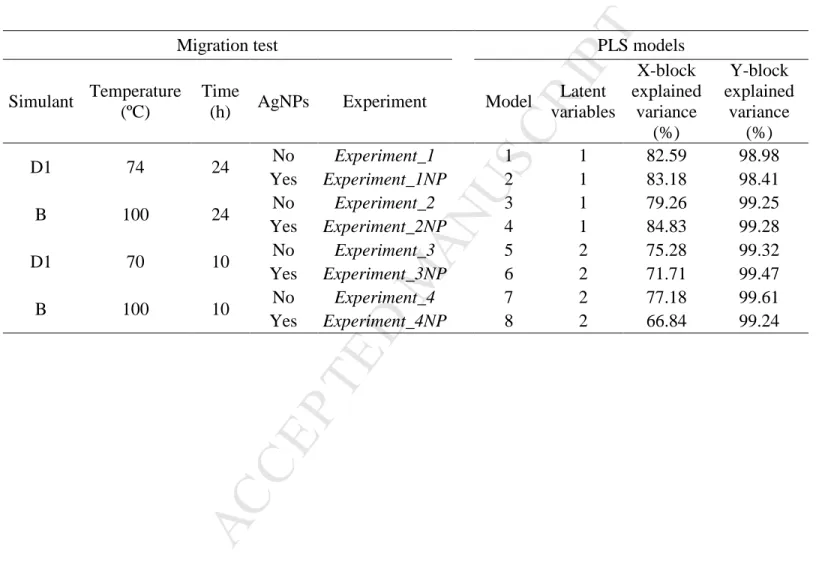
Table 1 Conditions of the migration tests and characteristics of the PLS models fitted (number of latent variables and explained variance in X and Y blocks).
Migration test PLS models
Simulant Temperature
(ºC)
Time
(h) AgNPs Experiment Model
Latent variables
X-block explained
variance (%)
Y-block explained
variance (%)
D1 74 24 No Experiment_1 1 1 82.59 98.98
Yes Experiment_1NP 2 1 83.18 98.41
B 100 24 No Experiment_2 3 1 79.26 99.25
Yes Experiment_2NP 4 1 84.83 99.28
D1 70 10 No Experiment_3 5 2 75.28 99.32
Yes Experiment_3NP 6 2 71.71 99.47
B 100 10 No Experiment_4 7 2 77.18 99.61
M
AN
US
CR
IP
T
AC
CE
PT
ED
Table 2 Figures of merit of the analytical method: slope, intercept, correlation coefficient (r) and standard deviation of regression (syx) of the validation lines, and decision limit (CCα) and
detection capability (CCβ), for α = β = 0.05.
Simulant AgNPs validation line CCα
(µg L-1)
CCβ
(µg L-1)
Slope Intercept r syx
D1 No 0.993 0.039 0.997 0.487 1.14 2.19
Yes 0.995 0.031 0.997 0.432 1.01 1.94
B No 0.996 0.023 0.998 0.372 0.87 1.67
M
AN
US
CR
IP
T
AC
CE
PT
ED
Table 3 Statistics and p-values of the normality test for the migration experiments performed and p-values for the Kolmogorov-Smirnov test for comparison of distributions.
Count Average Median
Standard deviation
Kolmogorov-Smirnov test Experiment_1 29 9.21 9.15 2.35
0.0483 Experiment_1NP 29 10.65 10.80 3.56
Experiment_2 30 13.89 13.08 3.98
0.0002 Experiment_2NP 30 17.34 17.53 2.23
Experiment_3 17 1.82 1.80 0.52
0.9759 Experiment_3NP 25 1.85 1.80 0.60
Experiment_4 29 3.08 2.70 1.53
M
AN
US
CR
IP
T
AC
CE
PT
ED
Table 4 P-values of the normality tests (Chi-Squared and Kolmogorov-Smirnov tests) for the migration
experiments and lower tolerance limits (in µg L-1), at 95% confidence level, for the migration of BPA
from PCA glasses into food simulants in the absence and presence of AgNPs for different populations above the limit (β).
Simulant AgNPs
Normality tests β
Chi-Square
Kolmogorov-Smirnov 10% 20% 25% 50% 75% 80% 90%
D1 No 0.4779 0.9518 11.38 10.43 10.06 8.47 6.70 6.24 5.00
Yes 0.4397 0.9624 13.93 12.50 11.93 9.52 6.85 6.15 4.28
B No 0.7029 0.8944 17.56 15.96 15.33 12.63 9.65 8.87 6.77
M
AN
US
CR
IP
T
AC
CE
PT
ED
M
AN
US
CR
IP
T
AC
CE
M
AN
US
CR
IP
T
AC
CE
PT
ED
Impact of nanoparticles in food on migration from FCMs of regulated substances.
Migration of bisphenol A from polycarbonate glasses into simulants B and D1.
Migration test performed both in the absence and presence of silver nanoparticles.