Search for top quark decays t > q H with H > gamma gamma using the ATLAS detector
45
0
0
Texto completo
(2) Prepared for submission to JHEP. Search for top quark decays t → qH with H → γγ using the ATLAS detector. The ATLAS Collaboration. Abstract: A search is performed for flavour-changing neutral currents in the decay of a top quark to an up-type (c, u) quark and a Higgs boson, where the Higgs boson decays √ to two photons. The proton-proton collision data set used corresponds to 4.7 fb−1 at s √ = 7 TeV and 20.3 fb−1 at s = 8 TeV collected by the ATLAS experiment at the LHC. Top quark pair events are searched for in which one top quark decays to qH and the other decays to bW . Both the hadronic and the leptonic decay modes of the W boson are used. No significant signal is observed and an upper limit is set on the t → qH branching ratio of 0.79%qat the 95% confidence level. The corresponding limit on the tqH coupling combination. λ2tcH + λ2tuH is 0.17..
(3) Contents 1 Introduction. 1. 2 Detector and data set. 2. 3 Experimental techniques 3.1 Photon reconstruction and identification 3.2 Other physics objects 3.3 Signal and background simulation. 3 3 5 6. 4 Analysis strategy and candidate event selection 4.1 Selection of hadronically decaying top quarks 4.2 Selection of leptonically decaying top quarks. 7 8 9. 5 Statistical analysis and results 5.1 Expected signal event yields 5.2 Signal and background modelling 5.3 Background from SM Higgs production 5.4 Experimental systematic uncertainties 5.5 Results. 12 12 13 14 14 16. 6 Conclusions. 17. 1. Introduction. The observation by the ATLAS [1] and the CMS [2] Collaborations of a new boson with a mass around 125 GeV, compatible with the long-sought Higgs boson [3–6], opens up the possibility of searching for the decay of a top quark to a Higgs boson plus an uptype (c, u) quark. Such a decay would proceed via a flavour-changing neutral current (FCNC). According to the Standard Model (SM), FCNC processes are forbidden at tree level and very much suppressed at higher orders due to the Glashow-Iliopoulos-Maiani (GIM) mechanism [7]. For instance, the expectation for the t → cH branching ratio is ∼ 3 · 10−15 (see Ref. [8] and references therein). Observations of FCNC decays of the top quark would therefore provide a clear signal of new physics. Previous searches for FCNC were conducted in particular for the t → c(u)Z decay mode by the LEP and HERA experiments [9–14] (via the crossed processes), CDF [15] , ATLAS [16] and CMS [17]. The current best limit for the branching ratio is 0.05% at the 95% confidence level [17].. –1–.
(4) In models beyond the SM, the GIM suppression can be relaxed, and loop diagrams mediated by new bosons may contribute, yielding effective couplings λtqH orders of magnitude larger than those of the SM. Examples of such extensions are the quark-singlet model (QS) [18–20], two-Higgs-doublet models (2HDM) of type I, with explicit flavour conservation, and of type II, such as the minimal supersymmetric standard model (MSSM) [21–27]. In 2HDM without explicit flavour conservation (type III) [28–36], the tc(u)H couplings are present at tree level. For a review of the different models see Ref. [8]. Among the published extensions of the SM, the largest branching ratio (∼ 0.15%) is specific to the t → cH decay. It appears in 2HDM of type III and corresponds to a nonflavour-diagonal Yukawa coupling which scales with top-quark and light-quark masses, mt √ p and mq , as λtqH = 2mq mt /v, as proposed in Ref. [28], where v/ 2 = 174 GeV is the Higgs field vacuum expectation value. In the other models discussed in Ref. [8], the largest branching ratios for the t → qH decays are of the order of a few 10−5 . In this paper a search for t → qH decays in tt production is undertaken using the H → γγ decay channel. The analysis does not distinguish between the t → cH and t → uH final states which have similar acceptances. As theory favours t → cH, this mode is used as reference throughout this work, unless otherwise stated. Despite its small branching ratio (∼ 0.23% for a Higgs boson mass around 125 GeV), the H → γγ channel was chosen because of its demonstrated high importance for inclusive Higgs boson studies, with a rather large number of events and a clean signature [1, 37]. The remaining top quark in the event is searched for in two final states: a bottom quark and a hadronically decaying W boson, giving rise to events with four jets, or a leptonically decaying W boson, giving two jets, a lepton and missing transverse energy. The branching ratio B of the t → qH process is estimated as the ratio of its partial width to the t → bW width, assumed to be dominant, B = (λ2tcH + λ2tuH )/(g 2 · |Vtb |2 · χ2 ),. (1.1). where |Vtb | is taken equal to 1, χ is a kinematic factor 1 and g = 2mW /v is the weak coupling constant. Using PDG averages [38] and applying NLO corrections to both the t → qH partial width [39] and the top quark total decay width [40] leads to χg = 1.92 ± 0.02, which is used in the extraction of the coupling.. 2. Detector and data set. The ATLAS detector [41] consists of an inner tracking detector (ID) surrounded by a superconducting solenoid providing a 2 T magnetic field, electromagnetic and hadronic calorimeters, and a muon spectrometer. The ID provides tracking in the pseudorapidity2 1. χ2 = (1 − 3x4 + 2x6 )(1 − y 2 )−2 x−2 /2, where x = mW /mt , y = mH /mt , mW and mH are the W -boson and Higgs boson masses and the masses of the other quarks are neglected. 2 ATLAS uses a right-handed coordinate system with its origin at the nominal interaction point (IP) in the centre of the detector and the z-axis along the beam line. Observables labelled as transverse are projected onto the xy plane. The x-axis points from the IP to the centre of the LHC ring, and the y-axis points upwards. Cylindrical coordinates (r, φ) are used in the transverse plane, φ being the azimuthal angle. –2–.
(5) region |η| < 2.5 and consists of silicon pixel- and microstrip-detectors inside a transition radiation tracker. The electromagnetic calorimeter, a lead/liquid-argon sampling device, is divided into one barrel (|η| < 1.475) and two end-cap (1.375 < |η| < 3.2) sections. Longitudinally, it is divided into three layers. The first layer, referred to as the strip layer, has a fine segmentation in the regions |η| < 1.4 and 1.5 < |η| < 2.4 to facilitate the separation of photons from neutral hadrons and to allow shower directions to be measured, while most of the energy is deposited in the second layer. In the range of |η| < 1.8 a presampler layer inside the cryostat allows for the correction of energy losses upstream of the calorimeter. The barrel (|η| < 1.7) hadronic calorimeter consists of steel and scintillating tiles, while the end-cap sections (1.5 < |η| < 3.2) are composed of copper and liquid argon. The forward calorimeter (3.1 < |η| < 4.9) uses copper and tungsten as absorber with liquid argon as active material. The muon spectrometer consists of precision (|η| < 2.7) and trigger (|η| < 2.4) chambers embedded in a toroidal magnet system which surrounds the hadronic calorimeter. This analysis uses the full proton-proton data set recorded by ATLAS in 2011 and 2012. After application of data-quality requirements, the integrated luminosity amounts √ √ to 4.7 fb−1 at s = 7 TeV, with a relative uncertainty of 1.8% [42], and 20.3 fb−1 at s = 8 TeV, with a relative uncertainty of 2.8%3 . The data were recorded with instantaneous luminosities varying between 1 × 1032 cm−2 s−1 and 7.8 × 1033 cm−2 s−1 . The mean number of interactions per bunch crossing was 9.1 in 2011 and 20.4 in 2012. The inelastic collisions that occur in addition to the hard interaction produce mainly low transverse momentum particles that form the so-called “pile-up” background. The data considered here were selected using a diphoton trigger in which two clusters formed from energy depositions in the electromagnetic calorimeter are required. A transverse energy (ET ) threshold of 20 GeV was required at 7 TeV, while at 8 TeV the thresholds were increased to 35 GeV and 25 GeV on the leading (sorted in ET ) and sub-leading clusters. In addition, loose criteria were applied on the shape of the clusters requiring that they match the expectations for electromagnetic showers initiated by photons. For events satisfying the off-line selection, the efficiency of the diphoton trigger is measured to be √ (98.9 ± 0.2)% for s = 7 TeV data and (99.6 ± 0.5)% at 8 TeV.. 3 3.1. Experimental techniques Photon reconstruction and identification. The photon reconstruction is seeded from clusters of energy deposits in the electromagnetic calorimeter. Clusters without any matching track in the ID are classified as unconverted photon candidates. Clusters with a matching conversion reconstructed from one or two tracks are classified as converted photon candidates [43]. The efficiency of the photon around the beam line. The pseudorapidity is defined in terms of the polar angle θ as η = − ln tan θ2 . The p 2 ∆R distance is defined as ∆R = (∆η) + (∆φ)2 . 3 The luminosity of the 2012 data set is derived, following the same methodology as that detailed in Ref. [42], from a preliminary calibration of the luminosity scale derived from beam-separation scans performed in November 2012.. –3–.
(6) reconstruction is about 96.5% averaged over the ET and η spectra expected for photons from a mH = 125 GeV Higgs boson decay. The identification of photons (PID) is based on the shape of their showers in the electromagnetic calorimeter. An initial loose selection, also used at trigger level, is based on shower shapes in the second layer of the electromagnetic calorimeter and on the energy deposition in the hadronic calorimeter. The tight identification adds information from the finely segmented strip layer. The PID efficiency, averaged over η, ranges between 85% and 95% for the ET range of interest. The measurement of the uncertainty on the PID efficiency is based on the comparison of the efficiency obtained in the simulation and the combination of three data-driven measurements [44]. Taking into account possible correlations in η, ET and conversion status, the resulting uncertainty on the diphoton inclusive signal yield is estimated to be 8.4% at 7 TeV and, owing to the larger sample and several analysis improvements, 2.4% at 8 TeV [37]. For the hadronic channel analysis, where four or more jets are required, the systematic uncertainty is 9.3% at 7 TeV and 4.6% at 8 TeV. To further suppress jets faking photons, calorimetric and track isolation requirements are applied. The isolation-ET is estimated by summing the ET of positive-energy topological clusters4 reconstructed in the electromagnetic and hadronic calorimeters in a cone of ∆R = 0.4 around the photon candidate, where the region of size 0.125 × 0.175 in η × φ around the photon barycentre is excluded. The isolation-ET is corrected for leakage of the photon energy outside of the excluded region and for pile-up [46], and it is required to be below 4 GeV (6 GeV) for the 2011 (2012) data. For the 2012 data set, the scalar sum of the transverse momentum (pT ) of all tracks consistent with the primary vertex (see below), with pT above 1 GeV and in a ∆R = 0.2 cone around the photon direction is required to be below 2.6 GeV. Comparing data and simulation using electrons from Z → e+ e− candidate events, and photons from Z → ℓ+ ℓ− γ events, where ℓ = e or µ, a good agreement between efficiencies is found and the remaining small difference is accounted for as a systematic uncertainty of 1% on the diphoton signal yield for inclusive production. For events with four or more jets, the efficiency of the calorimetric isolation selection was found to be slightly smaller in data than in the simulation, resulting in a correction factor of 0.98 with a systematic uncertainty of ±3%. The energies of the clusters are calibrated separately for unconverted and converted photon candidates and for electrons. The energy calibration for data is refined by applying η-dependent correction factors, which are about ±1%, determined from Z → e+ e− events. The simulation is corrected to reflect the energy resolution observed using Z → e+ e− events in data, which requires an energy smearing of about 1% in the barrel region and between 1.5% and 2.5% in the end-cap region of the calorimeter. 4. Topological clusters are three-dimensional clusters of variable size, built by associating calorimeter cells on the basis of the signal-to-noise ratio [45].. –4–.
(7) 3.2. Other physics objects. The kinematic properties of all objects are determined with respect to a primary vertex selected [37] by combining: - an estimate of its z position obtained from the intersection of the beam line with the direction of the photons, as determined by the measurement using the longitudinal segmentation of the calorimeter, and the conversion point or hits in the ID when available; - the scalar sum of the transverse momenta and the sum of the squared transverse momenta of the tracks associated with each reconstructed vertex; - and, at 8 TeV, the difference in azimuth between the direction of the vector sum of the tracks momenta and the di-photon system. In addition to photons, the analysis requires also jets, electrons or muons and missmiss . The main inputs to identify and measure these objects are ing transverse energy, ET summarised below. • Jets are reconstructed from topological clusters in the calorimeters [45, 47], using the anti-kt algorithm [48] with a radius parameter R = 0.4. They must have |η| < 4.5 and pT > 25 GeV. For the 8 TeV data set, this threshold is increased to 30 GeV for jets with |η| > 2.4. The dependence of the jet response on the number of reconstructed primary vertices and on the expected average number of interactions is removed, at √ s = 8 TeV where the pile-up is largest, by applying an event-by-event subtraction procedure based on the jet area method [49]. In order to suppress jets produced in additional pile-up interactions, each jet is also required to have a sufficiently high jet vertex fraction (JVF) defined as the scalar sum of pT of the tracks consistent with the primary vertex that fall into the jet area over the sum of track pT from all primary vertices falling into the same jet area. A JVF larger than 0.75 (0.25) for the 7 TeV (8 TeV) data set is required. At 8 TeV, this cut is only applied for jets with |η| < 2.4 and pT < 50 GeV. • The tagging of bottom quark jets is performed using a neural network identifier [50], which includes information from the impact parameter of tracks and from displaced vertices from hadron decays. The threshold values are set so as to give, on average, a 70% efficiency for jets containing a bottom hadron in tt events. The efficiency for charm jets is about 20%, and it is less than 1% for light-quark jets. Small differences between data and simulation are taken into account by a global factor determined by propagating to the simulated signal samples the differences between data and simulation measured on dedicated samples (tt in particular). • Electron candidates consist of clusters of energy deposited in the electromagnetic calorimeter that are associated with ID tracks [51]. Their transverse energy is computed from the cluster energy and the track direction at the interaction point, and they are required to satisfy |η| < 2.47 and ET > 15 GeV. Electron candidates have to pass a set of requirements on the hadronic leakage, shower shapes, track quality and track-cluster matching variables. Furthermore, they must. –5–.
(8) be isolated: the calorimetric isolation ET in a ∆R = 0.4 cone divided by the electron candidate’s ET is required to be less than 0.2, and the scalar sum of the pT of tracks consistent with the primary vertex, in a cone of ∆R = 0.2 around the electron candidate’s track, divided by its ET , has to be less than 0.15. • Muon candidates are required to pass the conditions |η| < 2.7 and pT > 10 GeV, and they must be isolated with the same criteria as for electrons. The muon tracks must have a transverse impact parameter |d0 | < 1 mm and a longitudinal impact parameter |z0 | < 10 mm. • The missing transverse energy is calculated as the magnitude of the sum of the p~T of all identified objects in an event. Clusters of calorimeter cells with |η| < 4.9 not associated with any of the objects described above are also added. A given particle may be reconstructed as more than one object (for example both as a photon and a jet). This possible duplication, as well as any real overlap in a narrow ∆R interval, is suppressed by an overlap removal procedure (within ∆R = 0.2 between photons and electrons, 0.4 between photons and jets, 0.4 between muons and either jets or photons) in which the highest priority is given to photons, followed by electrons, jets and finally muons. 3.3. Signal and background simulation. The simulations of the signal and of the SM Higgs boson production (resonant background) are used to estimate the corresponding acceptances. The relevant non-resonant backgrounds are due to diphoton production and tt and W production. These backgrounds are simulated in order to constrain the shape of the fitted non-resonant background in control regions of the data. Signal events corresponding to tt production, with one top quark decaying into a charm quark and a Higgs boson (which is constrained to decay into two photons) were generated using PROTOS 2.2 [52], with PYTHIA6 [53] for parton shower (PS), multiple interactions (MI) and hadronisation, with a set of parameters as defined by the Perugia2011C tune [54]. A top quark mass of 172.5 GeV and a Higgs boson mass of 125 GeV were chosen. √ Four samples of 30,000 events were generated: two samples correspond to s = 8 √ TeV and the other two to s = 7 TeV. At each energy there is one sample for which the second top quark decays only hadronically and one sample where the W boson from the second top quark decays leptonically, including tau leptons which are decayed using TAUOLA [55]. The hadronic and the leptonic samples are added with weights corresponding to the respective decay fractions of the W boson. At 8 TeV, two additional samples were generated where one top quark decays to an up quark (instead of a charm quark) and a Higgs boson, which allow for the determination of the ratio of the acceptances of the t → uH and t → cH decay modes. The contributions of known SM sources of Higgs boson production are estimated simulating Higgs boson production by gluon fusion (ggF ), by vector boson fusion (VBF), Higgs-strahlung associated production (W H and ZH), and associated production of Higgs. –6–.
(9) boson and a tt pair (ttH). The first two were produced using POWHEG [56, 57] interfaced to PYTHIA8 [58] for the Higgs boson decay, PS, MI and hadronisation, and the last three by PYTHIA8. Non-resonant production of two-photon final states with several additional jets dominates the background in the hadronic selection. This was simulated using SHERPA [59] with up to three additional partons in the primary hard interaction (this sample, of about 107 events, is called Sγγj in the following). The same final state where one of the photons is a fake photon candidate resulting from jet misidentification also contributes to the hadronic background (see Refs. [37, 60]). The level of this additional contribution, for final states with several jets, is estimated by data-driven methods to be about 18% of the background with two real photons. Comparative studies using dedicated simulations for the hadronic background with fake photon candidates show that, within the limited statistical precision of these simulations due to the high rejection power of the photon identification, the distributions relevant for the hadronic analysis (see Sec. 4.1) are compatible with those from the Sγγj sample. The latter is thus used in the following to represent both backgrounds. Finally samples of tt (∼ 1.5 · 107 events) and W (γ) (∼ 2.3 · 107 events) production simulated with MC@NLO [61] and ALPGEN [62], respectively, interfaced to HERWIG [63] and JIMMY [64], were used to estimate the contribution of these processes. The W (γ) sample is a W sample in which the production of one photon at the matrix element level is imposed, and a lepton filter is applied. In all samples but the Sγγj one, PHOTOS [65] is employed to describe additional photon radiation from charged leptons. All samples were processed through a full simulation of the ATLAS detector [66] based on the GEANT4 package [67]. A modelling of the event pile-up from the same and nearby bunch crossings, tuned to the data, is also included. The simulations are corrected using weights to reflect the number of interactions per bunch crossing and the spread of the z position of the primary vertex observed in data. Differences in efficiencies between data and simulation for object reconstruction and identification are corrected in the same way.. 4. Analysis strategy and candidate event selection. Events are first required to fulfill the criteria used for the Higgs boson analysis in the γγ channel [37], namely to contain at least two reconstructed photon candidates in the fiducial region of the calorimeter |η| < 2.37, but excluding the transition region between the barrel and endcap calorimeters, 1.37 < |η| < 1.56. The leading (subleading) photon candidate is required to have ET > 40 GeV (30 GeV). Tight identification and isolation criteria, as described above, are applied to both photon candidates. Additional requirements are applied in order to select events compatible with a tt intermediate state. Finally the diphoton mass distribution of the selected events is analysed using a sideband technique in order to estimate the background in the signal region. √ In the s = 8 TeV data set, candidates which contain one and only one lepton are treated in the leptonic analysis while events having no leptons are treated in the hadronic. –7–.
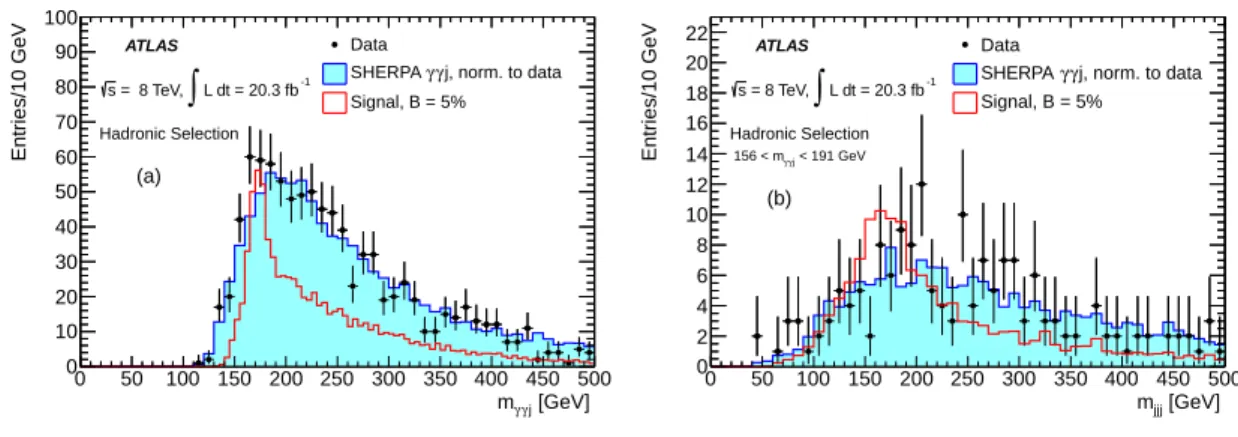
(10) analysis, and events with two or more leptons are rejected. At 7 TeV no analysis in the leptonic channel was performed. Due to the smaller data sample and the lower sensitivity of the leptonic channel compared to the hadronic one, this has no significant impact on the precision of the final results. 4.1. Selection of hadronically decaying top quarks. 100 90 80 70 60 50. Data. ATLAS s = 8 TeV,. Entries/10 GeV. Entries/10 GeV. Events are required to have at least four jets among which at least one is b-tagged. In case of more than four jets, the four leading ones (ordered in decreasing pT ) are considered. However, the jet ranked 4th in pT is replaced by the 5th one if the former is not b-tagged and the latter is. This procedure is extended to the 6th jet if the 5th is not b-tagged either. The signal sample shows that such a jet replacement happens for about 6% of the events, and that the acceptance is increased by about the same amount. After the selection of four jets, one top-quark candidate, Top1, is constructed from the two photons and one jet, and another top-quark candidate, Top2, is formed from the three remaining jets. At least one of the four possible pairs must have masses m1 ≡ mγγj and m2 ≡ mjjj that lie within certain mass windows of size ∆m1 and ∆m2 around the topquark mass (see below). Additional requirements, such as associating the b-tagged jet with Top2 and imposing the invariant mass of the remaining two jets of Top2 to be compatible with the W -boson mass were considered but not retained as they did not significantly improve the expected significance. Figure 1(a) shows the distribution of m1 (four entries per event) for all selected events √ before mass cuts in the s = 8 TeV data set.. ∫ L dt = 20.3 fb. -1. SHERPA γ γ j, norm. to data Signal, B = 5%. Hadronic Selection. (a). 40. 14 12 10. ATLAS s = 8 TeV,. ∫ L dt = 20.3 fb. -1. Data SHERPA γ γ j, norm. to data Signal, B = 5%. Hadronic Selection 156 < mγ γ j < 191 GeV. (b). 8 6 4. 30 20 10 0 0. 22 20 18 16. 50. 100 150 200 250 300 350 400 450 500 mγ γ j [GeV]. 2 0 0. 50. 100 150 200 250 300 350 400 450 500 mjjj [GeV]. Figure 1. (a) Distribution of the invariant mass mγγj (Top1), for events selected by the hadronic √ analysis (see text for details) in the s = 8 TeV data set, with at least one b-tagged jet. For each event there are four mγγj combinations, and all four are displayed. (b) Distribution of the invariant mass mjjj for the complementary top candidates (Top2) decaying into 3 jets; only combinations for which mγγj is between 156 and 191 GeV enter in the distribution.. In the simulated signal sample, normalised to the expectation for an arbitrary 5% t → cH branching ratio, the narrow peak associated with the top quark is clearly visible. The combinatorial background has a shape similar to the distribution obtained with the. –8–.
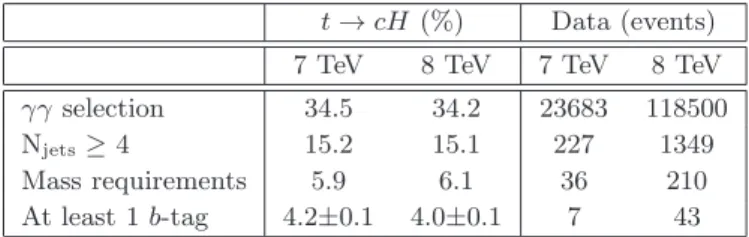
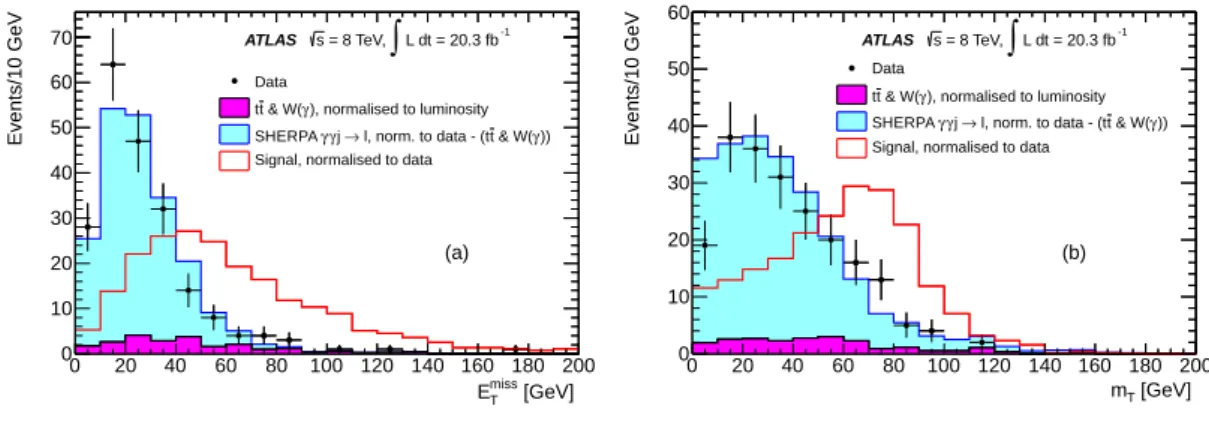
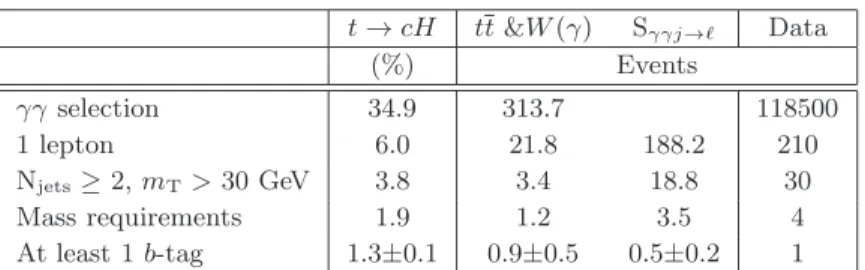
(11) Sγγj sample (normalised to data in the mass region [0,500] GeV). The background from tt and W (γ) production is negligible. The chosen ∆m1 interval is [156,191] GeV. The distribution of m2 is shown in Fig. 1(b). Only combinations for which m1 fulfills the ∆m1 condition enter in this figure. The simulated signal distribution shows that the peak associated with Top2 is broader than for Top1. The combinatorial background has a shape similar to the distribution obtained with the Sγγj sample (normalised as for the Top1 case). The chosen ∆m2 interval is [130,210] GeV. The ∆m1 and ∆m2 intervals are determined on the basis of the mass resolutions observed in the simulation. The expected significance is stable with respect to moderate variations of the mass criteria around the √ chosen values. The reconstructed mass distributions of top candidates at s = 7 TeV are similar to the ones shown at 8 TeV, and the same mass intervals are used. An overview of the hadronic selection at various stages of the analysis is shown in √ √ Table 1 for both the s = 7 TeV and s = 8 TeV samples. Table 1. Efficiency (in percent) for t → cH signal simulation and number of events for data, at √ √ s = 7 TeV and s = 8 TeV for the hadronic selection, at different stages of the event selection. The uncertainties on the efficiencies for the full selection, shown in the last row, are statistical only. t → cH (%) γγ selection Njets ≥ 4 Mass requirements At least 1 b-tag. Data (events). 7 TeV. 8 TeV. 7 TeV. 8 TeV. 34.5 15.2 5.9 4.2±0.1. 34.2 15.1 6.1 4.0±0.1. 23683 227 36 7. 118500 1349 210 43. The γγ mass (mγγ ) spectrum for data after the complete selection is shown in Fig. 2 together with the corresponding distribution for the Sγγj sample. The latter shows a satisfactory modeling of the background outside the expected signal mass range, as is also the case at earlier stages of the analysis with much larger statistics. 4.2. Selection of leptonically decaying top quarks. The aim of the leptonic analysis is to identify candidate events in which the W boson from the second top quark decays leptonically. Only electrons and muons are considered as identified leptons, and only events with exactly one lepton are considered. Events with two or more jets are retained for the subsequent steps. The lepton pT is used together miss to calculate the transverse mass m of the W candidate, and m > 30 GeV is with ET T T required. At this stage, no event is selected in the Sγγj sample, due to the high rejection power of the electron and muon identification requirements. In order to have a larger event sample to represent this background, one randomly chosen jet per event, among jets with |η| < 2.5 and pT > 15 GeV, was replaced by a lepton with the same momentum vector. This sample, named Sγγj→ℓ , gives a good description of the data, as shown in Fig. 3(a) miss and Fig. 3(b) for m . In Fig. 3 the sample referred to as tt&W (γ) originates for ET T from the tt and W (γ) simulations, normalised to the luminosity of the data set, while the Sγγj→ℓ sample is normalised to data, after subtraction of the tt&W (γ) background.. –9–.
(12) Events/2 GeV. 25. Data. ATLAS. 20 15. SHERPA γ γ j, norm. to data. ∫ L dt = 20.3 fb s = 7 TeV, ∫ L dt = 4.7 fb. -1. s = 8 TeV,. Signal, B = 5%. -1. Hadronic Selection. 10 5 0 100. 110. 120. 130. 140. 150 160 mγ γ [GeV]. 70. ATLAS. 60. s = 8 TeV,. ∫ L dt = 20.3 fb. Events/10 GeV. Events/10 GeV. Figure 2. Distribution of the invariant mass of the two photons, mγγ , for events passing the full hadronic selection (see text for details). The Sγγj background sample is normalised to data.. -1. Data tt & W(γ ), normalised to luminosity. 50. SHERPA γ γ j → l, norm. to data - (tt & W(γ )). 60 ATLAS. ∫ L dt = 20.3 fb. -1. 50 40. SHERPA γ γ j → l, norm. to data - (tt & W(γ )). tt & W(γ ), normalised to luminosity Signal, normalised to data. Signal, normalised to data. 40. s = 8 TeV,. Data. 30. 30 20. (a). 20. 10. 10 0 0. (b). 20. 40. 60. 80. 100 120 140 160 180 200 Emiss [GeV] T. 0 0. 20. 40. 60. 80. 100 120 140 160 180 200 mT [GeV]. miss Figure 3. Distributions of (a) the missing transverse energy ET and (b) the transverse mass mT of the W candidates for events with two high pT photons and one lepton. The tt&W (γ) and Sγγj→ℓ background samples are defined in the text.. The two leading jets are considered. However, as for the hadronic selection, some priority is given to b-tagged jets: if the jet ranked second is not b-tagged and if there is a b-tagged third jet that passes all other requirements, the second jet is replaced by the third. The replacement procedure is repeated in case there is a 4th b-tagged jet and the second and third were not b-tagged. The signal simulation shows that such a jet replacement happens for about 9% of the events and that the acceptance is increased by about the same amount. After the above selection of two jets, one top-quark candidate, Top1, is constructed from the two photons and one jet; its invariant mass is m1 ≡ mγγj . Another top-quark candidate, Top2, is built from the remaining selected jet, the lepton and the neutrino, with invariant mass m2 ≡ mℓνj . The longitudinal momentum of the neutrino is estimated using a W -mass constraint. In the case of two real solutions 5 , the one giving m2 closer 5. In case no real solution exists, the constraint is applied by replacing mW by mT + 100 MeV, which. – 10 –.
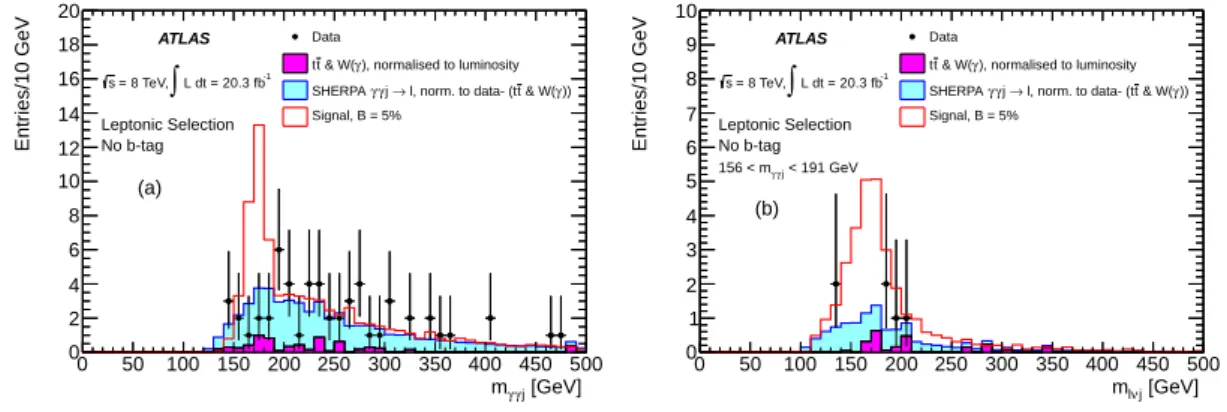
(13) 20 16 14 12 10. Data. ATLAS. 18. s = 8 TeV,. ∫ L dt = 20.3 fb. Leptonic Selection No b-tag. Entries/10 GeV. Entries/10 GeV. to the top-quark mass is chosen. At least one of the two possible (Top1, Top2) pairs must have masses that lie within certain windows around the top-quark mass (see below). Furthermore it is required that at least one of the two jets is b-tagged. Fig. 4(a) shows the invariant mass distribution of the Top1 combinations (two entries per event) for all selected events before the mass selections, and without the b-tagging requirement. In the signal sample, normalised to the expectation for a 5% t → cH branching ratio, the narrow peak associated with the top quark is clearly visible, as well as a tail at higher masses corresponding to the wrong combination of final state objects. The Sγγj→ℓ sample, together with the tt and W (γ) contributions give a reasonable description of the data. The interval ∆m1 chosen for the m1 selection is [156,191] GeV, as in the hadronic case. Only combinations for which m1 fulfills the ∆m1 selection enter in the Top2 distribution (Fig. 4(b)). Based on the width of the peak in the signal simulation, the interval ∆m2 is chosen to be [135,205] GeV, a little narrower than for the hadronic mode.. -1. t t & W(γ ), normalised to luminosity SHERPA γ γ j → l, norm. to data- (tt & W(γ )) Signal, B = 5%. 10 8 7 6 5. (a). 8. 4. 6. 3. 4. 2. 2. 1. 0 0. 0 0. 50. 100 150 200 250 300 350 400 450 500 mγ γ j [GeV]. Data. ATLAS. 9. s = 8 TeV,. ∫ L dt = 20.3 fb. Leptonic Selection No b-tag. -1. t t & W(γ ), normalised to luminosity SHERPA γ γ j → l, norm. to data- (tt & W(γ )) Signal, B = 5%. 156 < mγ γ j < 191 GeV. (b). 50. 100 150 200 250 300 350 400 450 500 mlν j [GeV]. Figure 4. (a) Distribution of the invariant mass mγγj (Top1) candidates , for events selected by the √ leptonic analysis (see text for details) in the s = 8 TeV data set, before b-tagging requirement. For each event there are two combinations, and both are displayed. (b) Distribution of the invariant mass mlνj for the complementary top candidates (Top2) decaying into one jet, a lepton and a neutrino; only combinations for which mγγj is between 156 and 191 GeV enter in the distribution.. Table 2 shows an overview of the leptonic selection at various stages of the analysis. Inclusive tt and W (γ) production, normalised to the luminosity of the data, are expected to contribute about 0.7 and 0.3 events, respectively, and the Sγγj→ℓ background about half an event. In the data a single event remains with a γγ mass of 147 GeV and a muon with pT of 47 GeV. The satisfactory agreement observed between data and background expectations indicates a good understanding of the background composition. However, as a sideband technique is used, only the shape of the background is relevant. Out of the three main contributions to the background (tt, W (γ) and hadronic) the first two suffer from low statistics in the simulation. At earlier stages of the analysis, where more events are available, the distributions are smooth and exhibit a decreasing slope, compatible with the function used in Sec. 5.2 to describe the background shape. ensures two, almost degenerate, real solutions.. – 11 –.
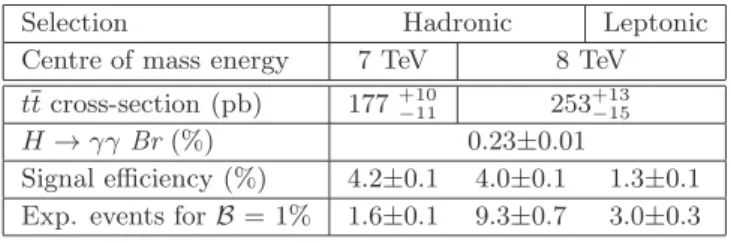
(14) Table 2. Efficiency (in percent) for t → cH signal simulation and numbers of events selected for data or expected (tt&W (γ), Sγγj→ℓ ) at different stages of the analysis, in the leptonic selection. The column denoted by “tt&W (γ)” is normalised to the luminosity of the data. The column denoted by Sγγj→ℓ is normalised to data after subtraction of the expected background from tt and W (γ) at the “2 photons + 1 lepton” selection step. The uncertainties are statistical only for t → cH and tt&W (γ), but include the normalisation uncertainty for Sγγj→ℓ .. γγ selection 1 lepton Njets ≥ 2, mT > 30 GeV Mass requirements At least 1 b-tag. 5. t → cH (%). tt &W (γ). 34.9 6.0 3.8 1.9 1.3±0.1. 313.7 21.8 3.4 1.2 0.9±0.5. Sγγj→ℓ Events 188.2 18.8 3.5 0.5±0.2. Data 118500 210 30 4 1. Statistical analysis and results. The parameter of interest is the branching ratio B of the decay t → c(u)H. A fit to the data is performed using a likelihood function defined as the product of the likelihoods for the individual search channels, whose sensitivities as a function of B are given in Sec. 5.1. Hypothesised values of B are evaluated with a test statistic based on the profile likelihood ratio [68]. In the hadronic selection, which combines the 7 and 8 TeV data, mγγ is used as discriminating variable in the fit. The analysis in the leptonic selection is based on event counting in two mγγ regions: the signal region (SR) from 122 to 129 GeV, and the control region (CR) from 100 to 122 GeV and from 129 to 160 GeV. The theoretical uncertainties enter mainly through the tt production cross-section, the Higgs boson branching ratio to γγ, the background due to SM Higgs production (Sec. 5.3) and the signal generator uncertainties (Sec. 5.4). The experimental systematic uncertainties are detailed in Sec. 5.4. All these uncertainties are introduced as nuisance parameters in the likelihood. 5.1. Expected signal event yields. The expected signal event yields in the three channels (hadronic 7 TeV, hadronic 8 TeV and leptonic 8 TeV) are estimated using the signal efficiencies given in Tables 1 and 2, the tt production cross-sections at 7 and 8 TeV [69, 70], and the integrated luminosities of the corresponding data sets. They are listed in Table 3, where they are expressed in terms of the number of events expected for a t → cH branching ratio of 1%. The same study with t → uH shows that the efficiency of the hadronic analysis is 1% higher than for t → cH, while it is 6% lower for the leptonic analysis. These variations are small enough to justify taking the same sensitivity for both modes. The sensitivities are evaluated for a Higgs boson mass of 125.5 GeV [37]. A correction of -1% (+1.5%) is applied on the hadronic (leptonic) efficiency, obtained from a linear interpolation of the acceptances estimated at particle level for simulations with masses of. – 12 –.
(15) 125 and 126.8 GeV. Changing the top quark mass from 172.5 to 173.1 GeV increases the acceptances by about 1.6% while the tt production cross-section is decreased by about 1.8%. The net effect is thus neglected. The effect of small differences between data and simulation in b-tagging and photon isolation efficiencies is also included in Table 3. The generator and the experimental systematic uncertainties, not included in Table 3, are described in Sec. 5.4. As pointed out above, the 7 TeV and the 8 TeV hadronic channels are treated as a single channel, whose combined expected event yield is 10.9 ± 0.8 events for B = 1%. Table 3. Expected signal efficiencies and event yields for a t → cH branching ratio of 1% and mt =172.5 GeV in the three analysis channels. The values used for the tt cross-section and the H → γγ branching fraction are quoted for completeness. Selection Centre of mass energy tt cross-section (pb) H → γγ Br (%) Signal efficiency (%) Exp. events for B = 1%. 5.2. Hadronic 7 TeV 177. +10 −11. 4.2±0.1 1.6±0.1. Leptonic 8 TeV. 253+13 −15 0.23±0.01 4.0±0.1 1.3±0.1 9.3±0.7 3.0±0.3. Signal and background modelling. The shape of the signal diphoton mass distribution is similar to the shape used in the H → γγ inclusive analysis [37], for a signal mass hypothesis mH = 125.5 GeV. It is described by the sum of a wide Gaussian and a Crystal Ball function with width σ ≃ 1.7 GeV, and differs slightly between the 7 and 8 TeV analyses. The fraction of the signal that falls into the SR is estimated to be ∼ 90%. The same shape is used for the resonant background from SM Higgs boson production. Background estimate for the hadronic channel Due to low statistics the data distribution in the CR alone cannot be used to constrain the background shape. Instead, the diphoton mass spectrum from the Sγγj sample (see Fig. 2) smoothed using the algorithm of Ref. [71] is employed. Pseudo-data have been generated following this distribution, with on average 45.2 events (given by the sum of the 38 data events in the CR and the associated SR contribution of 7.2 events assuming that the true probability density function is the smoothed one). The corresponding mγγ spectra have been fitted with different parametrisations for the background shape. For fits with only the background, a bias has been defined as the difference, in the SR, between the true number of events and the number of events predicted by the fit. For fits including the signal, the bias is defined as the number of fitted signal events. The criterion used to select a background parametrisation as valid is that these biases should be smaller than 10% of the number of signal events at the expected limit (∼ 6 events). The background-only and the signal+background fits give consistent results. Both 2nd and 3rd order polynomial distributions satisfy the criterion, and the 2nd order polynomial was chosen. The associated. – 13 –.
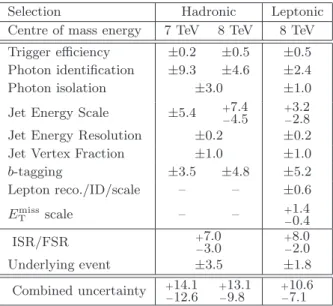
(16) bias with respect to the smoothed Sγγj distribution is ∼ 0.6 event. It is added as a systematic uncertainty in the final fit. Background estimate for the leptonic analysis The background in the leptonic channel is estimated via a transfer factor α, defined as the ratio of the background shape integral over the SR and its integral over the CR. The central value of α in the fit is given by the smoothed function used for the hadronic analysis, α = 0.15. For a flat mγγ distribution α ≃ 0.13 would be obtained. A Gaussian constraint on α with a conservative width of 30% is included in the likelihood function. 5.3. Background from SM Higgs production. The estimate of the expected number of background events from SM Higgs production is obtained by combining the cross-sections for Higgs boson production via the ggF , VBF, W H, ZH and ttH processes [72, 73], assuming they all follow the SM predictions, the integrated luminosities of the 7 TeV and 8 TeV data sets, and the event selection efficiencies determined using full simulation for each production mode (see Sec. 3.3). The uncertainties on the cross-sections are obtained by a linear sum of the renormalisation and factorisation scale uncertainties on one hand, and of the parton distribution functions and αs uncertainties on the other hand, as they appear in Refs. [72, 73]. The VBF process gives a negligible contribution. In the absence of fully simulated samples for the tH production, for which the cross-section was only recently calculated [74, 75], the acceptance is obtained from particle level simulation, scaled by the ratio of acceptances for full and particle level simulations obtained for topologically similar final states (tcH and ttH final states were used). Since the ggF and W H processes produce a Higgs boson with a small number of jets, among which there is in general no b-jet, an additional systematic uncertainty is added. For the ggF mode, several variations of POWHEG+PYTHIA8 [76] with up to three partons at the matrix element level were compared, from which a 40% uncertainty was deduced. For the W H process, which is simulated at LO, the uncertainty is enlarged to 100%. The uncertainty on ZH is not increased as this process produces b-jets from the Z-boson decay. In total, for the hadronic selection, the background from SM Higgs production is 0.24±0.05 event at 8 TeV and 0.04±0.01 at 7 TeV, with uncertainties taken as fully correlated. The largest contribution is from the ttH mode, which represents about 60% of the total. In the leptonic selection, the total background due to SM Higgs production amounts to 0.05±0.01 event, and 90% of this background arises from ttH production. 5.4. Experimental systematic uncertainties. The experimental systematic uncertainties are listed in Table 4. • The uncertainties related to photons are described in Sec. 2 for the trigger efficiency, and in Sec. 3.1 for the photon identification and isolation. • The systematic uncertainty associated with the Jet Energy Scale (JES) is determined by changing by one standard deviation, in each direction and one at a time, each of. – 14 –.
(17) Table 4. Summary of experimental and generator (see text) uncertainties on the signal and SM Higgs boson background yields (in percent, per event). The last row gives the sum in quadrature of all these uncertainties. Selection Centre of mass energy. Hadronic 7 TeV 8 TeV. Leptonic 8 TeV. Trigger efficiency Photon identification Photon isolation. ±0.2 ±0.5 ±9.3 ±4.6 ±3.0 +7.4 ±5.4 −4.5 ±0.2 ±1.0 ±3.5 ±4.8 – –. ±0.5 ±2.4 ±1.0 +3.2 −2.8 ±0.2 ±1.0 ±5.2 ±0.6 +1.4 −0.4 +8.0 −2.0 ±1.8 +10.6 −7.1. Jet Energy Scale Jet Energy Resolution Jet Vertex Fraction b-tagging Lepton reco./ID/scale miss ET scale. –. – +7.0 −3.0. ISR/FSR Underlying event. ±3.5. Combined uncertainty. +14.1 −12.6. +13.1 −9.8. the parameters to which the energy scale is sensitive. The most sensitive parameters are associated with pile-up and jet flavour. At 8 TeV the quadratic sum of the uncertainties obtained from all variations gives a total effect on the expected signal yield of (+7.4%,−4.5%). At 7 TeV the global effect is more symmetric (±5.4%). The smaller JES uncertainty in the leptonic channel was obtained in the same way and miss . The same methodology was used for the Jet Energy includes its impact on ET Resolution (JER), whose uncertainty has a smaller impact on the signal yield. • The systematic uncertainty associated with the JVF selection is estimated by varying the corresponding requirement within the boundaries resulting from dedicated studies [77]. It amounts to 1% for both the hadronic and the leptonic selections. The same uncertainty is also used at 7 TeV. • In order to take into account the small differences in b-tagging efficiency between data and simulation for each jet flavour (light, charm and bottom-quark jets) [50], the nominal values of the associated scale factors are included in the event weights of the simulated samples. Replacing the nominal scale factors by the values obtained when adding (subtracting) their uncertainty induces variations of the expected signal yield of the order of 5%. • The uncertainty associated with the lepton energy scale, identification and reconstruction efficiency, averaged for electrons and muons, is 0.6%. miss was obtained with the same • The uncertainty, of about 1%, associated with ET methodology as that used for the jet energy scale, applied to low-ET topological. – 15 –.
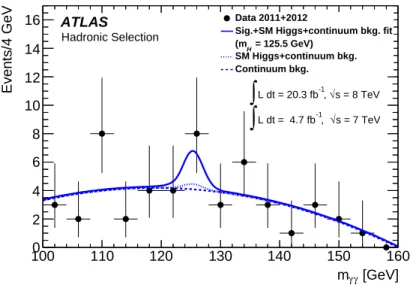
(18) miss and which are not associated with any of clusters included in the estimate of ET the objects used to reconstruct the final state.. The generator uncertainties are evaluated as follows: • The uncertainty labelled “ISR/FSR” in Table 4 corresponds to the variation of the signal acceptance observed at particle level when the parameters governing QCD initial and final state radiation in PYTHIA6 are varied within the allowed range [78]. • The systematic uncertainty associated with the underlying event modelling is estimated by scaling, in the simulation, the transverse momenta of particles produced at |η| > 2 within the range allowed by the differences between tunes 6 and re-estimating the selection efficiency. 5.5. Results. Events/4 GeV. A fit using the likelihood described at the beginning of this section is performed on the selected data sample, consisting of 50 events in the hadronic channel and one event in the leptonic channel. 16. Data 2011+2012 Sig.+SM Higgs+continuum bkg. fit (mH = 125.5 GeV) SM Higgs+continuum bkg. Continuum bkg.. ATLAS Hadronic Selection. 14 12. ∫ L dt = 20.3 fb , √s = 8 TeV ∫ L dt = 4.7 fb , √s = 7 TeV -1. 10. -1. 8 6 4 2 0 100. 110. 120. 130. 140. 150 160 mγ γ [GeV]. Figure 5. Distribution of mγγ for the selected events in the hadronic channel. The result of a fit to the data of the sum of a signal component with the mass of the Higgs boson fixed to mH = 125.5 GeV and a background component (dashed) described by a second-order polynomial is superimposed. The small contribution from SM Higgs boson production, included in the fit, is also shown (difference between the dotted and dashed lines).. The diphoton mass spectrum in the hadronic channel is shown in Fig. 5, together with the fitted background shape and the signal shape for a Higgs boson mass fixed at 125.5 GeV. The fitted branching ratio is B = 0.22+0.31 −0.26 %, which corresponds to a total number 6. The particle flow observed in various data samples for |η| < 2 is well described by standard QCD PS and MI tunes.. – 16 –.
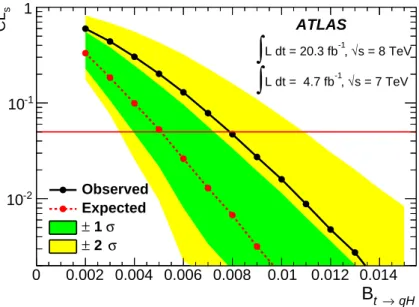
(19) of signal events (hadronic and leptonic) of 3.1+4.3 −3.7 . The probability that the background can produce a fluctuation greater than or equal to the excess observed in data is 18%. As no significant signal is found, limits on the t → cH and t → uH branching ratios are set based on the CLs prescription [79]. The evolution of the signal confidence level CLs as a function of the branching fraction B for t → qH is shown in Fig. 6. Pseudo-experiments have been used to determine the distributions of the test statistic under the signal+background and the background-only hypotheses. The green and yellow areas represent the one and two standard deviation bands around the expectation. The observed (expected) limit on B is 0.79 (0.51)% at the 95% confidence level. The observed limit is not as stringent as the expectation due to a slight excess over the total background expectation in the vicinity of mγγ ∼ 126 GeV, as seen in Fig. 5. From this limit, an upper limit on the λtcH coupling of 0.17 was obtained, with an expected value of 0.14. As the analysis is equally sensitiveqto the t → uH and λ2tcH + λ2tuH < 0.17,. CLs. t → cH modes, the limit obtained on the couplings can be written as with an expectation of 0.14. 1 ATLAS. ∫L dt = 20.3 fb , √s = 8 TeV ∫L dt = 4.7 fb , √s = 7 TeV -1. -1. 10-1. 10-2. 0. Observed Expected ±1σ ±2 σ. 0.002 0.004 0.006 0.008. 0.01 0.012 0.014. Bt. → qH. Figure 6. Evolution of CLs as a function of the branching fraction B of the t → qH decay for the observation of a signal at 125.5 GeV (solid line) and the expectation in the absence of signal (dashed line). The 1 and 2 σ uncertainty bands around the expected curve are also shown.. 6. Conclusions. The FCNC t → qH decay, followed by H → γγ, has been searched for in a data set of proton-proton collisions recorded by the ATLAS experiment, consisting of 4.7 fb−1 at √ √ s = 7 TeV and 20.3 fb−1 at s = 8 TeV. Candidate events were selected by requiring the presence of two high-ET isolated photons. Further selection criteria included the presence of four jets (at least one b-tagged) for miss and an isolated lepton for the hadronic selection, or two jets (at least one b-tagged), ET. – 17 –.
(20) the leptonic selection, plus kinematic conditions designed to enhance the fraction of events with a tt topology. A sideband technique was used to constrain the background, and an expected upper limit on the t → cH decay branching ratio in the absence of signal of 0.51% was calculated. No statistically significant excess was observed in the data, and a limit of 0.79% was set at the 95% confidence level for mH = 125.5 GeV. From this limit, an upper limit on the λtcH coupling of 0.17 was obtained, with an expected value of 0.14. As the analysis is equally sensitive to the q t → uH and t → cH modes, the limit obtained can more generally be expressed as. λ2tcH + λ2tuH < 0.17.. Acknowledgments We thank CERN for the very successful operation of the LHC, as well as the support staff from our institutions without whom ATLAS could not be operated efficiently. We acknowledge the support of ANPCyT, Argentina; YerPhI, Armenia; ARC, Australia; BMWF and FWF, Austria; ANAS, Azerbaijan; SSTC, Belarus; CNPq and FAPESP, Brazil; NSERC, NRC and CFI, Canada; CERN; CONICYT, Chile; CAS, MOST and NSFC, China; COLCIENCIAS, Colombia; MSMT CR, MPO CR and VSC CR, Czech Republic; DNRF, DNSRC and Lundbeck Foundation, Denmark; EPLANET, ERC and NSRF, European Union; IN2P3-CNRS, CEA-DSM/IRFU, France; GNSF, Georgia; BMBF, DFG, HGF, MPG and AvH Foundation, Germany; GSRT and NSRF, Greece; ISF, MINERVA, GIF, I-CORE and Benoziyo Center, Israel; INFN, Italy; MEXT and JSPS, Japan; CNRST, Morocco; FOM and NWO, Netherlands; BRF and RCN, Norway; MNiSW and NCN, Poland; GRICES and FCT, Portugal; MNE/IFA, Romania; MES of Russia and ROSATOM, Russian Federation; JINR; MSTD, Serbia; MSSR, Slovakia; ARRS and MIZŠ, Slovenia; DST/NRF, South Africa; MINECO, Spain; SRC and Wallenberg Foundation, Sweden; SER, SNSF and Cantons of Bern and Geneva, Switzerland; NSC, Taiwan; TAEK, Turkey; STFC, the Royal Society and Leverhulme Trust, United Kingdom; DOE and NSF, United States of America. The crucial computing support from all WLCG partners is acknowledged gratefully, in particular from CERN and the ATLAS Tier-1 facilities at TRIUMF (Canada), NDGF (Denmark, Norway, Sweden), CC-IN2P3 (France), KIT/GridKA (Germany), INFN-CNAF (Italy), NL-T1 (Netherlands), PIC (Spain), ASGC (Taiwan), RAL (UK) and BNL (USA) and in the Tier-2 facilities worldwide.. References [1] ATLAS Collaboration, Observation of a new particle in the search for the Standard Model Higgs boson with the ATLAS detector at the LHC, Phys. Lett. B716 (2012) 1, [arXiv:1207.7214]. [2] CMS Collaboration, Observation of a new boson at a mass of 125 GeV with the CMS experiment at the LHC, Phys. Lett. B716 (2012) 30, [arXiv:1207.7235]. [3] F. Englert and R. Brout, Broken Symmetry and the Mass of Gauge Vector Mesons, Phys. Rev. Lett. 13 (1964) 321.. – 18 –.
(21) [4] P. W. Higgs, Broken symmetries, massless particles and gauge fields, Phys. Lett. 12 (1964) 132. [5] P. W. Higgs, Broken symmetries and the masses of gauge bosons, Phys. Rev. Lett. 13 (1964) 508. [6] G. Guralnik, C. Hagen, and T. Kibble, Global Conservation Laws and Massless Particles, Phys. Rev. Lett. 13 (1964) 585. [7] S. L. Glashow, J. Iliopoulos, and L. Maiani, Weak Interactions with Lepton-Hadron Symmetry, Phys. Rev. D2 (1970) 1285. [8] J. Aguilar-Saavedra, Top flavor-changing neutral interactions: Theoretical expectations and experimental detection, Acta Phys. Polon. B35 (2004) 2695, [hep-ph/0409342]. [9] ALEPH Collaboration, A. Heister et al., Search for single top production in e+ e− collisions √ at s up to 209 GeV, Phys. Lett. B543 (2002) 173, [hep-ex/0206070]. [10] DELPHI Collaboration, J. Abdallah et al., Search for single top production via FCNC at √ LEP at s = 189 GeV to 208 GeV, Phys. Lett. B590 (2004) 21, [hep-ex/0404014]. [11] L3 Collaboration, P. Achard et al., Search for single top production at LEP, Phys. Lett. B549 (2002) 290, [hep-ex/0210041]. [12] OPAL Collaboration, G. Abbiendi et al., Search for single top quark production at LEP-2, Phys. Lett. B521 (2001) 181, [hep-ex/0110009]. [13] H1 Collaboration, A. Aktas et al., Search for single top quark production in ep collisions at HERA, Eur. Phys. J. C33 (2004) 9, [hep-ex/0310032]. [14] ZEUS Collaboration, H. Abramowicz et al., Search for single-top production in ep collisions at HERA, Phys. Lett. B708 (2012) 27, [arXiv:1111.3901]. [15] CDF Collaboration, T. Aaltonen et al., Search for the Flavor Changing Neutral Current √ Decay t → Zq in pp̄ Collisions at s = 1.96 TeV, Phys. Rev. Lett. 101 (2008) 192002, [arXiv:0805.2109]. [16] ATLAS Collaboration, A search for flavour-changing neutral currents in top-quark decays in √ pp collision data collected with the atlas detector at s = 7 TeV, JHEP 1209 (2012) 139, [arXiv:1206.0257]. [17] CMS Collaboration, Search for flavor-changing neutral currents in top-quark decays t → Zq √ in pp collisions at s=8 TeV, arXiv:1312.4194. [18] J. A. Aguilar-Saavedra and B. M. Nobre, Rare top decays t → cγ, t → cg and CKM unitarity, Phys. Lett. B553 (2003) 251, [hep-ph/0210360]. [19] F. del Aguila, J. A. Aguilar-Saavedra, and R. Miquel, Constraints on top couplings in models with exotic quarks, Phys. Rev. Lett. 82 (1999) 1628. [20] J. Aguilar-Saavedra, Effects of mixing with quark singlets, Phys. Rev. D67 (2003) 035003, [hep-ph/0210112]. Erratum-ibid. D69 (2004) 099901. [21] C. S. Li, R. J. Oakes, and J. M. Yang, Rare decay of the top quark in the minimal supersymmetric model, Phys. Rev. D49 (1994) 293. Erratum-ibid. D56 (1997) 3156. [22] G. M. de Divitiis, R. Petronzio, and L. Silvestrini, Flavour-changing top decays in supersymmetric extensions of the standard model, Nucl. Phys. B504 (1997) 45, [hep-ph/9704244].. – 19 –.
(22) [23] J. L. Lopez, D. V. Nanopoulos, and R. Rangarajan, New supersymmetric contributions to t → cV , Phys. Rev. D56 (1997) 3100, [hep-ph/9702350]. [24] J. Guasch and J. Sola, FCNC top quark decays: A door to SUSY physics in high luminosity colliders?, Nucl. Phys. B562 (1999) 3, [hep-ph/9906268]. [25] D. Delepine and S. Khalil, Top flavour violating decays in general supersymmetric models, Phys. Lett. B599 (2004) 62, [hep-ph/0406264]. [26] J. J. Liu, C. S. Li, L. L. Yang, and L. G. Jin, t → cV via SUSY FCNC couplings in the unconstrained MSSM, Phys. Lett. B599 (2004) 92, [hep-ph/0406155]. [27] J. J. Cao et al., SUSY-induced FCNC top-quark processes at the large hadron collider, Phys. Rev. D75 (2007) 075021, [hep-ph/0702264]. [28] T. P. Cheng and M. Sher, Mass Matrix Ansatz and Flavor Nonconservation in Models with Multiple Higgs Doublets, Phys. Rev. D35 (1987) 3484. [29] B. Grzadkowski, J. F. Gunion, and P. Krawczyk, Neutral current flavor changing decays for the Z boson and the top quark in two Higgs doublet models, Phys. Lett. B268 (1991) 106. [30] W.-S. Hou, Tree level t→ ch0 or h0 → tc decays, Phys. Lett. B296 (1992) 179. [31] M. E. Luke and M. J. Savage, Flavor changing neutral currents in the Higgs sector and rare top decays, Phys. Lett. B307 (1993) 387, [hep-ph/9303249]. [32] D. Atwood, L. Reina, and A. Soni, Phenomenology of two Higgs doublet models with flavor changing neutral currents, Phys. Rev. D55 (1997) 3156, [hep-ph/9609279]. [33] S. Bejar, J. Guasch, and J. Sola, Loop induced flavor changing neutral decays of the top quark in a general two-Higgs-doublet model, Nucl. Phys. B600 (2001) 21, [hep-ph/0011091]. [34] I. Baum, G. Eilam, and S. Bar-Shalom, Scalar FCNC and rare top decays in a two Higgs doublet model ”for the top”, Phys. Rev. D77 (2008) 113008, [hep-ph/0802.2622]. [35] K.-F. Chen, W.-S. Hou, C. Kao, and M. Kohda, When the Higgs meets the Top: Search for t → ch0 at the LHC, Phys. Lett. B725 (2013) 378, [arXiv:1304.8037]. [36] D. Atwood, S. K. Gupta, and A. Soni, Constraining the flavor changing Higgs couplings to the top-quark at the LHC, arXiv:1305.2427. [37] ATLAS Collaboration, Measurements of Higgs boson production and couplings in diboson final states with the ATLAS detector at the LHC, Phys. Lett. B726 (2013) 88, [arXiv:1307.1427]. [38] Particle Data Group, J. Beringer et al., Review of particle physics, Phys. Rev. D 86 (2012) 010001. http://pdg.lbl.gov/pdg.html. [39] C. Zhang and F. Maltoni, Top-quark decay into Higgs boson and a light quark at next-to-leading order in QCD, Phys. Rev. D88 (2013) 054005, [arXiv:1305.7386]. [40] A. Denner and T. Sack, The Top width, Nucl.Phys. B358 (1991) 46. [41] ATLAS Collaboration, The ATLAS Experiment at the CERN Large Hadron Collider, JINST 3 (2008) S08003. √ [42] ATLAS Collaboration, Improved luminosity determination in pp collisions at s = 7 TeV using the ATLAS detector at the LHC, Eur. Phys. J. C73 (2013) 2518, [arXiv:1302.4393]. [43] ATLAS Collaboration, Measurement of the inclusive isolated prompt photon cross section in √ pp collisions at s = 7 TeV with the ATLAS detector using 4.6 fb−1 , arXiv:1311.1440.. – 20 –.
(23) [44] ATLAS Collaboration, Measurements of the photon identification with the ATLAS detector using 4.9 fb−1 of pp collision data collected in 2011, ATLAS-CONF-2012-123. http://cds.cern.ch/record/1473426. [45] W. Lampl et al., Calorimeter clustering algorithms: description and performance, ATL-LARG-PUB-2008-002. http://cds.cern.ch/record/1099735. [46] ATLAS Collaboration, Measurement of the inclusive isolated prompt photon cross section in √ pp collisions at s = 7 TeV with the ATLAS detector, Phys. Rev. D83 (2011) 052005, [arXiv:1012.4389]. [47] ATLAS Collaboration, Jet energy measurement with the ATLAS detector in proton-proton p collisions at (s) = 7 TeV, Eur. Phys. J. C73 (2013) 2304, [arXiv:1112.6426]. [48] M. Cacciari, G. P. Salam, and G. Soyez, The anti-kt jet clustering algorithm, JHEP 0804 (2008) 063, [arXiv:0802.1189]. [49] M. Cacciari and G. P. Salam, Pileup subtraction using jet areas, Phys. Lett. B659 (2008) 119, [arXiv:0707.1378]. [50] ATLAS Collaboration, Commissioning of the ATLAS high-performance b-tagging algorithms in the 7 TeV collision data, ATLAS-CONF-2011-102. http://cds.cern.ch/record/1369219. [51] ATLAS Collaboration, Electron performance measurements with the ATLAS detector using the 2010 LHC proton-proton collision data, Eur. Phys. J. C72 (2012) 1909, [arXiv:1110.3174]. [52] J. Aguilar-Saavedra, A minimal set of top-Higgs anomalous couplings, Nucl. Phys. B821 (2009) 215, [arXiv:0904.2387]. [53] T. Sjöstrand, S. Mrenna, and P. Z. Skands, PYTHIA 6.4 Physics and Manual, JHEP 0605 (2006) 026, [hep-ph/0603175]. [54] P. Z. Skands, Tuning Monte Carlo Generators: The Perugia Tunes, Phys. Rev. D82 (2010) 074018, [arXiv:1005.3457]. [55] S. Jadach, J. H. Kuhn, and Z. Was, TAUOLA: A Library of Monte Carlo programs to simulate decays of polarized tau leptons, Comput. Phys. Commun. 64 (1990) 275. [56] S. Alioli, P. Nason, C. Oleari, and E. Re, NLO Higgs boson production via gluon fusion matched with shower in POWHEG, JHEP 0904 (2009) 002, [arXiv:0812.0578]. [57] P. Nason and C. Oleari, NLO Higgs boson production via vector-boson fusion matched with shower in POWHEG, JHEP 1002 (2010) 037, [arXiv:0911.5299]. [58] T. Sjöstrand, S. Mrenna, and P. Z. Skands, A Brief Introduction to PYTHIA 8.1, Comput. Phys. Commun. 178 (2008) 852, [arXiv:0710.3820]. [59] T. Gleisberg et al., Event generation with SHERPA 1.1, JHEP 0902 (2009) 007, [arXiv:0811.4622]. [60] ATLAS Collaboration, Search for the Standard Model Higgs boson in the two photon decay channel with the ATLAS detector at the LHC, Phys. Lett. B705 (2011) 452, [arXiv:1108.5895]. [61] S. Frixione and B. R. Webber, Matching NLO QCD computations and parton shower simulations, JHEP 0206 (2002) 029, [hep-ph/0204244].. – 21 –.
(24) [62] M. L. Mangano, M. Moretti, F. Piccinini, R. Pittau, and A. D. Polosa, ALPGEN, a generator for hard multiparton processes in hadronic collisions, JHEP 0307 (2003) 001, [hep-ph/0206293]. [63] G. Corcella et al., HERWIG 6: An Event generator for hadron emission reactions with interfering gluons (including supersymmetric processes), JHEP 0101 (2001) 010, [hep-ph/0011363]. [64] J. Butterworth, J. R. Forshaw, and M. Seymour, Multiparton interactions in photoproduction at HERA, Z. Phys. C72 (1996) 637, [hep-ph/9601371]. [65] P. Golonka and Z. Was, PHOTOS Monte Carlo: A precision tool for QED corrections in Z and W decays, Eur. Phys. J. C45 (2006) 97, [hep-ph/0506026]. [66] ATLAS Collaboration, The ATLAS Simulation Infrastructure, Eur. Phys. J. C70 (2010) 823, [arXiv:1005.4568]. [67] GEANT4 Collaboration, S. Agostinelli et. al., GEANT4: A Simulation toolkit, Nucl. Instrum. Meth. A506 (2003) 250. [68] G. Cowan, K. Cranmer, E. Gross, and O. Vitells, Asymptotic formulae for likelihood-based tests of new physics, Eur. Phys. J. C71 (2011) 1554, [arXiv:1007.1727]. [69] M. Czakon, P. Fiedler, and A. Mitov, The total top quark pair production cross-section at hadron colliders through O(α4S ), Phys. Rev. Lett. 110 (2013) 252004, [arXiv:1303.6254]. [70] M. Botje et al., The PDF4LHC Working Group Interim Recommendations, arXiv:1101.0538. [71] K. S. Cranmer, Kernel estimation in high-energy physics, Comput. Phys. Commun. 136 (2001) 198, [hep-ex/0011057]. [72] LHC Higgs Cross-Section Working Group, S. Dittmaier, C. Mariotti, G. Passarino, and R. Tanaka (Eds.), Handbook of LHC Higgs Cross-Sections: 1. Inclusive Observables, CERN-2011-002 (CERN, Geneva, 2011) [arXiv:1101.0593]. [73] LHC Higgs Cross-Section Working Group, S. Dittmaier, C. Mariotti, G. Passarino, and R. Tanaka (Eds.), Handbook of LHC Higgs Cross-Sections: 2. Differential Distributions, CERN-2012-002 (CERN, Geneva, 2012) [arXiv:1201.3084]. [74] S. Biswas, E. Gabrielli, and B. Mele, Single top and Higgs associated production as a probe of the Htt coupling sign at the LHC, JHEP 1301 (2013) 088, [arXiv:1211.0499]. [75] M. Farina, C. Grojean, F. Maltoni, E. Salvioni, and A. Thamm, Lifting degeneracies in Higgs couplings using single top production in association with a Higgs boson, JHEP 1305 (2013) 022, [arXiv:1211.3736]. [76] K. Hamilton, P. Nason, and G. Zanderighi, MINLO: Multi-Scale Improved NLO, JHEP 1210 (2012) 155, [arXiv:1206.3572]. [77] ATLAS Collaboration, Pile-up subtraction and suppression for jets in ATLAS, ATLAS-CONF-2013-083. http://cds.cern.ch/record/1570994. [78] ATLAS Collaboration, Monte Carlo generator comparisons to ATLAS measurements constraining QCD radiation in top anti-top final states, ATL-PHYS-PUB-2013-005. http://cds.cern.ch/record/1532067. [79] A. L. Read, Presentation of search results: The CLs technique, J. Phys. G28 (2002) 2693.. – 22 –.
(25) The ATLAS Collaboration G. Aad84 , B. Abbott112 , J. Abdallah152 , S. Abdel Khalek116 , O. Abdinov11 , R. Aben106 , B. Abi113 , M. Abolins89 , O.S. AbouZeid159 , H. Abramowicz154 , H. Abreu137 , R. Abreu30 , Y. Abulaiti147a,147b , B.S. Acharya165a,165b ,a , L. Adamczyk38a , D.L. Adams25 , J. Adelman177 , S. Adomeit99 , T. Adye130 , T. Agatonovic-Jovin13a , J.A. Aguilar-Saavedra125f,125a , M. Agustoni17 , S.P. Ahlen22 , A. Ahmad149 , F. Ahmadov64,b , G. Aielli134a,134b , T.P.A. Åkesson80 , G. Akimoto156 , A.V. Akimov95 , G.L. Alberghi20a,20b , J. Albert170 , S. Albrand55 , M.J. Alconada Verzini70 , M. Aleksa30 , I.N. Aleksandrov64 , C. Alexa26a , G. Alexander154 , G. Alexandre49 , T. Alexopoulos10 , M. Alhroob165a,165c , G. Alimonti90a , L. Alio84 , J. Alison31 , B.M.M. Allbrooke18 , L.J. Allison71 , P.P. Allport73 , S.E. Allwood-Spiers53 , J. Almond83 , A. Aloisio103a,103b , A. Alonso36 , F. Alonso70 , C. Alpigiani75 , A. Altheimer35 , B. Alvarez Gonzalez89 , M.G. Alviggi103a,103b , K. Amako65 , Y. Amaral Coutinho24a , C. Amelung23 , D. Amidei88 , S.P. Amor Dos Santos125a,125c , A. Amorim125a,125b , S. Amoroso48 , N. Amram154 , G. Amundsen23 , C. Anastopoulos140 , L.S. Ancu49 , N. Andari30 , T. Andeen35 , C.F. Anders58b , G. Anders30 , K.J. Anderson31 , A. Andreazza90a,90b , V. Andrei58a , X.S. Anduaga70 , S. Angelidakis9 , I. Angelozzi106 , P. Anger44 , A. Angerami35 , F. Anghinolfi30 , A.V. Anisenkov108 , N. Anjos125a , A. Annovi47 , A. Antonaki9 , M. Antonelli47 , A. Antonov97 , J. Antos145b , F. Anulli133a , M. Aoki65 , L. Aperio Bella18 , R. Apolle119,c , G. Arabidze89 , I. Aracena144 , Y. Arai65 , J.P. Araque125a , A.T.H. Arce45 , J-F. Arguin94 , S. Argyropoulos42 , M. Arik19a , A.J. Armbruster30 , O. Arnaez82 , V. Arnal81 , H. Arnold48 , O. Arslan21 , A. Artamonov96 , G. Artoni23 , S. Asai156 , N. Asbah94 , A. Ashkenazi154 , B. Åsman147a,147b , L. Asquith6 , K. Assamagan25 , R. Astalos145a , M. Atkinson166 , N.B. Atlay142 , B. Auerbach6 , K. Augsten127 , M. Aurousseau146b , G. Avolio30 , G. Azuelos94,d , Y. Azuma156 , M.A. Baak30 , C. Bacci135a,135b , H. Bachacou137 , K. Bachas155 , M. Backes30 , M. Backhaus30 , J. Backus Mayes144 , E. Badescu26a , P. Bagiacchi133a,133b , P. Bagnaia133a,133b , Y. Bai33a , T. Bain35 , J.T. Baines130 , O.K. Baker177 , S. Baker77 , P. Balek128 , F. Balli137 , E. Banas39 , Sw. Banerjee174 , D. Banfi30 , A. Bangert151 , A.A.E. Bannoura176 , V. Bansal170 , H.S. Bansil18 , L. Barak173 , S.P. Baranov95 , E.L. Barberio87 , D. Barberis50a,50b , M. Barbero84 , T. Barillari100 , M. Barisonzi176 , T. Barklow144 , N. Barlow28 , B.M. Barnett130 , R.M. Barnett15 , Z. Barnovska5 , A. Baroncelli135a , G. Barone49 , A.J. Barr119 , F. Barreiro81 , J. Barreiro Guimarães da Costa57 , R. Bartoldus144 , A.E. Barton71 , P. Bartos145a , V. Bartsch150 , A. Bassalat116 , A. Basye166 , R.L. Bates53 , L. Batkova145a , J.R. Batley28 , M. Battistin30 , F. Bauer137 , H.S. Bawa144 ,e , T. Beau79 , P.H. Beauchemin162 , R. Beccherle123a,123b , P. Bechtle21 , H.P. Beck17 , K. Becker176 , S. Becker99 , M. Beckingham139 , C. Becot116 , A.J. Beddall19c , A. Beddall19c , S. Bedikian177 , V.A. Bednyakov64 , C.P. Bee149 , L.J. Beemster106 , T.A. Beermann176 , M. Begel25 , K. Behr119 , C. Belanger-Champagne86 , P.J. Bell49 , W.H. Bell49 , G. Bella154 , L. Bellagamba20a , A. Bellerive29 , M. Bellomo85 , A. Belloni57 , O.L. Beloborodova108,f , K. Belotskiy97 , O. Beltramello30 , O. Benary154 , D. Benchekroun136a , K. Bendtz147a,147b , N. Benekos166 , Y. Benhammou154 , E. Benhar Noccioli49 , J.A. Benitez Garcia160b ,. – 23 –.
(26) D.P. Benjamin45 , J.R. Bensinger23 , K. Benslama131 , S. Bentvelsen106 , D. Berge106 , E. Bergeaas Kuutmann16 , N. Berger5 , F. Berghaus170 , E. Berglund106 , J. Beringer15 , C. Bernard22 , P. Bernat77 , C. Bernius78 , F.U. Bernlochner170 , T. Berry76 , P. Berta128 , C. Bertella84 , F. Bertolucci123a,123b , M.I. Besana90a , G.J. Besjes105 , O. Bessidskaia147a,147b , N. Besson137 , C. Betancourt48 , S. Bethke100 , W. Bhimji46 , R.M. Bianchi124 , L. Bianchini23 , M. Bianco30 , O. Biebel99 , S.P. Bieniek77 , K. Bierwagen54 , J. Biesiada15 , M. Biglietti135a , J. Bilbao De Mendizabal49 , H. Bilokon47 , M. Bindi54 , S. Binet116 , A. Bingul19c , C. Bini133a,133b , C.W. Black151 , J.E. Black144 , K.M. Black22 , D. Blackburn139 , R.E. Blair6 , J.-B. Blanchard137 , T. Blazek145a , I. Bloch42 , C. Blocker23 , W. Blum82,∗ , U. Blumenschein54 , G.J. Bobbink106 , V.S. Bobrovnikov108 , S.S. Bocchetta80 , A. Bocci45 , C.R. Boddy119 , M. Boehler48 , J. Boek176 , T.T. Boek176 , J.A. Bogaerts30 , A.G. Bogdanchikov108 , A. Bogouch91,∗ , C. Bohm147a , J. Bohm126 , V. Boisvert76 , T. Bold38a , V. Boldea26a , A.S. Boldyrev98 , M. Bomben79 , M. Bona75 , M. Boonekamp137 , A. Borisov129 , G. Borissov71 , M. Borri83 , S. Borroni42 , J. Bortfeldt99 , V. Bortolotto135a,135b , K. Bos106 , D. Boscherini20a , M. Bosman12 , H. Boterenbrood106 , J. Boudreau124 , J. Bouffard2 , E.V. Bouhova-Thacker71 , D. Boumediene34 , C. Bourdarios116 , N. Bousson113 , S. Boutouil136d , A. Boveia31 , J. Boyd30 , I.R. Boyko64 , I. Bozovic-Jelisavcic13b , J. Bracinik18 , P. Branchini135a , A. Brandt8 , G. Brandt15 , O. Brandt58a , U. Bratzler157 , B. Brau85 , J.E. Brau115 , H.M. Braun176,∗ , S.F. Brazzale165a,165c , B. Brelier159 , K. Brendlinger121 , A.J. Brennan87 , R. Brenner167 , S. Bressler173 , K. Bristow146c , T.M. Bristow46 , D. Britton53 , F.M. Brochu28 , I. Brock21 , R. Brock89 , C. Bromberg89 , J. Bronner100 , G. Brooijmans35 , T. Brooks76 , W.K. Brooks32b , J. Brosamer15 , E. Brost115 , G. Brown83 , J. Brown55 , P.A. Bruckman de Renstrom39 , D. Bruncko145b , R. Bruneliere48 , S. Brunet60 , A. Bruni20a , G. Bruni20a , M. Bruschi20a , L. Bryngemark80 , T. Buanes14 , Q. Buat143 , F. Bucci49 , P. Buchholz142 , R.M. Buckingham119 , A.G. Buckley53 , S.I. Buda26a , I.A. Budagov64 , F. Buehrer48 , L. Bugge118 , M.K. Bugge118 , O. Bulekov97 , A.C. Bundock73 , H. Burckhart30 , S. Burdin73 , B. Burghgrave107 , S. Burke130 , I. Burmeister43 , E. Busato34 , D. Büscher48 , V. Büscher82 , P. Bussey53 , C.P. Buszello167 , B. Butler57 , J.M. Butler22 , A.I. Butt3 , C.M. Buttar53 , J.M. Butterworth77 , P. Butti106 , W. Buttinger28 , A. Buzatu53 , M. Byszewski10 , S. Cabrera Urbán168 , D. Caforio20a,20b , O. Cakir4a , P. Calafiura15 , A. Calandri137 , G. Calderini79 , P. Calfayan99 , R. Calkins107 , L.P. Caloba24a , D. Calvet34 , S. Calvet34 , R. Camacho Toro49 , S. Camarda42 , D. Cameron118 , L.M. Caminada15 , R. Caminal Armadans12 , S. Campana30 , M. Campanelli77 , A. Campoverde149 , V. Canale103a,103b , A. Canepa160a , M. Cano Bret75 , J. Cantero81 , R. Cantrill76 , T. Cao40 , M.D.M. Capeans Garrido30 , I. Caprini26a , M. Caprini26a , M. Capua37a,37b , R. Caputo82 , R. Cardarelli134a , T. Carli30 , G. Carlino103a , L. Carminati90a,90b , S. Caron105 , E. Carquin32a , G.D. Carrillo-Montoya146c , A.A. Carter75 , J.R. Carter28 , J. Carvalho125a,125c , D. Casadei77 , M.P. Casado12 , E. Castaneda-Miranda146b , A. Castelli106 , V. Castillo Gimenez168 , N.F. Castro125a , P. Catastini57 , A. Catinaccio30 , J.R. Catmore118 , A. Cattai30 , G. Cattani134a,134b , S. Caughron89 , V. Cavaliere166 , D. Cavalli90a , M. Cavalli-Sforza12 , V. Cavasinni123a,123b , F. Ceradini135a,135b , B. Cerio45 , K. Cerny128 ,. – 24 –.
Figure
+6
Documento similar
78 Department of Physics and Astronomy, University College London, London, United Kingdom. 79 Louisiana Tech University, Ruston
Also at Institut für Experimentalphysik, Universität Hamburg, Hamburg, Germany Also at Manhattan College, New York NY, United States of America t Also at CPPM,
Petersburg, Russia k Also at Department of Financial and Management Engineering, University of the Aegean, Chios, Greece l Also at Louisiana Tech University, Ruston, LA, USA m Also
Petersburg, Russia Also at Chinese University of Hong Kong, China Also at Department of Financial and Management Engineering, University of the Aegean, Chios, Greece Also at
Petersburg, Russia Also at Chinese University of Hong Kong, China Also at Department of Financial and Management Engineering, University of the Aegean, Chios, Greece Also at
Petersburg, Russia Also at Chinese University of Hong Kong, China Also at Department of Financial and Management Engineering, University of the Aegean, Chios, Greece Also at
Petersburg, Russia l Also at Department of Financial and Management Engineering, University of the Aegean, Chios, Greece m Also at Louisiana Tech University, Ruston LA, United States
Fermi, Università di Pisa, Pisa, Italy 125 Department of Physics and Astronomy, University of Pittsburgh, Pittsburgh, PA, United States of America 126a Laboratorio de Instrumentacao
