in Figures
2015
Disclaimer
The Interna onal Stainless Steel Forum believes that the informa on presented is technically correct. However, ISSF does not represent or warrant the accuracy of the informa on contained in this document or its suitability for any general or specifi c use.
The material contained herein is by necessity general in nature; it should not be used or relied upon for any specifi c or general applica on without fi rst obtaining competent advice. ISSF, its members, staff and consultants specifi cally disclaim any and all liability or responsibility of any kind for loss, damage, or injury resul ng from the use of the informa on contained in this brochure.
©2015, Interna onal Stainless Steel Forum (ISSF)
Secretary-General’s Message ... 5
SecƟ on 1: History and CompeƟ Ɵ on
Compound annual growth rate of world stainless melt shop produc on ... 6Regional share of stainless steel produc on (2005 versus 2014) ... 6
Stainless steel versus plas cs - produc on evolu on (1980 - 2013) ... 7
Compound annual growth rate of major metals (1980 - 2014) ... 7
SecƟ on 2: Actual Performance
Stainless melt shop produc on (2008 - 2014) ... 8Stainless melt shop produc on by quarter (2013 and 2014) ... 9
Stainless steel foreign trade (2013 and 2014) ... 10
Foreign trade exports of stainless steel (2013 and 2014) ... 11
Foreign trade exports of stainless steel scrap (2013 and 2014) ... 12
Apparent stainless steel use by region (2002 - 2014) ... 13
Stainless melt shop produc on by region (2003 - 2014) ... 13
Stainless melt shop produc on by grade category (2003 - 2014) ... 14
Global stainless melt shop produc on by quarter (2003 - 2014) ... 14
SecƟ on 3: PotenƟ al
Demand versus real stainless steel use - Europe (Q1 2004 - Q4 2014) ...15Demand versus real stainless steel use - Americas (Q1 2004 - Q4 2014) ...15
Demand versus real stainless steel use - Asia, excluding China (Q1 2004 - Q4 2014) ....16
Demand versus real stainless steel use - China (Q1 2004 - Q4 2014) ...16
Demand versus real stainless steel use - World (Q1 2004 - Q4 2014) ...17
Per-capita direct and indirect use of stainless steel (2000, 2005, 2010) ... 17
Per-capita direct and indirect use of stainless steel (2005 and 2010) ... 18
GDP PPP per capita versus stainless steel use per capita (2010 and 2014) ... 19
Comparison of direct versus total stainless steel use (2005 and 2010) ... 20
Stainless steel use by sector (2013) ... 21
SecƟ on 4: Raw Materials Chrome
World chrome ore resources and reserves ... 22World chrome ore resources by country ... 22
Table of Contents
SecƟ on 4: Raw Materials (conƟ nued) Chrome (conƟ nued)
Chrome uses ... 22
Chrome ore produc on by grade - 2014 ... 23
Ferrochrome produc on by type - 2014 ... 23
Ferrochrome applica ons - 2014 ... 23
Chrome ore produc on by region - 1987 and 2013 ... 24
Chrome ore produc on by region ... 24
Ferrochrome produc on by country - 1987 and 2013 ... 25
Ferrochrome produc on by region ... 25
Ferrochrome produc on by number of producing countries ... 26
Share of ferrochrome produc on ... 26
Interna onal HC FeCr spot prices ... 26
Nickel
Nickel resources and reserves - 2014... 27Nickel mine produc on by region ... 28
Primary nickel produc on by region ... 28
Nickel usage by region ... 29
World primary nickel balance ... 29
End of month stocks and average prices (2007 - April 2015) ... 30
Primary nickel capacity by country - 2013 ... 30
Primary nickel, new commi ed developments - 2013 ... 30
Molybdenum
Molybdenum produc on by region - 2014 ... 31Molybdenum use by region - 2014 ... 31
Molybdenum produc on and use - 2010-2014 ... 31
First use (excluding recycled Mo in scrap) - 2014 ... 32
New molybdenum versus Mo in scrap - 2013 ... 32
Recycled molybdenum content in stainless steel - 2013 ... 32
Molybdenum end use structure ... 32
Molybdenum in stainless steel (tonnes Mo content) by end use ... 33
Molybdenum-grade stainless steel by end use (tonnes stainless steel) ... 33
Dear Members
This is the fourth edi on of Stainless Steel in Figures, which has proved to be a popular
‘ready reference’ for our members.
We have broadened the scope of the informa on which is provided this year.
For the fi rst we introduce sta s cal data from the raw material associa ons who are members of the Team Stainless network.
We hope that this will provide a more useful informa on source for our readers.
We record our apprecia on to our partners in the Team Stainless network for their
willingness and help in providing data. An analysis of the sta s cal data for stainless steel can be signifi cantly improved by a parallel analysis of the data for the essen al raw materials which give steel its stainless proper es. We are therefore very grateful to the Interna onal Chrome Development Associa on (ICDA), the Interna onal Nickel Study Group (INSG) and the Interna onal Molybdenum Associa on (IMOA) who have kindly agreed that there is relevance for this innova ve joint work for the benefi t of their own members as well as the members of ISSF. Stainless steel is a signifi cant market for the producers of chromium (96% for metallurgical grade), nickel (65% of produc on) and molybdenum.
The informa on which has been provided about the raw materials is strictly
confi den al and is for the use of ISSF members and the members of the contribu ng associa ons only. That informa on should please not be re-published without the express permission of the associa ons.
The stainless steel data belongs to the ISSF and our members are welcome to use it as they wish.
If any of you have any comments or sugges ons on how this booklet may be improved for future edi ons, please let me know.
John Rowe Secretary-General,
Interna onal Stainless Steel Forum (ISSF) Brussels, May 2015
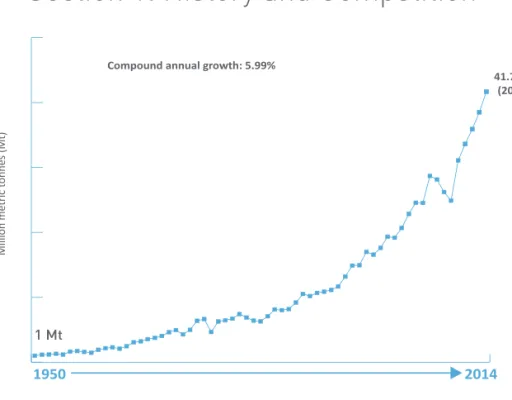
1 Mt
41.7 Mt (2014)
1950 2014
Compound annual growth: 5.99%
Million metric tonnes (Mt)
34%
11%
13%
39%
3%
China Other Asia
(excluding China)
17%
7%
52%
22%
1%
EU-27 Americas Rest of world
Section 1: History and Competition
Figure 1: Compound annual growth rate of world stainless melt shop producƟ on (slab/ingot equivalent): 1950 – 2014 (in Mt)
Figure 2: Regional share of stainless steel producƟ on: 2005 (leŌ ) and 2014 (right)
50 100 150 200 250 300 350 400
Stainless steel
WůĂƐƟĐƐ
Index: 1990 = 100
38.5 Mt (2013)
1980 2013
6.9 Mt
Lead
Carbon steel
Stainless steel Aluminium
Zinc Copper
2.16%
2.35%
2.80%
3.71%
5.44%
2.46%
Average: 2.54%
Figure 3: Stainless steel producƟ on versus plasƟ cs producƟ on: 1980 – 2013. The producƟ on evoluƟ on of both is similar, though stainless steel is more volaƟ le.
Figure 4: Compound annual growth rate of major metals (%/year): 1980 - 2014
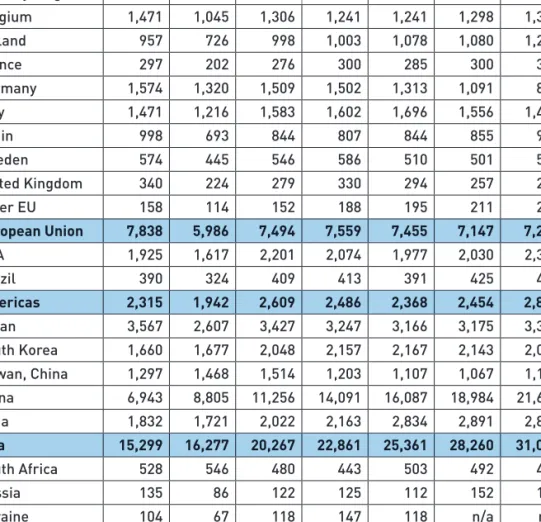
Country/Region 2008 2009 2010 2011 2012 2013 2014
Belgium 1,471 1,045 1,306 1,241 1,241 1,298 1,388
Finland 957 726 998 1,003 1,078 1,080 1,216
France 297 202 276 300 285 300 323
Germany 1,574 1,320 1,509 1,502 1,313 1,091 864
Italy 1,471 1,216 1,583 1,602 1,696 1,556 1,457
Spain 998 693 844 807 844 855 945
Sweden 574 445 546 586 510 501 541
United Kingdom 340 224 279 330 294 257 295
Other EU 158 114 152 188 195 211 223
European Union 7,838 5,986 7,494 7,559 7,455 7,147 7,252
USA 1,925 1,617 2,201 2,074 1,977 2,030 2,389
Brazil 390 324 409 413 391 425 424
Americas 2,315 1,942 2,609 2,486 2,368 2,454 2,813
Japan 3,567 2,607 3,427 3,247 3,166 3,175 3,328
South Korea 1,660 1,677 2,048 2,157 2,167 2,143 2,038 Taiwan, China 1,297 1,468 1,514 1,203 1,107 1,067 1,108 China 6,943 8,805 11,256 14,091 16,087 18,984 21,692
India 1,832 1,721 2,022 2,163 2,834 2,891 2,858
Asia 15,299 16,277 20,267 22,861 25,361 28,260 31,025
South Africa 528 546 480 443 503 492 472
Russia 135 86 122 125 112 152 123
Ukraine 104 67 118 147 118 n/a n/a
World 26,218 24,904 31,090 33,621 35,917 38,130 41,686
Section 2: Actual Performance
Table 1: Stainless melt shop producƟ on (ingot/slab equivalent) in 1,000 metric tonnes: 2008 – 2014.
Note: A major correc on of Chinese data in 2011 means data from 2011 onwards is not comparable with earlier years.
Western Europe/ Africa Central & Eastern Europe
The Amer
icas Asia (excluding China) China World
Quarter 1
2013 2,157 67 598 2,298 4,575 9,696
2014 2,164 71 670 2,371 5,084 10,359
% change 0.3 5.5 11.9 3.2 11.1 6.8
Quarter 2
2013 1,951 84 596 2,253 4,584 9,468
2014 2,116 72 717 2,387 5,603 10,894
% change 8.5 -14.2 20.1 5.9 22.2 15.1
First half
2013 4,108 151 1,195 4,551 9,159 19,164
2014 4,280 143 1,386 4,757 10,687 21,253
% change 4.2 -5.4 16.0 4.5 16.7 10.9
Quarter 3
2013 1,576 64 629 2,284 5,016 9,569
2014 1,682 70 711 2,374 5,336 10,173
% change 6.8 9.4 12.9 3.9 6.4 6.3
Quarter 4
2013 1,813 80 630 2,441 4,809 9,773
2014 1,608 64 716 2,202 5,670 10,259
% change -11.3 -20.6 13.7 -9.8 17.9 5.0
Second half
2013 3,388 145 1,260 4,725 9,825 19,342
2014 3,290 134 1,427 4,576 11,005 20,432
% change -2.9 -7.3 13.3 -3.2 12.0 5.6
Full year 2013 7,496 296 2,454 9,279 18,984 38,506
2014 7,570 277 2,813 9,333 21,692 41,686
% change 1.0 -6.3 14.6 0.6 14.3 8.3
Table 2: Stainless melt shop producƟ on (slab/ingot equivalent) by quarter in 1,000 metric tonnes: 2013 compared to 2014
Cold flat
47.3% Hot coils
25.9%
Cold bars/wire 7.3%
Semis flat 1.4%
Hot bars/wire rod 8.5%
Semis long 2.6%
Hot plate and sheet 7.0%
Cold flat 47.7%
Hot coils 27.0%
Cold bars/wire 7.2%
Semis flat 1.1%
Hot bars/wire rod 8.2%
Semis long 2.1%
Hot plate and sheet 6.7%
Figure 5a: Stainless steel foreign trade in 2013
Figure 5b: Stainless steel foreign trade in 2014
Section 2: Actual Performance
DesƟ naƟ on
Africa Asia Eastern Europe LaƟ n America Middle East NAFTA Australia /Oceania Western Europe Total
Africa 10.6 98.3 13.1 42.7 17.3 26.5 1.1 86.0 295.7
Asia 85.5 4,683.3 117.1 156.9 187.6 331.1 75.7 1,242.9 6,880.2
Eastern
Europe 0.0 1.2 24.0 0.0 0.0 3.6 0.0 25.3 54.2
La n America 1.7 13.7 0.1 48.9 1.4 12.9 0.1 8.9 87.8
Middle East* 0.0 3.5 0.0 0.0 n/a 3.6 0.4 2.3 9.8
NAFTA 1.0 66.4 0.1 61.5 2.9 489.2 1.1 142.6 764.7
Australia/
Oceania 0.0 1.1 0.0 0.0 0.0 0.4 0.6 0.0 2.1
Western
Europe 75.2 496.2 122.6 67.3 59.5 612.4 26.6 6107.1 7,566.8
Total 174.0 5,363.8 277.0 377.4 268.7 1,479.7 105.5 7,615.2 15,661.3
DesƟ naƟ on
Africa Asia Eastern Europe LaƟ n America Middle East NAFTA Australia /Oceania Western Europe Total
Africa 14.0 94.8 16.6 48.6 11.9 35.9 1.6 90.1 313.4
Asia 93.3 5,356.7 147.4 176.6 199.4 495.7 75.7 1,637.3 8,182.0
Eastern
Europe 0.0 4.7 28.6 0.0 0.0 4.3 0.0 14.0 51.6
La n America 2.6 11.8 0.3 34.9 3.0 13.7 0.1 6.5 72.8
Middle East* 0.0 4.7 0.0 0.0 n/a 3.6 0.4 1.4 10.1
NAFTA 0.5 59.2 0.1 48.1 1.9 663.5 0.8 147.9 922.2
Australia/
Oceania 0.1 1.3 0.0 0.0 0.0 0.5 1.0 0.2 3.1
Western
Europe 65.8 505.6 97.6 59.1 70.2 487.9 19.7 6,680.0 7,985.9
Total 176.3 6,038.7 290.6 367.3 286.4 1,705.2 99.3 8,577.3 17,541.1
Table 3b: Foreign trade exports of stainless steel in 2014 (1,000 metric tonnes).
Includes feedstock material for further processing.
Table 3a: Foreign trade exports of stainless steel in 2013 (1,000 metric tonnes).
Includes feedstock material for further processing.
Note: *Indicates imports from that region.
DesƟ naƟ on
Africa Asia Eastern Europe LaƟ n America Middle East NAFTA Australia /Oceania Western Europe Total
Africa 0.1 20.9 0.0 0.0 0.1 0.0 0.0 5.0 26.0
Asia 0.2 552.8 0.0 0.0 0.2 0.2 0.0 24.3 577.8
Eastern
Europe 0.0 5.3 0.5 1.6 0.1 0.0 0.0 59.1 66.5
La n America 0.0 7.2 0.0 0.0 0.0 0.2 0.0 41.0 48.5
Middle East* 0.0 75.5 0.0 0.0 n/a 0.0 0.0 14.3 89.8
NAFTA 0.5 628.4 0.1 1.8 0.7 192.9 0.0 47.3 871.6
Australia/
Oceania 0.0 39.3 0.0 0.0 0.0 0.0 0.1 1.7 41.1
Western
Europe 1.0 376.8 1.1 0.0 1.3 0.9 0.0 2,656.7 3,037.8
Total 1.8 1,706.1 1.7 3.4 2.3 194.3 0.2 2,849.4 4,759.1
DesƟ naƟ on
Africa Asia Eastern Europe LaƟ n America Middle East NAFTA Australia /Oceania Western Europe Total
Africa 0.0 29.6 0.0 0.0 0.9 0.0 0.2 2.8 33.4
Asia 0.0 561.2 0.0 0.1 0.2 1.9 0.0 21.6 585.0
Eastern
Europe 0.0 4.8 3.3 2.3 0.0 0.0 0.0 109.2 119.6
La n America 0.0 18.5 0.0 0.0 0.0 14.8 0.0 33.3 66.6
Middle East* 0.0 96.3 0.0 0.0 n/a 0.5 0.0 16.5 113.3
NAFTA 0.1 573.9 0.0 1.4 1.1 278.7 0.0 24.1 879.3
Australia/
Oceania 0.0 50.9 0.0 0.0 0.5 0.2 0.4 1.1 53.0
Western
Europe 0.1 382.4 2.9 0.0 1.3 32.4 0.1 3,080.1 3,499.4
Total 0.3 1,717.6 6.2 3.8 3.8 328.5 0.8 3,288.6 5,349.7
Note: *Indicates imports from that region.
Table 4b: Foreign trade exports of stainless steel scrap in 2014 (1,000 metric tonnes).
Table 4a: Foreign trade exports of stainless steel scrap in 2013 (1,000 metric tonnes).
Section 2: Actual Performance
10%
20%
30%
40%
50%
60%
70%
80%
90%
100%
2002 2003 2004 2005 2006 2007 2008 2009 2010 2011 2012
Western Europe Central/Eastern Europe Americas Asia (excl. China) China Others 2013 2014
5,000 10,000 15,000 20,000 25,000 30,000 35,000 40,000 45,000
2003 2004 2005 2006 2007 2008 2009 2010 2012 2013 Western Europe/Africa Central/Eastern Europe Americas Asia (excl. China) China
28,706
26,218 24,904
31,094
22,840 24,570 24,546
28,146
33,621 35,917
2014 38,506
41,686
2011*
24,904 24 570 24 546
28 706
*Major correc on of Chinese data for 2011, not*oC1e comparable with previous years.cvtea
Figure 6: Apparent stainless steel use by region: 2002 - 2014
Figure 7: Stainless melt shop producƟ on (slab/ingot equivalent) by region: 2003- 2014 (in 1,000 metric tonnes)
10%
20%
30%
40%
50%
60%
70%
80%
90%
100%
2003 2004 2005 2006 2007 20082009 2010 2011* 2012 CrMn grades (200 series)
CrNi grades (300 series) Cr grades (400 series) Other/not known
22.0 23.0 22.8 26.9 25.524.5 28.1 27.927.8
70.6 65.5 64.7 54.3 53.362.3 56.9 57.456.5
6.5 9.4 10.4 17.4 19.8
10.9 12.5 13.613.2
2013
24.853.320.6 24.423.7 23.225.6 53.255.0 50.352.6 21.019.7 25.120.4
Q1 Q2 Q3 Q4
2014 2014
25.254.618.9
29.955.213.4
. . *Major correc on of Chinese data for 2011 and 2012. NotodeN fully comparable with previous years (especially CrMn grades).cswcrrCg) *Major correc on of Chinese data for 2011, not comparable with previous years.
Figure 8: Stainless melt shop producƟ on (slab/ingot equivalent) by grade: 2003-2014
Figure 9: Stainless melt shop producƟ on (slab/ingot equivalent) by quarter:
2003-2014 (in 1,000 metric tonnes)
Section 2: Actual Performance
Where demand exceeds use, subs tu on of stainless steel by other materials may be occurring.
Figure 10: Stainless steel demand versus real stainless steel use - Europe (Q1 2004 to Q4 2014p)
Figure 11: Stainless steel demand versus real stainless steel use - The Americas (Q1 2004 to Q4 2014p)
Real stainless steel use: Portion of apparent stainless steel use which is really used to produce goods containing stainless steel.
Stainless Steel Demand Index:
Aggregated produc on index weighted by main stainless-using industrial sectors, and by market size.
Figure 12: Stainless steel demand versus real stainless steel use - Asia, excluding China (Q1 2004 to Q4 2014p)
Figure 13: Stainless steel demand versus real stainless steel use - China (Q1 2004 to Q4 2014p)
Real stainless steel use: Portion of apparent stainless steel use which is really used to produce goods containing stainless steel.
Section 3: Potential
Figure 14: Stainless steel demand versus real stainless steel use - World (Q1 2004 to Q4 2014p)
Figure 15: Comparison of per-capita direct and indirect use of stainless steel - selected countries - 2000, 2005 and 2010 (kg/capita). Source: IMF, Yale.
Figure 16: Per-capita direct and indirect use of stainless steel (kg/capita) for selected countries - 2005 (top) and 2010 (boƩ om). Source: IMF, Yale.
Section 3: Potential
Figure 17: GDP PPP per capita versus stainless steel use per capita in 2010 (top) and 2014 (boƩ om). Source: IMF, ISSF, Yale.
Figure 18: Comparison of direct stainless steel use (mill products) versus total stainless steel use (plus trade balance of stainless containing goods) in 2005 (top) and 2010 (boƩ om). Source: IMF, Yale, Vale Inco.
Section 3: Potential
Figure 19: Stainless steel use by sector - 2013
Section 4: Raw Materials - Chrome
Figure 20: World chrome ore resources and reserves
Figure 21: World chrome ore resources by country
Figure 22: Chrome uses
South Africa 72.0%
Zimbabwe 12.0%
India 0.9%
Turkey 0.9%
Kazakhstan 5.0%
Finland 1.6%
Russia 0.5% Brazil 0.2%
Others 6.9%
Figure 23: Chrome ore producƟ on by grade - 2014
Figure 24: Ferrochrome producƟ on by type - 2014
Figure 25: Ferrochrome applicaƟ ons - 2014
Metallurgical grade 96%
Refractory grade 0.2%
Chemical grade 2%
Foundry grade 2%
HC FeCr and Ch. Cr.
94%
LC FeCr 4%
MC FeCr 2%
Stainless steel 77%
Engineering and alloy steel
19%
Other steels 4%
Figure 26: Chrome ore producƟ on by region - 1987
Figure 27: Chrome ore producƟ on by region - 2013
Figure 28: Chrome ore producƟ on by region
Eastern Europe 16%
Asia and Australia 12%
Western Europe (including Turkey) 11%
Middle East 4%
Americas 2%
Africa 55%
Eastern Europe 37%
Asia and Australia 8%
Western Europe (including Turkey) 13%
Middle East 1%
Americas 3%
Africa 38%
Section 4: Raw Materials - Chrome
Figure 29: Ferrochrome producƟ on by country - 1987
Figure 30: Ferrochrome producƟ on by country - 2013
Figure 31: Ferrochrome producƟ on by region
Figure 32: Ferrochrome producƟ on by number of producing countries
Figure 33: Share of ferrochrome producƟ on
Figure 34: InternaƟ onal HC FeCr spot prices (January 2013 = 100)
Section 4: Raw Materials - Chrome
Figure 35: Nickel resources and reserves - 2014
Figure 36: Nickel mine producƟ on by region
Figure 37: Primary nickel producƟ on by region
Section 4: Raw Materials - Nickel
Figure 38: Nickel usage by region
Figure 39: World primary nickel balance
Figure 40: End of month stocks and average prices (LME Nickel)
Figure 41: Primary nickel capacity by country - 2013
Figure 42: Primary nickel, new commiƩ ed developments - 2013
Section 4: Raw Materials - Nickel
Figure 43: Molybdenum producƟ on by region - 2014
Figure 44: Molybdenum use by region - 2014
Figure 45: Molybdenum producƟ on and use - 2010-2014
Figure 46: First use (excluding recycled Mo in scrap) - 2014
Figure 47: New molybdenum versus Mo in scrap - 2013
Figure 48: Recycled molybdenum content in stainless steel - 2013
Figure 49: Molybdenum end use structure
Section 4: Raw Materials - Molybdenum
Figure 50: Molybdenum in stainless steel (tonnes Mo content) by end use
Figure 51: Molybdenum-grade stainless steel by end use (tonnes stainless steel)
Unless otherwise indicated, all data in this booklet has been provided by the Interna onal Stainless Steel Forum (ISSF).
Data has also been provided by:
1. Interna onal Chromium Development Associa on (ICDA) 2. Interna onal Molybdenum Associa on (IMOA)
3. Interna onal Monetary Fund (IMF) 4. Interna onal Nickel Study Group (INSG) 5. Vale Inco
6. Yale University: School of Forestry and Environmental Studies (Reck et al.)
Data Sources
For more informa on about the ac vi es of ISSF, or the sta s cs in this booklet, please contact:
Secretary-General, ISSF Rue Colonel Bourg 120 B-1140 Brussels, Belgium T: +32 (0)2 702 89 16 F: +32 (0)2 702 89 12 E: [email protected]
Website
More informa on about the work of ISSF can be found at worldstainless.org.
Extranet
Members can access the worldstainless Extranet at:
h p://extranet.worldstainless.org
Please note: you must have a valid user ID and password to access this site.
For more informa on about the worldstainless Extranet, please contact Jo Claes ([email protected]).