COMPLEMENTARITIES IN THE INNOVATION STRATEGY:
DO INTANGIBLES PLAY A ROLE IN ENHANCING THE IMPACT OF R&D ON FIRM PERFORMANCE?
DOLORES AÑÓN JAIME GÓMEZ PILAR VARGAS
FUNDACIÓN DE LAS CAJAS DE AHORROS DOCUMENTO DE TRABAJO
Nº 696/2012
De conformidad con la base quinta de la convocatoria del Programa de Estímulo a la Investigación, este trabajo ha sido sometido a eva- luación externa anónima de especialistas cualificados a fin de con- trastar su nivel técnico.
ISSN: 1988-8767
La serie DOCUMENTOS DE TRABAJO incluye avances y resultados de investigaciones dentro de los pro- gramas de la Fundación de las Cajas de Ahorros.
Las opiniones son responsabilidad de los autores.
1 COMPLEMENTARITIES IN THE INNOVATION STRATEGY: DO
INTANGIBLES PLAY A ROLE IN ENHANCING THE IMPACT OF R&D ON FIRM PERFORMANCE?
Dolores Añón*
Jaime Gómez**
Pilar Vargas**
Abstract.
The objective of this paper is to assess the role of investments in advertising and human capital as a way to improve and to appropriate the returns to research and development (R&D). We evaluate firm performance focusing on the three intangible resources that the literature has argued as having the greatest strategic importance (technological, marketing resources and human capital) and develop hypotheses linking them with firm value creation. In order to test our hypotheses, we rely on a large sample of Spanish manufacturing firms. Our results show evidence of complementarities between technological and marketing resources, but they are not conclusive in the case of technological and human resources. Interestingly, the results are consistent with the idea that improvements in performance exist when the firms invest in the three assets at the same time.
Keywords: Technology, marketing, human capital, complementarity.
JEL Classification: O32, M1
Corresponding author: Pilar Vargas, Facultad de Ciencias Empresariales,
Universidad de La Rioja, Cigüeña 60 (26004), La Rioja, Spain. Tel: 34 941299572. Fax: 34 941299393. Email: [email protected].
* Universidad de Valencia, Departamento de Estructura Económica (Aplicada II) ERI-CES.
** Universidad de La Rioja, Departamento de Economía y Empresa.
Acknowledgements: We acknowledge financial support from the Spanish
Ministry of Science and Technology and FEDER (project ECO2011-22947) and
Universidad de La Rioja (projects API 11/25 and EGI11/29). We are grateful for
the comments and suggestions provided by Marta Ortiz de Urbina, Sergio
Palomas and participants at the Conferences of the Iberoamerican Academy of
Management and the Academy of Management.
2 1. INTRODUCTION
In the last few years, there has been an upsurge in the study of complementarities in organizations. Following a recent review of Ennen and Richter (2010), 70% of the 108 empirical papers that they identify as dealing with this concept were published between 2002 and 2008. The importance of the idea is high, given its vast applicability to different contexts and the important performance implications that may arise. On the one hand, the study of complementarities has been applied to the study of the adoption of new technologies (Colombo and Mosconi, 1995; Gomez and Vargas, 2009), cooperation with other agents (Belderbos, Carree and Lokshin, 2006), investments in external and internal R&D (Cassiman and Veugelers, 2006) or the interconectness of intangible assets (Carmeli and Tishler, 2004), to provide just a few examples. On the other hand, it is important to underline that the implications of the concept for the study of competitive advantages are large and far-reaching. Given that firm resources are not used in isolation, but tend to be combined (Lippman and Rumelt, 2003), understanding performance differences requires the analysis of the nature of the interconnections among different organizational elements and of the way by which they improve or undermine performance. In this sense, the majority of the studies find evidence of the positive performance implications of complementarities (Ennen and Ritcher, 2010).
In this paper, we focus on the complementarities that surround the
innovation activities of firms. Innovation activities are a key driver of
improvements in firm value creation. However, innovation capabilities tend to be
scarce and firms have to engage in different activities to produce the knowledge
3
needed to obtain product and process innovations. Among the different sources of innovation that a firm may use, R&D investments occupy a preeminent role.
From the seminal work of Griliches (1979), in which R&D investments are introduced in the production function, researchers have been interested in assessing the returns of R&D investments as a key component of a firm innovation strategy.
Apart from R&D investments, to obtain innovations and to appropriate the returns to R&D, firms also need to invest in complementary elements (Teece, 1986). In the words of Teece (1986: 288), these complementary elements are capabilities or assets that have to be utilized in conjunction with the innovation that is commercialised, such as marketing, competitive manufacturing or after- sales support. However, complementarities are not only likely to explain the appropriation of the returns to innovation. They may also be important in the process of production of new products and processes. For example, to produce innovations investments in human capital are also needed.
In this research, we focus on two intangible resources that are likely to
interact with R&D investments in different stages of the process that creates
competitive advantage. First, we consider investments in human capital, which
are likely to play an important role in the production of product and process
innovations. Second, we also analyse the complementarities between R&D and
advertising investments, which are critical for commercialising innovations and
to appropriate the returns that they generate. Overall, we centre our attention on
the three intangible resources that the strategic management literature has
indicated as of the greatest importance: technological resources, reputation
(marketing resources) and human capital (Gomez-Mejía and Balkin, 2002;
4
Surroca, Tribó and Waddock, 2010). For them, markets are incomplete and their value is typically contingent upon the use of other resources (Denrell, Fang and Winter, 2003). Technological resources, reputation and human capital are likely to be protected by some of the isolating mechanisms proposed by the literature (Lippman and Rumelt, 1992). Therefore, selecting them means that we maximize the likelihood of finding complementarity effects in our sample.
Our tests are performed over data on different sectors of the Spanish economy, which facilitates a complete assessment of the sources of performance differences. This is important, provided that a firm environment could hinder its ability to appropriate the rents created by a given asset (Coff, 1999; Newbert, 2007). Given the difficulties to isolate the returns associated to innovation activities, we focus on the impact of R&D investments on firm performance. We adopt a revenue-based productivity approach (Syverson, 2011) in which innovative products and processes can have an impact on the amount of inputs used by the firm and on its output, including improvements in the quality of the potential new products generated through R&D investments.
Importantly, our model considers whether the improvements in productivity are
explained by the interconnections between R&D investments and the ones
incurred in advertising and human capital. This is achieved by applying a test
for super-modularity with discrete choices, following the approach of Mohnen
and Roller (2005). Our findings show that the interconnections between the
different types of intangible resources are key to explain the persistent
productivity differences documented in the literature (see, Syverson, 2011). In
particular, they reveal that marketing resources are critical to leverage the
performance effects of R&D investments.
5
Our contribution to the literatures of strategic management and innovation are, at least, three. First, we explain firm performance differences as a consequence of the interconnection of R&D and other intangible resources, showing the relevance of their interconnections. Second, by matching the characteristics of the resources selected with the ones required by the theory, we want to contribute to the resource-based view of the firm, adding evidence to the marginal support that it has received up to now (Newbert, 2007). Finally, the data also allow us to analyse complementarities in a longitudinal context, which constitutes an improvement over the majority of papers published (Ennen and Richter, 2010).
1The rest of the paper unfolds as follows. First, we focus the discussion on the importance of investments in R&D to firm performance and develop the hypotheses that are tested. Second, the paper describes the methodology, the variables, and the sample used in the analysis of complementarities. Next, the paper presents the results of the estimations. Finally, we discuss some implications that are relevant for the study of complementarities and competitive advantage.
2. RETURNS FROM THE INNOVATION STRATEGY: THE ROLE OF COMPLEMENTARITIES
Our objective in this paper is to assess the conditions under which a firm maximizes the returns from its innovation strategy. In particular, we focus on one of the most important investments that the firm has to incur as part of it:
research and development (R&D) investments. Investments in R&D are a key source of new products and processes and they share some of the
1 Ennen and Richter (2010) point out that only 6 studies out of the 108 in which they focus their attention take a truly dynamic perspective.
6
characteristics that are critical for securing a firm’s competitive advantage. First of all, they are subject to time compression diseconomies (Dierickx and Cool, 1989). Time compression diseconomies emerge whenever the time to develop a given asset cannot be reduced without incurring in additional investments that increase the costs of production of innovations and erode the potential to obtain competitive advantages. Therefore, the existence of time compression diseconomies in R&D creates disadvantages in rivals.
A second reason why R&D investments are difficult to replicate is that they may be subject to asset mass efficiencies, that is, their acquisition is reinforced by the previous possession of a higher stock of them. For instance, given that knowledge is accumulated as employees relate what they know to the new information available, those firms that possess a higher stock of research and development have a higher absorptive capacity (Cohen and Levinthal, 1990) that may be used not only to assimilate, but also to exploit, external and internal flows of knowledge. Finally, the last reason why R&D investments are more difficult to imitate is that they are subject to causal ambiguity. Causal ambiguity occurs whenever the link between competitive advantage and the resource base of the firm remains unidentified (Lippman and Rumelt, 1982). Contrary to tangible resources, intangible assets are invisible to potential imitation, which makes replication by the competitor considerably more difficult.
Several researchers have attempted to link R&D investments and performance. A number of papers support the existence of a positive relationship between them. For example, Griliches and Mairesse (1984) and Cuneo and Mairesse (1984) conducted a parallel study in two different contexts:
the USA and France. Both tried to evaluate the contribution of the stock of
7
technological intangible assets to firm productivity, obtaining positive and significant results. Similarly, other authors have found a consistent and positive share-price reaction to announcements of increased R&D expenditure (Hirchey, 1985; Jose, Nichols and Stevens, 1986; Woolridge, 1988; Woolridge and Snow, 1990 and Szewzyk and Tsetsekos, 1996). In this sense, Chan, Martin and Kesinger (1990) show that firms in research-intensive sectors obtain a significantly above-average return, with outcomes not being identical in companies that operate in non-intensive sectors. The relationship between market value and R&D expenditures has frequently been studied by regressing Tobin’s q ratio on R&D measurements. The findings point out that there is a significant correlation between both variables (Griliches, 1981; Hirchey and Weygandt, 1985; Hall, 1993; Hall and Oriani, 2006).
Despite this evidence, we have to take into account that investments in
R&D are not an isolated component of a firm’s strategy, but they are used with
complementary assets. The main purpose of these investments is the
production of both product and process innovations that need of other inputs,
such as knowledge, experience or creativity, in order to be obtained. Similarly,
they also need the collaboration of other firm resources and capabilities in order
to be commercially exploited and to be able to appropriate the returns they
generate (Teece, 1986). Below, we elaborate on the role of certain
complementary assets at the time of increasing the returns from R&D
investments.
8 Interconnectedness between R&D resources and other intangible elements
As mentioned above, our objective is to test the presence of complementarities between R&D investments and other resources or capabilities that the firm possesses. The importance of complementarities has been stressed in the literatures of management and economics. Milgrom and Roberts (1995:181) explain that complementarities between activities appear whenever “doing more of one thing increases the return to doing (more of) the others”. In other words, the marginal return of a given activity is higher in those cases in which a second activity is also being developed inside the firm.
The study of complementarities is relevant for firms, given their high applicability to different contexts and their consequences on firm performance.
First, there are several situations in which complementarities are expected to be important. Researchers on management have usually focused on the analysis of the interactions between (1) firm resources, (2) practices and policies, (3) structure and processes, (4) strategy and (5) an organization and its environment (Ennen and Richter, 2010). Second some researchers have attempted to identify the impact of complementarities on firm performance.
Generally speaking, the evidence shows that complementarity relationships arise in the majority of the cases analysed. Ennen and Ritcher (2010) show that, out of 108 studies on complementarities, 65 find unequivocal positive performance implications among all the elements considered, while only 7 papers did not obtain any complementarity relations at all.
Our interest is to analyse the performance effects of complementarities in
the context of innovation activities and, particularly, R&D investments. Through
9
R&D firms obtain product and process innovations that are commercialised or applied to production. However, in order to produce innovations and to appropriate their returns R&D investments have to be undertaken in conjunction with other assets. For example, Teece (1986) argues that if a firm has proprietary complementary assets, that firm may obtain a competitive advantage. Therefore, apart from evaluating the returns associated to innovation activities, understanding competitive advantage requires the identification of the types of assets that interact with R&D investments and the nature of their interaction. The amount and characteristics of these complementary resources are a decisive factor in the relationship between innovation and performance, since they will affect the production of innovations, the easiness of imitation and the degree of appropriability of the returns to the innovation (Teece, 1986; Tripsas, 1997).
In order to assess the complementarities surrounding R&D investments we choose two of the variables that are most potentially related to R&D, namely marketing resources and human capital. This selection is justified by two arguments. First, these two resources are very likely to be complementary to the stock of R&D resources. Although the reasons for this are explained below, investments in human capital and marketing interact with R&D investments at different stages of the production and/or the commercialization of innovations.
On the one hand, investments in human capital are key for the production of
process and product innovations. On the other, investments in marketing play a
vital role in the commercialization of innovations, providing a way for
appropriating their returns.
10
Second, even if the evidence showed that these two resources are not complementary to R&D investments, they are likely to be directly related to performance, given their intangible nature. The resource based view of the firm has argued that only those firm resources capable of creating value, being scarce, non-imitable and non-substitutable are candidates to be the source of sustained competitive advantage (Wernerfelt, 1984; Barney, 1991). The intangible resources that a firm possesses are more likely to fulfil all these requirements than their tangible counterparts. Intangible resources, such as knowledge, are frequently invisible or socially complex, and their acquisition is subject to time compression diseconomies or path dependence, what reduces the likelihood of being imitated by rivals (Barney, 1991; Dierickx and Cool, 1989). Additionally, far from being consumed with their use, they are frequently enhanced by it.
The importance of intangible resources has been recognised by the literature in strategic management. Efforts have concentrated on designing taxonomies of intangible resources (Hall, 1993; Fernández, Montes and Vázquez, 2000) and on linking them to competitive advantage (Hall, 1993;
Carmeli and Tishler, 2004). In fact, they are an important part of the empirical tests performed within the resource-based view of the firm. Intangible resources such as “human capital”, “knowledge”, “experience” or “reputation” have been a frequent focus of attention within this line of research (Newbert, 2007).
However, despite the interest of researchers within the resource-based view in
their analysis, the support offered by empirical tests is far from satisfactory. As
Newbert (2007) finds, only 37% of the test attempting to link resources to
performance and/or competitive advantage (some of them involving intangible
11
resources) were supported. Choosing R&D, marketing resources, and human capital to test complementarity, we are also offering a test of the resource based-view of the firm.
3. HYPOTHESES
3.1. R&D and marketing investments
Despite their potential for increasing firm performance, the analysis of the consequences of investments in innovation and marketing has largely evolved separately. The results of R&D investments frequently take the form of product and process innovations, and it is in the production of the former where complementarities are more likely to arise. However, in looking at product innovations, students of marketing have focused on the customer, whereas researchers on technology have centred on know-how. This is disappointing, given that these two strategic resources are intimately connected (Ghemawat, 1991). Thus, it seems necessary to address the impact of both dimensions simultaneously, rather than considering them separately. In fact, recent research has encouraged additional efforts in the analysis of the complementarities between R&D and marketing capabilities (Krasnikov and Jayachandran, 2008).
As argued, the clearest complementarities between R&D and marketing investments arise when one considers the commercialization of product innovations. Investments in advertising serve to provide customers with information of the new products or services that the company commercialises, increasing their awareness of the firm’s offer and their willingness to pay.
Moreover, investments in advertising are likely to provide the firm with
improvements in brand value. As other information assets, brands are unlikely
12
to be consumed by their use and they may be simultaneously utilized for several different products at the same time, generating scope economies and creating firm value. A higher brand value will, in turn, generate further incentives to perform R&D investments that produce new products and services to be offered to customers. Therefore, the expected interaction between R&D and marketing investments should have a positive impact on performance.
Hypothesis 1: investment in marketing and R&D are complementary, so that the impact of R&D investments on firm performance increases when the firm also invests in marketing resources
3.2. R&D and investments in human capital.
The second relevant interaction that we identify in this paper relates R&D and human capital investments. We argue that the benefits from R&D investments are lower if the quality of a firm’s human capital is low. To profit from innovation, firms not only need to build on internal and external knowledge that has to be combined to create new products and processes. They also have to exchange information between different units, including marketing, manufacturing and after sales services. In such a context, firms that have a strong skill-base outperform those that do not.
The positive interaction between innovation and human capital may be
explained using, at least, three arguments. First, education contributes to the
innovation process by increasing a “person’s capacity to think systematically
and creatively about techniques” (Wozniak, 1984: 71). This is an essential skill,
not only for creating new knowledge, but also for finding new combinations of
existing knowledge that could help the firm to develop new products and
13
services. In fact, as Nahapiet and Ghosal (1998) have shown, knowledge is not just an individual attribute, but has a social dimension. Those firms with qualified workforce could also take advantage of knowledge sharing.
Knowledge sharing increases the likelihood of finding new combinations of knowledge that would result in process improvement or new product development (Kogut and Zander, 1992). Organizations that neglect the social side of individual skills and do not create synergies between their human and social capital are unlikely to realize the potential of their employees to enhance organizational innovative capabilities (Subramanian and Youndt, 2005).
Second, education may also be related to the increasing ability of educated workers to effectively integrate new knowledge into the activities of the firm. In this sense, skills are an important component of a firm’s absorptive capacity (Cohen and Levinthal, 1990). “An organisation´s absorptive capacity will depend on the absorptive capacities of its individual members” (Cohen and Levinthal 1990: 131). Therefore, more qualified workers are also more able
“…to recognize the value of new, external information, assimilate it and apply it to commercial ends” (Cohen and Levinthal, 1990:128). As recent research has shown, more qualified employees may serve as boundary spanners (Hess and Rothaermel, 2011), helping the firm to codify tacit knowledge in a way that may be useful for innovation activities.
Finally, more qualified workers are more likely to successfully take charge
of workplace change and innovation (Morrison and Phelps, 1999). They are
also more able to deal with complexity, and job complexity positively interacts
with creativity and innovation (Song, Almeida and Wu, 2003). Therefore, more
qualified workers are able to create more value per unit of investment in R&D.
14
Hypothesis 2: investment in human resources and R&D are complementary, so that the impact of R&D investments on firm performance increases when the firm hires a more qualified human capital
3.3. R&D and investments in marketing and human capital
Hypotheses 1 and 2 maintain that complementarities exist between different combinations of resources. In the case of advertising and R&D, the main reason is the improved knowledge about the innovations developed by the firm, together with the higher willingness to pay motivated by improvements in brand value. In the case of human capital and R&D, we have argued that the higher skills of more educated workers, who increase the absorptive capacity of the firm and are more successful in dealing with complexity and change, improve the production of innovations.
The arguments used to develop Hypotheses 1 and 2 also serve to propose a third hypothesis. In our conceptualization of the returns to innovation activities we have considered that advertising and human capital, together with R&D investments, are the main elements of our model. However, Hypotheses 1 and 2 only consider the potential interactions between pairs of resources (advertising and R&D, on the one hand; human capital and R&D, on the other hand), disregarding the possibility of three way interactions between them.
However, firms are generally viewed as coalitions of resources (Lippman and
Rumelt, 2003) in which the interconnections between the relevant elements
cannot be limited to certain combinations. Therefore, the study of the
complementarities considered in Hypotheses 1 and 2 should be widened
through the analysis of the simultaneous effect of advertising, human capital
and R&D, together with their interactions. Exploring the relationships between
15
the three resources is important to fully understand the sources of performance differences among firms.
Hypothesis 3: investments in advertising and human capital are complementary to investments in R&D, so that the impact of R&D on firm performance increases when the firm simultaneously incurs in higher investments in advertising and hires a more qualified human capital
4. MODEL SPECIFICATION AND ESTIMATION STRATEGY
Our estimation strategy proceeds in two stages. The first stage consists of the estimation of the firm specific total factor productivity (TFP) levels.
Specifically, the first stage estimates the following Cobb-Douglas production function:
y
it= β
0+ β
kk
it+ β
ll
it+ β
mm
it+ ω
it+ e
it(1) where we denote the logarithm of real gross output, physical capital, labor and materials with y
it, k
it, l
it, and m
it, respectively; ω
itis the firm’s productivity, which is assumed to be observable by the firm but not by the analyst; and e
itis a standard error term. Subscripts i and t stand for firm and time period. Labor and materials are assumed to be freely variable inputs. Capital is a fixed factor and is affected only by the distribution of ω
itconditional on information at time t-1 and past values of ω.
To obtain consistent estimates of TFP at the firm level we use a semi- parametric method developed by Olley and Pakes (1996).
2To design the first stage it is important to note that many R&D investments have the introduction of new or improved products as a consequence, potentially increasing firm
2 Details on the construction of TFP using Olley and Pakes (1996) method are provided in Appendix 1.
16
revenue. Therefore, a pure efficiency TFP approach does not seem the most adequate under these circumstances. Instead, we use a revenue based productivity approach (Syverson, 2011). It not only takes into account variations in inputs, but also non-common price variation among the firms that populate an industry.
3This allows a more complete account of the diverse consequences of R&D investments on firm performance.
In the second stage of our strategy we relate TFP levels to a vector of intangible assets and other control variables. We follow the approach of Mohnen and Roller (2005) and apply a test for super-modularity with discrete choices. The test takes the measure of TFP as the departing point as follows:
TFP
it= (2)
where s
iare the different combinations of resources (innovation strategies) chosen by a given firm, β
iare the coefficients accompanying each of the innovation strategies (s
i), ݒ
i,tis a vector of control variables that will be defined below, and e
itis an error term. As noted, at the core of this approach is the construction of a set of dummy variables (s
i) corresponding to the set of all available possible strategies. Our hypotheses suggest the importance of the complementarities between three different types of investments (technological, marketing and human). In order to build a test for complementarities we define the eight different strategies that capture all the possible decisions of the firm.
The set of available strategies is shown in Table 1. The comparison of
3 As a consequence, the results of the first stage cannot be interpreted as mere efficiency improvements/decreases. Additionally, this approach requires a complete account of the factors that can determine the value of a firm output, such as market power (Syverson, 2011), as we do in our estimations.
it it i
i is e
8
1
17
performance under the different situations defined by them will help us to understand the interconnections between these three resources.
Table 1. Set of available strategies for a firm
R&D Marketing Human
capital
No intangible investment (s1) 0 0 0
Only R&D (s2) 1 0 0
R&D along with marketing (s3) 1 1 0 R&D along with human capital (s4) 1 0 1 R&D along with marketing and human capital
(s5) 1 1 1
Only human capital (s6) 0 0 1
Marketing along with human capital (s7) 0 1 1
Only marketing (s8) 0 1 0
R&D, Marketing and Human capital are binary variables.
After estimating model (2) using linear regression, the coefficients associated to each of the strategies (β
i) can be used to test for complementarity between the three intangible assets. This is done following the procedure developed by Kodde and Palm (1986). The procedure considers the null hypothesis that a set of relevant inequalities holds jointly, and it is slightly different depending on the number of resources that are considered complementary. For example, for the pairwise tests of complementarity between R&D and marketing the set of inequality restrictions that must hold are the following:
β2
+ β
8 < β1+ β
3and
β4+ β
7 < β6+β
5Looking at Table 1, we can provide an intuitive interpretation of what this
means. Rearranging terms in the first inequality (β
2-β
1 <β
3- β
8), we can see that
it requires the improvement in performance of investing in R&D when the firm is
18
also investing in marketing resources (β
3-
β8) to be higher than the same performance increase when the firm is not investing in marketing resources (β
2-
β1). The second inequality expresses the same condition for the pair
“investments in R&D-human capital”. Similarly, it is also straightforward to test for substitutability (submodularity) between each pair of strategies. The only difference from the complementarity tests is that the inequalities are reversed.
The test for complementarity (substitutability) can be extended beyond pairwise considerations. In our case, this would allow us to test for the relationship between R&D, marketing and human capital. The test is an extension of the one described above, but now with three-inequality restrictions on the estimated state dummy coefficients (β
i). For example, testing for supermodularity implies considering the following relevant inequalities:
β7
+ β
2 < β1+ β
5and
β4+ β
8 <β
1+ β
5and
β3+ β
6 <β
1+ β
5Therefore, the method not only requires that higher performance improvements are detected when investments in R&D are simultaneous to investments in marketing and human capital than when investments in R&D are incurred in isolation (first inequality). It also requires that the same condition holds for the performance improvements of investments in marketing (second inequality) and human capital (third inequality).
5. SAMPLE AND VARIABLES
We test our hypotheses on a sample of Spanish firms operating in the
manufacturing sector between 1993 and 2005. More precisely, we use the
Survey of Business Strategies. This is an annual survey on the activity of
19
Spanish manufacturing firms and their business strategies, which is financed by the Ministry of Industry, Tourism and Trade and carried out by the SEPI foundation. It covers firms which have 10 or more employees and whose principal economic activity is listed in one of the two digit manufacturing industries of the NACE-Rev.1. One important attribute of the sample is that it is representative of the manufacturing firms operating in the Spanish economy. In the first year in which the Survey was carried out (1990), firms employing between 10 and 200 people were selected by means of a random sampling scheme, while firms with more than 200 were surveyed on a census basis. In subsequent years, those firms that, for any reason (e.g.: acquisition, merger or, simply not willing to participate) dropped out of the original sample are replaced every year by firms with similar characteristics according to the sampling procedure used in the base year. In other words, the dataset reproduces the entry and exit processes that take place in the population. Finally, it is important to highlight these data have been previously used for several purposes. Thus, they have been utilised in the analysis of diversification decisions (Merino and Rodríguez, 1997), of the effect of R&D on productivity (Beneito, 2003), of the introduction of product and process innovations (Martínez Ros, 2000) and the analysis of the adoption of new technologies (Gomez and Vargas, 2009).
5.1. Variable measurement
Variables used in the first stage of the procedure. To estimate the first
stage of our procedure we need variables accounting for the elements of the
Cobb-Douglas production function. In particular, gross output (Y), the stock of
physical (tangible) capital (K), labour (L), and intermediate inputs (M). All the
variables may be constructed from the information contained in the dataset.
20
Gross output is measured as the total volume of sales of firm i in year t.
Following the revenue approach, we calculated the real values by eliminating the industry common price variations, i.e., using industry deflators. This practice is different from the one used by researchers when they attempt to exclusively detect efficiency improvements, given that in this second case, firm specific deflators are used. However, it allows for a more complete account of the consequences of R&D investments.
The stock of physical capital is measured by using the perpetual inventory formula:
t t t t
t I
p K P d
K
1
) 1
1 (
where P is the price index for equipment, d is the depreciation rate, and I is the investment in equipment in year t. Labour is measured as the total number of hours worked by the employees of firm i in year t. Finally, intermediate inputs (materials in model (1)) are calculated as the sum of purchases and external services minus the variation of purchase inventories. As in the case of gross output, the Index of Industrial Prices has deflated all the nominal variables.
Variables used in the second stage. Similarly, to estimate the effect of
intangible resources over total factor productivity we need to build a set of
strategies taking into account if the firm has invested in all, some or none of the
intangible assets. In this sense, and for each of the intangibles resources
considered, we have to build binary variables representing investments in R&D,
commercial and human capital, as explained in Table 1. In order to do this, we
first have to calculate the value of the three types of investments for each firm.
21
We approximate the stock of technological resources by using the perpetual inventory method, which specifies the stock for each year as the sum of the R&D stock, minus the depreciated stock and plus the investment of the previous period. This is calculated in the following way:
1 , 1 ,
,t (1 ) it it
i RDS RD
RDS
where
stands for the rate of annual depreciation, which is assumed to beequal for all the firms, RDS is the stock of firm i up to t-1 and RD stands for the R&D expenditures of firm i in t-1. To estimate the stock of R&D we need an initial value for RDS to start the recursion. The initial stock is calculated as:
g RDSi,0 RDi,0
where g is the average growth rate for the R&D expenditures. Following Griliches (1981) and Griliches, Hall and Pakes (1981) we assume a value of 15% for the depreciation rate () and a value of 5% for the growth rate (g).
Similarly to technological resources, the stock of marketing resources is measured by using the perpetual inventory method. In accordance with Villalonga (2004) the depreciation rate () is assumed to be 45%. In order to use a realistic value for the growth rate, we calculated the mean growth of advertising expenditures in our sample, which is 15%.
Finally, human capital is measured using the educational level of the workforce. We calculated the share of employees with university degree in relation to the total number of employees
4.
4 In the database this information is only available every four years. Therefore, we have used linear interpolation methods to obtain a continuous series.
22
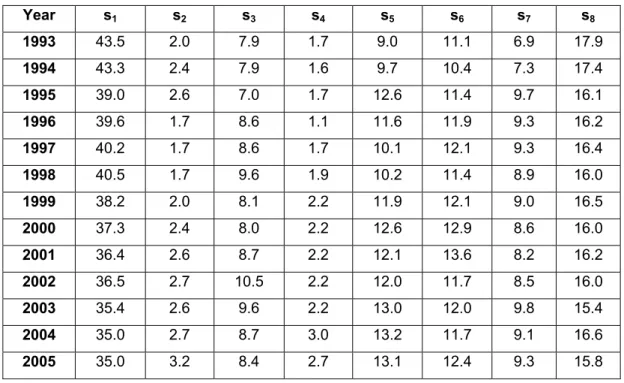
After measuring these resources, the method involves creating a set of indicators capturing whether the firm has invested in R&D and/or in marketing and/or human capital, as shown in Table 1. In other words, the innovation strategy of each firm is characterized by three binary variables pointing out whether the firm has invested in those resources. These binary variables take a value of one if the firm has R&D, marketing stock or human capital higher than the positive median of their industry, and zero otherwise. Table 2 shows the percentage of firms choosing each of the strategies available over time. The most popular strategy is that with R&D, marketing and human capital stocks below the industry average (s[0,0,0]), with over 35% of firms pursuing it.
Nevertheless, its importance decreases over time. On the other hand, the least popular strategies are, either to combine R&D with human capital (s[1,0,1]); or to conduct only R&D (s[1,0,0]), with over 2% of firms following these strategies, respectively.
Table 2. Evolution of firm´s strategies by year
Year s1 s2 s3 s4 s5 s6 s7 s8
1993 43.5 2.0 7.9 1.7 9.0 11.1 6.9 17.9
1994 43.3 2.4 7.9 1.6 9.7 10.4 7.3 17.4
1995 39.0 2.6 7.0 1.7 12.6 11.4 9.7 16.1
1996 39.6 1.7 8.6 1.1 11.6 11.9 9.3 16.2
1997 40.2 1.7 8.6 1.7 10.1 12.1 9.3 16.4
1998 40.5 1.7 9.6 1.9 10.2 11.4 8.9 16.0
1999 38.2 2.0 8.1 2.2 11.9 12.1 9.0 16.5
2000 37.3 2.4 8.0 2.2 12.6 12.9 8.6 16.0
2001 36.4 2.6 8.7 2.2 12.1 13.6 8.2 16.2
2002 36.5 2.7 10.5 2.2 12.0 11.7 8.5 16.0
2003 35.4 2.6 9.6 2.2 13.0 12.0 9.8 15.4
2004 35.0 2.7 8.7 3.0 13.2 11.7 9.1 16.6
2005 35.0 3.2 8.4 2.7 13.1 12.4 9.3 15.8
23
Control variables. We also have included a detailed set of control variables in order to control for other sources that may affect productivity. These control variables are validated by previous research and include: market share, size, ownership, export activity, industry and temporal effects.
Market share is defined as the ratio of firm sales to total sales in the main market in which the firm operates. As we have mentioned before, the use of the revenue based approach makes it especially necessary to introduce this variable in the model in order to control for differences in market power across producers that could affect product prices (Syverson, 2011).
Large firms tend to have higher TFP levels than their smaller counterparts (Lee and Tang, 2001; Rao and Tang, 2000). In order to capture this effect we include a size variable that is measured using the total number of employees.
The number of employees in each period is divided into the following four classes: firms with 20-49 employees, firms with 50-199 employees, firms with 200-499 employees and firms with more than 500 employees.
The assumption that foreign firms have higher productivity has been extensively analyzed in the literature (Doms and Jensen, 1998). Foreign owned firms outperform domestic firms because of superior technological knowledge, access to international networks and management structure. We define ownership as a binary variable indicating whether there is, at least, a 30% stake of foreign capital in the firm.
The relationship of productivity and exporting has been broadly analysed
in previous papers from two different approaches. The first one stresses the fact
that only most productive firms are able to do well abroad because of high sunk
costs associated to selling abroad and of higher competition (Bernard and
24
Jensen, 1999 and Bernard and Wagner, 2001). The second one emphasizes the learning effects associated to exporting, implying that exporting makes firms more productive (Grossman and Helpman, 1991). Export activity is measured as the ratio of export to total firm sales.
Lastly, industry (19 industry dummies to account for the 20 industries identified in the survey) and temporal effects (12 year dummies to account for the observation window considered in the paper) have also been included.
6. RESULTS
Our objective in this paper is to assess the role of complementarities between technological, marketing and human resources at explaining firm performance. As described above, the procedure involves two steps. Firstly, we estimated a Cobb-Douglas production function using the method proposed by Olley and Pakes (1996) and using the 15,863 available observations. The results (not shown) were consistent with our expectations on the role of the physical capital, labor and intermediate outputs on productivity. Secondly, we estimated a model in which total factor productivity was explained by the eight strategies defined above, and by the control variables. Given our interest in complementarities, our comments focus on the results of the application of Kodde and Palm’s (1996) test, which are presented in Table 3.
Table 3 presents the Wald test statistics for the complementarity (null
hypothesis is that both resources are complementary) and substitutability (null
hypothesis is that both resources are substitutes) test of the three resources
and for the full sample. We also perform a three-way test in order to take into
account the possibility that all the resources considered are complementary. In
25
order to interpret the results, it is important to consider that the thresholds to evaluate whether the strategies defined are complementary/substitutes differ depending on the number of inequality restrictions introduced. For the test that only considers two types of resources and a 10% significance level, the lower and upper bound critical values are 1.642 and 3.808 (Kodde and Palm, 1986).
In the case of the three-way test the thresholds are 1.642 and 5.528. For values between the lower and upper thresholds the test is inconclusive. Values below the lower threshold (1.642) indicate that the null hypothesis of complementarity/substitutability is not rejected. Finally, values above the upper threshold (3.808, in the case of the two way test, or 5.528 for the three-way test) mean that the null hypothesis is rejected.
Table 3. Tests of supermodularity and submodularity.
Complementarity test Substitutability test Two-way tests
R&D and marketing 0.000** 2.452i
R&D and human 0.409** 0.458**
Marketing and human 0.011** 1.942i
Three-way test
R&D, human and marketing 0.000** 3.343i
The critical values provided by Kodde and Palm for = 0.10 are 1.642 and 3.808 for two way test and 1.642 and 5.528 for three way test. If the test is below 1.642, the null hypothesis of complementarity (substitutability) is accepted and is the test value is above 3.808 or 5.528, the null hypothesis is rejected. For test values between two critical values the test is inconclusive. **
Null hypothesis is accepted; * null hypothesis is rejected; i the test is inconclusive.
Hypothesis 1 argued that the relationship between R&D and marketing is complementary. The results presented in Table 3 are consistent with the existence of complementarity between both types of resources (=0.000 <
1.642) while the test for substitutability is inconclusive (1.642 > =2.452 <
3.808). Therefore, for this pairing the test suggests complementarity, offering
support for Hypothesis 1. Following our arguments provided before,
investments in marketing increase the returns of R&D by providing customers
26
with information of the new products or services that the company commercializes and by providing improvements in brand value.
Hypothesis 2 posited that the performance of investments in R&D is reinforced by investments in human capital. In this case, the results show an unclear indication of either complementarity or substitutability as both null hypotheses are accepted. First, we cannot reject the null hypothesis of complementarity (=0.409 < 1.642). Second, the substitutability test shows that the null hypothesis of substitutability cannot be rejected either, as the test statistic is also below the lower threshold (=0.458 < 1.642). Therefore, in this case the results cannot be interpreted as offering support to the hypothesis of complementarity between R&D and human capital.
To finish with the analysis of complementarity between all the possible pairs of intangibles and although it is not the subject of our main attention in this paper, the method also tests the relationship between marketing investments and human resources. It is important to note that the complementarity relationship between marketing investments and human resources is also supported by the data. The test leads us not to reject the null hypothesis of complementarity (=0.011 < 1.642) and the substitutability test offers indeterminate results (1.642 > =1.942 < 3.808). Therefore, for this pairing the test suggests complementarity, as it could be expected.
The absence of complementarity between R&D and human resources
shown by the two-way test is surprising, given that the literature has long
argued that investments in these two types of resources should be
complementary when developing the innovation process (see, for example,
Leiponen, 2005). One possibility is that the performance of the innovation
27
process would depend on the appropriability conditions that surround the firm (Teece, 1986). Thus, even if R&D and human capital investments were complementary at the time of obtaining product and process innovations, these complementarities would not be reflected on firm performance unless the firm would be able to appropriate the results of the innovation process. As argued above, marketing investments could serve to that end. If this were the case, the complementarities between all the three types of investments should be revealed through a three way tests, as expected by Hypothesis 3. Table 3 shows such a test for the joint use of R&D, marketing and human resources.
The test cannot reject the null hypothesis of complementarity between R&D, marketing and human capital (=0.000 < 1.642), whereas its application to the analysis of substitutability shows indeterminate results (1.642 > =3.343 <
5.528).
In summary, our results provide evidence of complementarities between R&D and marketing investments (Hypothesis 1). In the case of R&D and human capital (Hypothesis 2), the evidence is only consistent with our expectations when marketing investments are also incurred. Jointly, these results offer support for Teece’s (1986) theory of complementary assets, given that the firm only increases the returns to the innovation process when the appropriability conditions are good.
7. DISCUSSION AND CONCLUSIONS
Our purpose in this paper has been to test whether the returns to R&D are
improved by the simultaneous use of certain complementary resources. In
particular, our attention has focused on two intangible assets, commercial
28
resources and human capital, which are likely to interact with the former at improving firm performance. The reason to focus on intangible assets is that, following the resource base view of the firm, they are likely to be inimitable. This increases the chances of achieving performance improvements. In order to test the hypothesis that the three resources are complementary, we have defined a set of strategies that takes into account all the possible combinations of the investments that the firm may choose as part of its innovation strategy.
There are two important conclusions that may be extracted from the exercise presented in this paper. First, our results show that the interactions between the intangibles considered in this paper are relevant at explaining firm performance. Therefore, our findings are in line with the literature on complementarities, which has found that the interaction of firm’s resources serves to limit effective imitation. In this line, Rivkin (2000) argues that, while isolated assets may be easily understood and imitated, a system of mutually complementary practices (especially if some are intangible) is be more difficult to copy. In this sense, those firms that invest on highly complementary assets outperform their rivals. In our case, we found strong complementarities between R&D and marketing investments. This finding, jointly with the fact that the relationship between R&D investments and human capital was only complementary when the firm performs investments in marketing assets indicates the importance of the latter at the time of improving firm performance.
Marketing investments are used to communicate the existence of a new product
to consumers, as well as to build brand name and increase firm reputation and
they serve to commercialise the results of the innovation process. In our results,
their interaction with human resources and R&D is essential for understanding
29
performance differences among firms. This seems to offer support to Teece’s (1986) model, by showing that certain complementary assets serve firms as mechanisms to appropriate the results of the innovation process. It also points out the importance of approaching the innovation strategy of firms in a global sense, and not only as a result of independent planning by the R&D function.
The role of strategic management at devising a comprehensive approach to the innovation strategy seems clearly needed, given that the interaction with other intangible elements such as the ones created through advertisement investments.
Second, although to a different extent, the paper stresses the role of
intangibles at explaining firm performance. In other words, the combinations of
R&D, marketing and human capital provide the firm with improvements in total
factor productivity if adequately interacted. These results seem to offer support
to the resource-based view of the firm, which explains differences in
performance in terms of resources that are rare, valuable, inimitable and not
readily substitutable (Barney, 1991). As several researchers have pointed out
(Sanchez, Chaminade and Olea, 2000; Teece, 2000), intangible resources
meet these criteria. In this sense, the three intangible assets analyzed in this
paper are considered to be of the greatest strategic importance (Gomez-Mejia
and Balkin 2002; Surroca et al., 2010). However, the fact that certain
combinations of resources improve performance more than others seems to
point out to the need of adopting a more global approach to the evaluation of
resources. When these resources are mixed in some optimal combinations they
seem to produce the highest performance effects.
30
A final consideration is that we have only focused on two of the multiple elements that may interact with R&D investments in order to provide firms with superior performance. In fact, the literature on complementarities seems to be divided between the studies taking the interaction approach and those choosing a systems approach (Ennen and Ritcher, 2010). As in our case, research belonging to the interaction approach study complementarities between a limited numbers of factors, not paying much attention to contextual factors.
Given our results, a possible extension of this paper could consider the interactions of other types of resources. Some of the candidates are market orientation (Morgan, Vorhies and Mason, 2009) and investments in technology.
Provided that our selection has attempted to maximize the likelihood of finding
performance effects, a possible focus of attention could be the interaction
between resources less likely to guarantee the appropriability of R&D. Some
tangible assets, such as investments in technology (hardware), which are more
easily imitable, could show if it is either the interaction or the characteristics of
the resources the one which is critical for improving performance. Therefore,
further research on the complementarities between R&D investments and other
resources should enhance our understanding of the effectiveness of a firm
innovation strategy.
31 REFERENCES
Barney, J. B., 1991. Firm resources and sustained competitive advantage.
Journal of Management, 17(1), 99-120.
Belderbos, R.; Carree, M.; Lokshin, B., 2006. Complementarity in R&D cooperation strategies, Review of Industrial Organization, 28 (4), 401-26.
Beneito, P., 2003. Choosing among alternative technological strategies: an empirical analysis of formal sources of innovation. Research Policy, 32(4), 693-713.
Bernard, A. B., Jensen, B., 1999. Exceptional Exporter Performance: Cause, Effect, or Both?. Journal of International Economics, 47, 1-25.
Bernard, A.B., Wagner, J., 2001. Export Entry and Exit by German Firms.
Weltwirtschaftliches Archiv 137, 105-23.
Carmeli, A.; Tishler, A., 2004. The relationships between intangible organizational elements and organizational performance, Strategic Management Journal, 25 (13), 1236–1257.
Cassiman B.; Veugelers R., 2006. In search of complementarity in innovation strategy: Internal R&D and external knowledge acquisition, Management Science, 52 (1), 68-82.
Chan, S. H., Martin J.; Kensinger, J., 1990. Corporate research and development expenditures and share value. Journal of Financial Economics 26, 255-276.
Coff R.W., 1999. When competitive advantage doesn’t lead to performance: the
resource-based view and stakeholder bargaining power. Organization
Science, 10(2), 119–133.
32
Cohen, W. M., Levinthal, D. A., 1990. Absorptive Capacity: A New Perspective on Learning and Innovation. Administrative Science Quarterly, 35, 128- 152.
Colombo, M. G.; Mosconi, R., 1995. Complementary and cumulative learning effects in the early diffusion of multiple technologies. Journal of Industrial Economics, 43, 13-48.
Cuneo, P.; Mairesse, J., 1984. Productivity and R&D at the firm level in French manufacturing, in Griliches, Z. (ed.), R&D, patents and productivity, National Bureau of Economic, Chicago. The University of Chicago Press, 375-392.
Denrell, J., Fang, C., Winter S.G., 2003. The economics of strategic opportunity, Strategic Management Journal, 24(10), 977-990.
Dierickx I, Cool K., 1989. Asset stock accumulation and sustainability of competitive advantage. Management Science 35(12): 1504-1511.
Doms, M.E., Jensen, J.B., 1998. Comparing wages, skills, and productivity between domestic and foreign owned manufacturing establishments in the United States, in Baldwin, R.E., Lipsey R.E., Richardson J.D., (eds.), Geography and ownership as bases for economic accounting. NBER Studies in income and wealth, 59, University of Chicago Press.
Ennen, E. and Richter, A., 2010. The whole is more than the sum of its parts – or is it? A review of the empirical literature on complementarities in organizations. Journal of Management, 36, 207-233.
Fernandez, E.; Montes, J.M.; Vazquez, C.J., 2000. Typology and strategic
analysis of intangible resources. Technovation, 20(2), 81-92.
33
Ghemawat P., 1991. Market incumbency and technological inertia. Marketing
Science 10(2), 161–171.
Gomez-Mejia L. R.; Balkin D. B., 2002. Management, McGraw-Hill: New York.
Gómez, J.; Vargas, P., 2009: The effect of financial constraints, absorptive capacity and complementarities on the adoption of multiple process technologies. Research Policy, 38 (1), 106-119.
Griffith, R., 1999. Using the ADR establishment level data to look at the foreign ownership and productivity in the United Kingdom. Economic Journal 109 (456), 416-441.
Griliches, Z., 1979. Issues in assessing the contribution of R&D to productivity growth, The Bell Journal of Economics, 10, 92-116.
Griliches, Z., 1981. Market value, R&D and patents, Economic Letters, 7, 183- 187.
Griliches, Z.; Hall, B.H.; Pakes, A., 1981. R&D, patents and market value revisited: is there a second technological opportunity factor?, Economics of Innovation and New Technology, 1, 183-202.
Griliches, Z.; Mairesse, J., 1984. Productivity and R&D at the firm level, in Griliches, Z. (ed.), R&D, patents and productivity, National Bureau of Economic, Chicago: The University of Chicago Press, 339-374.
Grossman G.M., Helpman, E., 1991. Quality ladders in the theory of growth, The Review of Economic Studies, 58(1), 43-61.
Hall, B. H., 1993. The stock market valuation of R&D investment during 1980s American Economic Review, 83, 259-264.
Hall, B. H.; Oriani, R., 2006. Does the Market Value R&D Investment by
European Firms?. Evidence from a Panel of Manufacturing Firms in
34
France, Germay and Italy. International Journal of Industrial Organization, 24(5) 971-993.
Hess, A. M., Rothaermel, F. T., 2011. When are assets complementary? Star scientists, strategic alliances and innovation in the pharmaceutical industry. Strategic Management Journal, 32 (8), 895-909.
Hirchey, M., 1985. Market structure and market value. Journal of Business, January, 89-98.
Hirchey, M.; Weygandt, J. J., 1985. Amortization policy for advertising and research and development expenditures, Journal of Accounting Research, 23, 326-335.
Javorcik B. S., 2004. Does Foreign Direct Investment Increase the Productivity of Domestic Firms? In Search of Spillovers through Backward Linkages, American Economic Review, 94(3), 605-627.
Jose, M. L.; Nichols, M.; Stevens, J. L., 1986. Contributions of diversification, promotion and R&D to the value of multiproduct firms: a Tobin´s Q approach. Financial Management, Winter, 33-42.
Kodde. D.; Palm, F., 1986 Wald criteria for jointly testing equality and inequality restrictions. Econométrica, 54(5),1243-1248.
Kogut B, Zander U., 1992. Knowledge of the firm, combinative capabilities, and the replication of technology. Organization Science, 3, 383–397
Krasnikov, A. and Jayachandran, S., (2008) “The relative impact of marketing, research-and-development, and operations capabilities on firm performance”, Journal of Marketing, 71, 1-11.
Lee, F., Tang, J., 2001. Multifactor productivity disparity between Canadian and
U.S. Manufacturing Firms. Journal of Productivity Analysis, 15, 115-128.
35
Leiponen, A., 2005. Skills and Innovation, International Journal of Industrial
Organization, 23, 303-323.
Lippman, S. A., Rumelt, R., 1982. Uncertain imitability: An analysis of intefirm differences in efficiency under competition. Bell Journal of Economics, 13, 418-438.
Lippman, S. A., Rumelt, R.P., 1992. Demand Uncertainty, Capital Specificity, and Industry. Evolution, Industrial and Corporate Change, 1 (1), 235-262.
Lippman S.A., Rumelt R., 2003. The payments perspective: micro-foundations of resource analysis. Strategic Management Journal, 24(10), 903-927.
Martinez-Ros, E., 2000. Explaining the decisions to carry out product and process innovations: the Spanish case. Journal of High Technology Management Research, 10, 223–242.
Merino, F.; Rodríguez D., 1997. A consistent analysis of diversification decisions with unobservable firm effects. Strategic Management Journal, 18, 733-743.
Milgrom, P. R.; Roberts. J., 1995. Complementarities and fit: Strategy, structure, and organizational change in manufacturing, Journal of Accounting and Economics, 19, 179–208.
Mohnen,P.; Röller, L., 2005. Complementarities in innovation policy. European Economic Review, 49, 1431–1450.
Morgan, N.A., Vorhies, D.W. and Mason, D.H., 2009. Market orientation, marketing capabilities, and firm performance, Strategic Management Journal, 30, 909-920.
Morison , E.W., Phelps, C.C., 1999. Taking charge at work: extrarole efforts to
initiate workplace change, Academy of Management Journal, 42, 403-419.
36
Nahapiet, J., Ghosal, S., 1998. Social capital, intelellectual capital and the
organizational advantage, Academy of Management Review, 23 (2), 242- 626.
Newbert S.L., 2007. Empirical research on the resource based view of the firm:
an assessment and suggestions for future research. Strategic Management Journal, 28(2), 121–146.
Olley S. G., Pakes A., 1996. The Dynamics of Productivity in the Telecommunications Equipment Industry. Econometrica, 64(6), 1263- 1297.
Rao, S., Tang, J., 2000. Are Canadian-controlled manufacturing firms less productive than their foreign controlled counterparts? Industry Canada, Working Paper, 31.
Rivkin, J. W., 2000. Imitation complex strategies. Management Science, 46, 824-844.
Sanchez P., Chaminade C., Olea M., 2000. Management of intangibles: an attempt to build theory. Journal of Intellectual Capital, 1(4), 312–327.
Song, J., Almeida, P., Wu, G., 2003. Learning by hiring: When is mobility more likely to facilitate knowledge transfer?. Management Science, 49, 351-365.
Surroca, J., Tribó, J., Waddock, S., 2010. Corporate responsibility and financial performance: the role of intangible resources. Strategic Management Journal, 31 (5), 463-490.
Syverson, Ch., 2011. What determines productivity?.
Journal of Economic Literature,49(2), 326–365.
37
Szewczyk, S. H., Tsetsekos, G.P., 1996. The valuation of corporate R&D
expenditures: evidence from investment opportunities and free cash-flow.
Financial Management, 25 (1), 105-110.
Teece, D., 1986. Profiting from Technological Innovation: Implications for Integration, Collaboration, Licensing and Public Policy. Research Policy, 15, 285-305.
Teece, D., 2000. Strategies for managing knowledge assets: The role of firm structure and industrial context. Long Range Planning, 33(1), 35-54.
Tripsas, M., 1997. Unraveling the process of creative destruction:
complementary assets and incumbent survival in the typesetter industry, Strategic Management Journal, 18, 119-142.
Villalonga, B., 2004. Intangibles resources, Tobin's q, and the sustainability of performance differences, Journal of Economic Behaviour and Organization, 54 (2), 205-230.
Wernerfelt, B., 1984. A resource based view of the firm. Strategic Management Journal, 5, 171-180.
Woolridge J. R., 1988. Competitive decline and corporate restructuring: is a myopic stock market to blame?. Journal of Applied Corporate Finance, 1, 26-36.
Woolridge, J. R.; Snow, Ch. C., 1990. Stock market reaction to strategic investment decisions. Strategic Management Journal, 11, 353-363.
Wozniak, G.D., 1984. The adoption of interrelated innovations: A human capital
approach. The Review of Economics and Statistics, 66(1), 70-79.
38 Appendix 1. Estimation methology. The Olley and Pakes procedure
To identify the influence of intangible assets on the productivity dynamics of manufacturing firms, we employ a two-stages procedure (see Griffith, 1999;
Javorcik, 2004). The first stage consists of the estimation of the firm specific total factor productivity (TFP) levels, which we relate in a second stage to a vector of intangible assets. Econometric issues arise in the estimation of equation (1), due to the potential simultaneity bias between input choices and the productivity shocks, which cause the OLS estimates to be biased. Firms observe their own productivity and may respond to a positive productivity shock by using more inputs. A number of solutions have been proposed in the literature to overcome this problem. Among others, these include using firm- level fixed effects and instrumental variable strategy for input choices. Instead, we use a semi-parametric estimator suggested by Olley and Pakes (1996), which solves the simultaneity problem by using the firm’s investment decision to proxy unobserved productivity shocks and explicitly controls for selection in estimating TFP.
Olley and Pakes (1996) consider fixed capital as a quasi-fixed input, and take the usual assumption that capital is accumulated by firms through a deterministic dynamic investment process k
it= (1 − δ) k
it−1+ i
i,twhere i
itdenotes the investment expenditure at period t. Investment demand can be defined by means of an unknown function i
it= i (k
it, ω
it).
Since investment depends on fixed capital stock and firm unobserved productivity, we can invert the investment function, and therefore, express the unobserved productivity as a non parametric function of investment and capital:
ωit
= h
t(k
it, i
it). In this way, equation (1) can be written as follows:
39
y
it= β
0+ β
kk
it+ β
ll
it+ β
mm
it+ h
t(k
it, i
it)+ e
it(3) If we define φ(k
it, i
it)= β
0+ β
kk
it+ h
t(k
it, i
it), we obtain:
y
it= β
ll
<