However, these layout tools typically do not attempt to apply intelligence to the layout of the schema objects outside the. It is up to the tool user to reposition the tool locations. One of the motivations for investigating evolutionary strategies in the development of an ERD layout program is to learn whether these types of problems can be addressed elegantly.
Bateson also discusses the importance of chance in order to offer the potential for something new. For example, in the basic version of Conway's Game of Life, the random element does not exist. Usually this is done by adding an "obstacle" to the environment - the seemingly random element.
This is a calculation of the area of the bounding rectangle of the nodes in the graph. This is a calculation of the angle between edges connected to the same node and penalizes connections that form acute angles. The beauty of the genetic algorithm is that the engine is blind to the understanding of the problem.
They considered Bateson's two large stochastic systems, evolution and mind, and concluded that “large stochastic systems differ from each other: one uses selection, removing less fit members from the population, and the other adapts by changing states.
METHODOLOGY METHODOLOGY
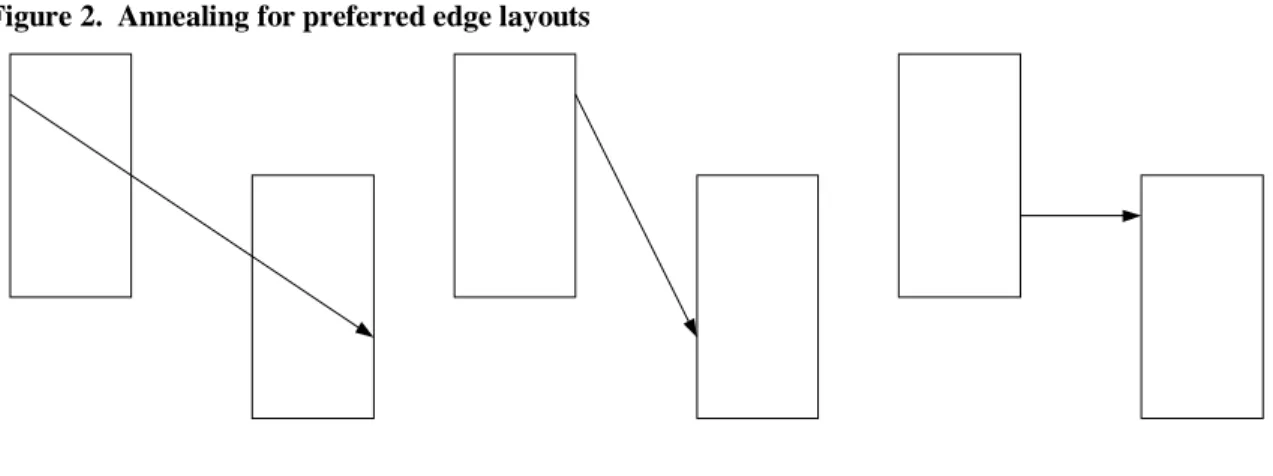
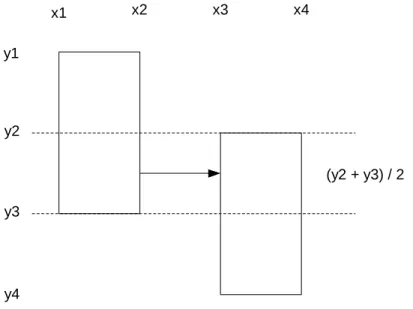
An entity has a preferred height based on the number of columns in the table and a preferred width based on the size of the name of the longest column. Edge endpoints must be as close as possible to the center of the attached entity edge. If we consider these principles as forces pulling the layout of the graph in different directions, it becomes clear that there are many conflicting forces.
To get around this, decisions must depend solely on knowledge of the local environment (the nearest neighbors). Another important strategy is the use of feedback, where the results of one iteration directly influence the results of the next. The phenotype must be able to learn from other members of the population or through a common body of knowledge made available in the population's environment.
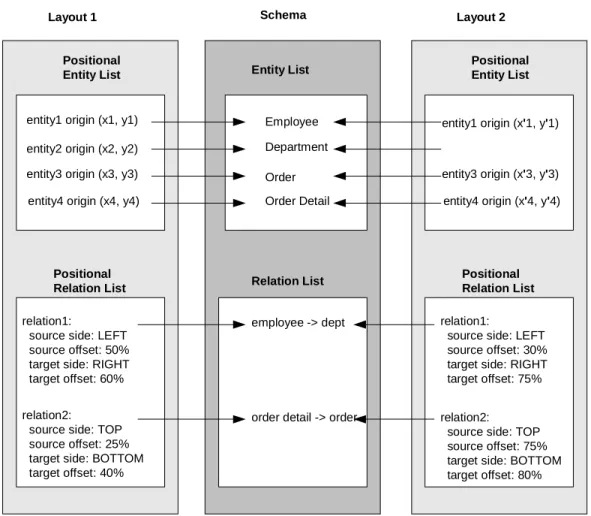
Kennedy and Eberhart describe how this could potentially be implemented: when an entity encounters a neighbor, give it a chance to copy an attribute of the neighbor. In this way, a practical implementation of learning is possible, without any knowledge of what is being learned, nor of the accuracy of what is being learned. A layout has enough information to map entities by maintaining the x and y coordinate of the origin for each entity.
The length and width of the entity can be determined based on the desired size of the entity. To plot a relation, the layout maintains the relative offset of the endpoint of each relation from the side of the entity to which the endpoint is attached. It shows two different layouts for the same scheme and each layout would result in a different graphical representation of the scheme.
A binary string representing a layout is formed by concatenating the positional coordinates (in binary format) of the layout. The coordinates are also used to determine the suitability of the layout, while the genetic algorithm engine operates on a population of layout strings. In the early stages of the design concept, consideration was given to using XML elements instead of the traditional binary strings to build the chromosome.
RESULTS
One of the major disappointments with the generated ERDs was the difficulty in obtaining orthogonal lines for the relationships. Another problem encountered when the weight of the orthogonality factor was increased in the fitness function was the tendency for the entire population of a run to lock onto a particular layout. For this reason, the calculation of fitness was changed to be calculated as a factor of the number of.
If a negative fitness value occurs, the GA engine simply increases the fitness of all members by the size of the minimum value. Performance is proportional to the number of entities, the number of relationships, the size of the population and the number of generations to evolve. The original implementation of the ERD Viewer used a directed graph abstract data type (ADT) where each node hosted an entity and each directed edge hosted a relationship.
There seemed to be no noticeable improvement in the layout of the ERDs when using more than 100 generations. It appears that the weights of the fitness functions had a much greater influence on the outcome of the layouts than the population. Adjusting the GA engine to allow the survival of the strongest members for multiple generations before they age and die.
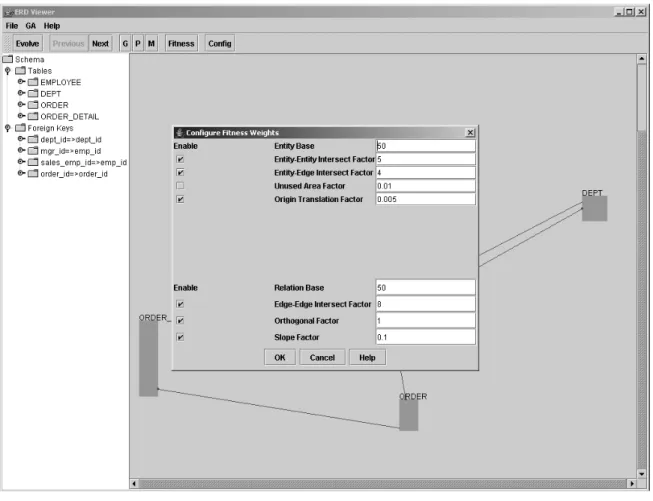
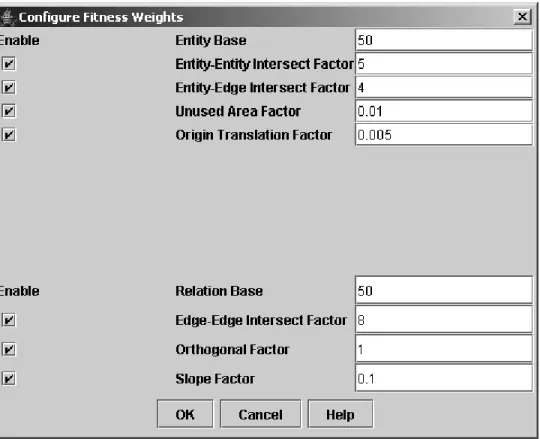
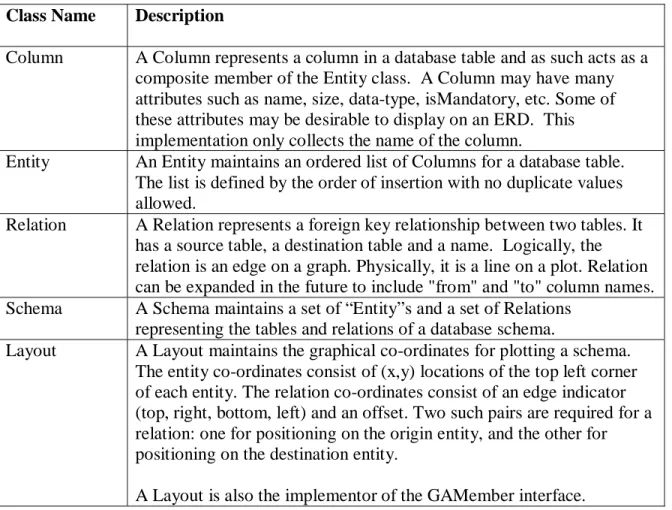
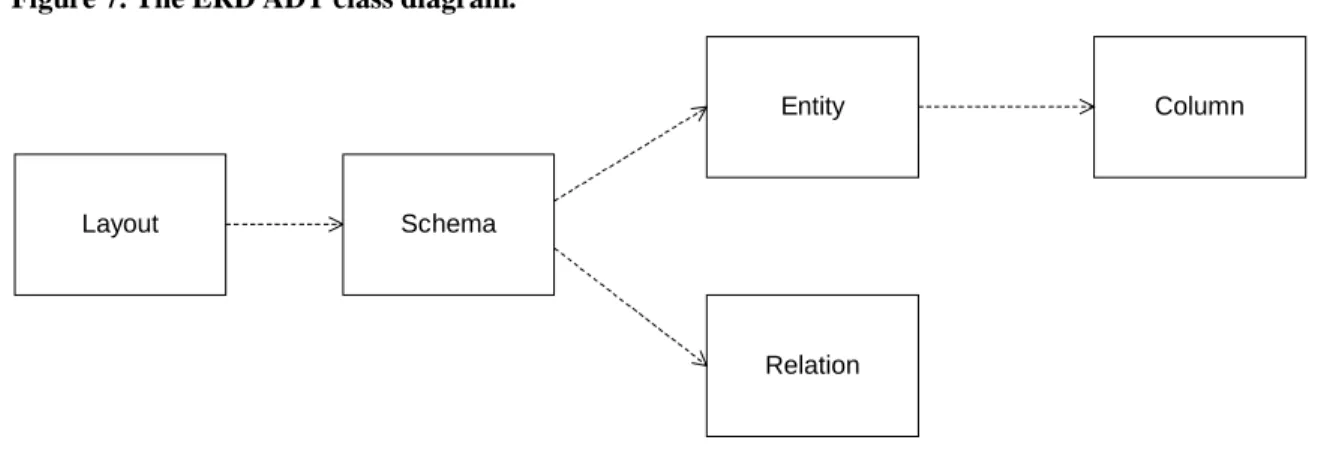
While the GA engine is mechanistic in nature, making it independent of the problem space in which it is being developed, the fitness function of the population members forms the core of the process. Even assuming knowledge of the factors affecting the fitness function, balancing these factors against each other can prove to be the most challenging task. Column A column represents a column in a database table and as such acts as a composite member of the Entity class.
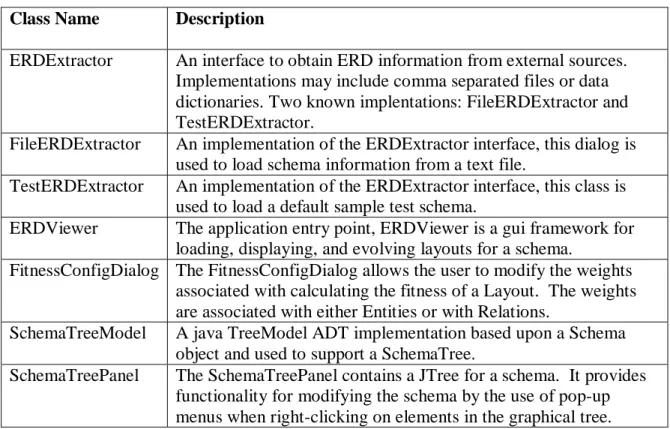
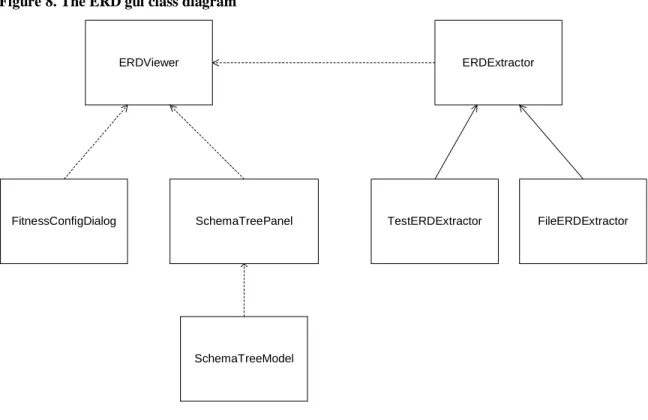
The entity coordinates consist of (x,y) locations in the upper left corner of each entity. FileERExtractor An implementation of the ERExtractor interface, this dialog is used to load schema information from a text file. TestERDExtractor An implementation of the ERDExtractor interface, this class is used to load a standard sample test scheme.
The ADT Graph implementation is based on Goodrich and Tamassia Data Structures and Algorithms in Java. The ADT chart is not in use in the current version of the program, but is suggested to be re-implemented in a future version.