Contents lists available atScienceDirect
Accident Analysis and Prevention
j o u r n a l h o m e p a g e :w w w . e l s e v i e r . c o m / l o c a t e / a a p
Predictors of driving after alcohol and drug use among
adolescents in Valencia (Spain)
Sofía Tomas Dols
a, Francisco Javier Álvarez González
b,∗, Noelia Llorens Aleixandre
c,
Antonio Vidal-Infer
d, María José Torrijo Rodrigo
e, Juan Carlos Valderrama-Zurián
f aDirección General de Drogodependencias, Conselleria de Sanitat, Generalitat Valenciana, Valencia, SpainbInstitute for Alcohol and Drug Studies, Faculty of Medicine, University of Valladolid, Spain, C/Ramón y Cajal 7, 47005 Valladolid, Spain cFundación para el Estudio, Prevencion y Asistencia a las Drogodependencias (FEPAD), Valencia, Spain
dPsychology Department, School of Psychology, University of Valencia, Spain
eFundación para el Estudio, Prevención y Asistencia a las Drogodependencias (FEPAD), Valencia, Spain
fCentro de Investigación de Seguridad y Emergencias, IVASPE, Conselleria de Gobernacion, Generalitat Valenciana, Valencia, Spain
a r t i c l e i n f o
Article history: Received 8 May 2009
Received in revised form 15 June 2010 Accepted 15 June 2010
Keywords: Adolescence Alcohol Driving Predictors Substance use
a b s t r a c t
Background:Driving under the influence of alcohol and drugs has been identified as a risk factor for road traffic crashes. We have assessed the prevalence and predictor factors for driving after alcohol and drug use by adolescents.
Methods:A cross-sectional survey involving 11,239 students aged 14–18 years from 252 private and public schools in the Valencia region of Spain was conducted. The prevalence and predictors of driving after alcohol use, alcohol and drug use, or drug use during the previous 6 months were measured.
Results:Of the students who reported driving (20%), 45.1% indicated driving after alcohol and drug use. The consumption of various drugs was higher among students who drove a vehicle compared with those who did not. The likelihood of driving after consuming alcohol, or alcohol and drugs, increased in line with the number of standard drink units per week, reports of any lifetime alcohol- or drug-related problems, and poor family relationship. In addition, masculine gender and early alcohol use increased the likelihood of driving after consuming alcohol.
Conclusions:Driving after alcohol and drug use is quite prevalent among adolescents in the Valencia region of Spain. There is a need for implementation of targeted policies for adolescents. This should focus on education and information on alcohol/drug use and driving.
© 2010 Published by Elsevier Ltd.
1. Introduction
Driving under the influence of alcohol has been recognized as a major factor for traffic crashes (European Commission, 2001). There is also an increasing interest in, and concern about the role of drugs in traffic crashes and how to promote adequate prevention (European Commission, 2001; EMCDDA, 2007). Within the Euro-pean Union (EU), policy to reduce road deaths by 50% by 2010, through intervention in drugged-driving is a priority (European Commission, 2001). Various research efforts in this field, such as the current DRUID project (http://www.druid-project.org), have been supported by the EU.
Worldwide, the prevalence of illicit drug use at the wheel differs markedly depending on the target population studied (e.g. drivers, injured, killed), study design (e.g. random roadside surveys or on
∗Corresponding author. Tel.: +34 983 423077; fax: +34 983 423022. E-mail address:[email protected](F.J.Á. González).
suspicious drivers), and countries (EMCDDA, 2007; Mura et al., 2006). Although it is estimated that the prevalence of illicit drugs use in the general driving population in different European coun-tries ranges from 1 to 5% (EMCDDA, 2007), the figures in France are noticeably higher in young adults (<30 years of age) (Mura et al., 2006).
Whereas these concerns include all drugs, particular aware-ness exists with respect to driving under the influence of cannabis (EMCDDA, 2007). Cannabis is the most frequent illegal drug con-sumed by drivers (EMCDDA, 2007; Raes and Verstraete, 2006), most of whom believe that cannabis only slightly impairs driving (Terry and Wright, 2005).
Although various studies have reported diverse factors that pre-dict driving after cannabis use in various target populations, there is limited information available on factors that predict the likeli-hood of driving under the influence of drugs. Existing studies are related to assessing factors that predict driving after cannabis use in various target populations (Alvarez et al., 2007; Asbridge et al., 2005; Begg et al., 2003; Fischer et al., 2006; Jones et al., 2007; Richer and Bergeron, 2009).
With respect to the use of cannabis, some of the associated factors include: prior traffic offence convictions at the age of 21, low risk awareness at the age of 18 (measured through a modified version of the multidimensional personality questionnaire, includ-ing traditionalism, harm avoidance and control scales), and beinclud-ing cannabis-dependent at the age of 21 (Begg et al., 2003); being male or a more experienced driver, driver use of fake identification to buy alcohol, and self-reported drunk-driving (Asbridge et al., 2005); a high frequency of cannabis use and driving in the previous year (Fischer et al., 2006); the use of multiple drugs, the belief that driv-ing under the influence of cannabis does not increase accident risk, and being cannabis-dependent (Jones et al., 2007); as well as driv-ing under the influence of cannabis in the previous year (Alvarez et al., 2007); and risky and negative emotional driving, sensation seeking and impulsivity (Richer and Bergeron, 2009).
These risk factors for driving under the influence of cannabis can be summarized as gender pattern, patterns of alcohol or drug use, substance use-related problems, and the perceived risk of sub-stances consumed. These and related risk factors were selected for inclusion in the present study.
In Spain, the legal age for driving a car is 18 years of age, whereas riding a motorcycle is legal from 14 years of age onward. The latter is frequent due to the warm, Mediterranean climate of the Valencia region.
The present study aimed to assess the prevalence and predictors of driving after alcohol and drug use during a night out in the previ-ous 6 months among adolescent students. Since the use of multiple drugs is common (EMCDDA, 2007), we assessed this for those stu-dents who indicated driving after alcohol, alcohol and drug, or drug use. The target population (school students aged 14–18 years) rep-resents a critical age range because substance use and driving (e.g. moped or motorcycle) tend to start during this time.
2. Methods
2.1. Participants and procedure
The target population was students attending the last 2 years of compulsory secondary education (ESO in the Spanish system; Edu-cación Secundaria Obligatoria, 3rd and 4th courses), the 2 years of Sixth Form College (Bachillerato in the Spanish system, 1st and 2nd courses) as well as students attending formative cycles of further continuing education (ciclos formativos de grado medio and grado uperior, as well as plan de garantía social in the Span-ish system) at both public and private schools in the Valencia region of Spain. The academic year commences in September, with students usually aged 14–15 for the last two years of secondary education, and 16 and 17 in Sixth Form College. For the other courses ages can vary. Students younger than 14 and older than 18 were excluded from the study. Data on stratification was based on enrolment figures for students registered in the academic year 2005–2006.
The study was carried out between March and May 2006 and covered 252 schools after obtaining ethical approval. Schools were selected through multistage cluster sampling with proportional allocation representing the target population. The sample was first stratified by school year (academic course), then by school type (public or private), and third by student gender (male/female). The survey was presented in the form of a structured questionnaire, completed voluntarily and anonymously by the students in a class-room under the supervision of trained staff. Ninety-nine individuals refused to take part in the study.
The questionnaire was validated through a pre-test on 1000 stu-dents. One hundred of them were interviewed later to assess the concordance of the responses given.
2.2. Measures
The structured questionnaire requested information on respon-dents’ socio-demographic information, family relationships, edu-cational background, and patterns of alcohol and drug use. The questionnaire can be obtained upon request from the correspond-ing author.
Students were asked to indicate their response to the following questions concerning their actual behaviour on a night out dur-ing the previous 6 months by markdur-ing a cross in the appropriate box: (i) did you drive a vehicle? (moped, motorcycle, car); (ii) did you consume alcohol and/or drugs before driving? (yes, no); and (iii) if yes, what were the substances consumed? (alcohol, cannabis, opiates, cocaine, ecstasy and other stimulants, LSD and other hal-lucinogens). This information was requested with respect to the following times: 18, 20, 22, 24, 2, 4, 6, and 8 h.
2.3. Analysis
SPSS version 14.0 was used. Associations between indepen-dent variables [including gender, age, number of standard drink units (SDUs) per week, starting age for alcohol consumption, num-ber of cannabis cigarettes smoked per week, perceived degree of danger for alcohol and cannabis consumption, any alcohol- or drug-related problems reported for their lifetime, if they had repeated an academic year, how well they thought they were doing in their studies, and family relationships] were evaluated, firstly, with a logistic regression analysis in which the dependent variable was driving a vehicle after substance use. In a second step, a multi-nomial logistic regression analysis was carried out in which the dependent variable was a report of driving a vehicle after (i) alco-hol, (ii) alcohol and drugs, or (iii) drugs on a night out during the previous 6 months. The logistic regression method was used as follows: forward step with an input probability of 0.05 and an output probability of 0.10. The odds ratio (OR) was estab-lished at a 95% confidence interval (CI). Significance was set at
p≤0.05.
3. Results
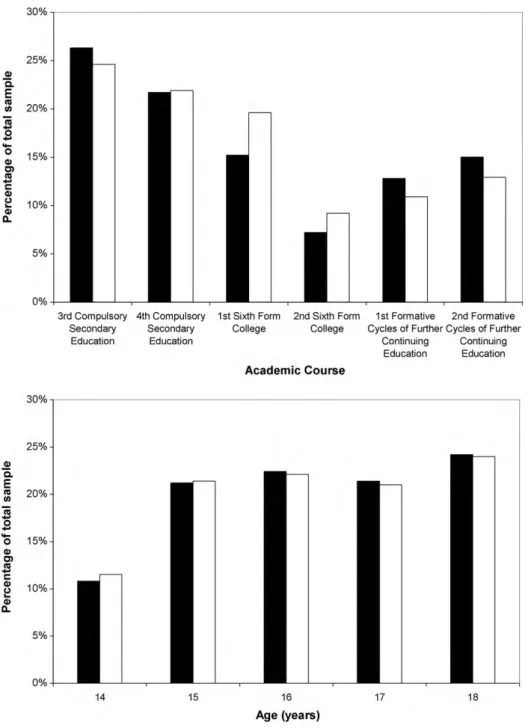
The final sample included 11,239 students (Fig. 1), 47.6% were males and 52.4% females; 1251 (11.1%) were aged 14; 2386 (21.2%) were 15; 2490 (22.2%) were 16; 2376 (21.1%) were 17; and 2736 (24.3%) were 18.
20% of the respondents (2251 out of 11239 students) reported driving in the previous 6 months. They were predominantly males (males 30.5%, females 10.1%;2= 732.99,p< 0.001). 9% reported driving a vehicle after alcohol and/or drug use (males 15.5%, females 3.9%;2= 431.19,p< 0.001). The older the students were, the more frequently they reported driving a vehicle (increasing from 9.5% in 14 year olds to 31.1% in 18 year olds;2= 333.69, df = 4,p< 0.001) and driving after alcohol and/or drug use (14 year olds, 38.3%; 18 year olds, 45.5% of students who drove a vehicle;2= 155.71, df = 4,
p< 0.001).
Among the students who drove a vehicle, the percentage that drove after consuming alcohol and/or drugs (Table 1) gradually increased from 18 h (22.6%) to 2 h (65.2%). At 24, 2, 4, and 6 h, more than 50% of the students who reported driving a vehicle indicated they had driven after consuming alcohol and/or drugs.
Fig. 1.Sample distribution by academic course/age and gender (male,female).
Table 1
Frequency of alcohol and drug consumption by students at different hours of the night in the previous 6 months.
Time (h) Did not drive A vehicle
Drove A vehicle drugs consumed by students at the different times
n(% of total sample)
n(% of total sample)
Driving a vehicle after alcohol/drug usen(% of students that drive a vehicle)
Alcoholn (%)
Cannabis n(%)
Cocainen (%)
LSDn (%)
Opiatesn (%)
Ecstasy and other stimulantsn(%)
18 9453 (84.1) 1786 (15.9) 404 (22.6) 130 (7.3) 320 (17.9) 13 (0.7) 7 (0.4) 3 (0.2) 6 (0.3)
20 9722 (86.5) 1517 (13.5) 379 (25.0) 158 (10.4) 272 (17.9) 14 (0.9) 5 (0.3) 2 (0.1) 3 (0.2)
22 10,122 (90.1) 1117 (9.9) 392 (35.1) 332 (29.7) 149 (13.3) 20 (1.8) 10 (0.9) 3 (0.3) 8 (0.7) 24 10,252 (91.3) 981 (8.7) 581 (59.2) 554 (56.5) 230 (23.4) 40 (4.1) 17 (1.7) 7 (0.7) 20 (2.0) 2 10,530 (93.7) 709 (6.3) 462 (65.2) 441 (62.2) 163 (23.0) 56 (7.9) 10 (1.4) 2 (0.3) 15 (2.1) 4 10,680 (95.0) 559 (5.0) 342 (61.2) 325 (58.1) 133 (23.8) 59 (10.5) 12 (2.1) 2 (0.4) 22 (3.9)
6 11,000 (96.4) 409 (3.6) 239 (58.4) 223 (54.5) 96 (23.5) 47 (11.5) 8 (2.0) 11(2.7) 21 (5.1)
8 11,151 (97.5) 284 (2.5) 88 (31.0) 71 (25.0) 48 (17.1) 20 (6.9) 10 (3.5) 2 (0.7) 11 (3.9)
Table 2
Alcohol and/or drug use by students during a night out in the previous 6 months.
Did not drive a vehicle (n= 8988)
Some students consumed various drugs at the same time, resulting in percentages higher than 100% at the different times.
Table 3
Variables that predict driving after alcohol and/or drug use among students during a night out in the previous 6 months.
Driving after
Alcohol and drug use Alcohol consumption Drug-cannabis use
p-Value OR 95% CI p-Value OR 95% CI p-Value OR 95% CI
Gender (male = 1) <0.005 0.65 0.48–0.87
Standard drink units/week <0.0001 1.04 1.03–1.05 <0.0001 1.04 1.03–1.05
Starting age for alcohol consumption <0.05 1.14 1.02–1.26
Number of cannabis cigarettes smoked/week <0.0001 1.21 1.18–1.25 <0.0001 1.20 1.14–1.25
Perception of the danger of consuming cannabis <0.01 0.75 0.61–0.92 <0.0001 0.25 0.13–0.49
Repeated an academic course <0.05 1.45 1.06–1.97
Report of alcohol/drug problems in their lifetime <0.0001 2.13 1.51–2.99 <0.01 1.43 1.09–1.88 Student’s family relationship <0.05 1.24 1.01–1.52 <0.0001 1.42 1.19–1.70
OR = odds ratio; CI = 95% confidence interval.
more common among drivers in the early hours of the morning (Table 1).
At any time during the night, the consumption of the differ-ent drugs was higher among studdiffer-ents that drove a vehicle than those who did not, whereas the opposite was true for alcohol (Table 2).
If we consider any substance use, either alcohol and/or drug use, among students who reported driving during a night out, logistic regression analysis showed that being male (female OR = 0.74, 95% CI 0.58–0.94,p< 0.01), consuming more SDUs per week (OR = 1.04, 95% CI 1.03–1.05,p< 0.0001), smoking more cannabis cigarettes per week (OR = 1.14, 95% CI 1.11–1.17,p< 0.0001), having a lower awareness of the dangers of cannabis (OR = 0.87, 95% CI 0.75–0.99,
p< 0.05), having a worse family relationship (OR = 1.34, 95% CI 1.16–1.57,p< 0.0001), and reporting alcohol- and/or drug-related problems in their lifetime (OR = 1.64, 95% CI 1.30–2.07,p< 0.0001) indicated a greater likelihood of driving after consuming alcohol and/or drugs.
Of the 2251 students who reported driving on a night out dur-ing the previous 6 months, 425 drove after alcohol use, 561 drove after alcohol and drug use, and 30 drove after drug use. In these 30 cases, at least cannabis was consumed. Multinomial logistic regres-sion analysis (Table 3) showed that the higher the number of SDUs per week, reports of any alcohol- and/or drug-related problems in their lifetime, and the worse the family relationship, the higher the likelihood of driving after consuming alcohol or alcohol and drugs. In addition, being male and having experienced alcohol con-sumption at a younger age increased the likelihood of driving after consuming alcohol. The higher the number of cannabis cigarettes smoked per week and the lower the awareness of the dangers of cannabis, the higher the likelihood of driving after consuming drugs or alcohol and drugs. Furthermore, students who had repeated a school year had an increased likelihood of driving after alcohol and/or drug use. None of the other potential predictor variables, including age, perception of the dangers of consuming alcohol, and how well they thought their studies were progressing, showed any significant effect.
4. Discussion
While the danger inherent in driving under the influence of alco-hol and/or drugs appears to be widely known, our study suggests that a substantial percentage of students engage in these dangerous practices. Driving after alcohol and drug use was also previously reported in the adult population (1.9%,Walsh and Mann, 1999, and 1.5%,Alvarez et al., 2007), regular cannabis users (82%,Terry and Wright, 2005, and 78%,Jones et al., 2007), and young adults attending electronic music dance events (61.8%,Furr-Holden et al., 2006).
Alcohol and cannabis were the most frequently consumed drugs at any time. As the night passes, students reported more frequent use of cocaine, ecstasy, and LSD. Multiple drug use, as found in the present study, has been reported for the population, in particu-lar for the young adults (Furr-Holden et al., 2006; Midanik et al., 2007), which leads to an increased effect on psychomotor perfor-mance, as well as an increase in traffic accident risk (Laumon et al., 2005; Ramaekers et al., 2004, 2006; Richer and Bergeron, 2009). It should be mentioned that, in the present study, no information was recorded regarding exposure in terms of kilometres driven. Driving after alcohol and drug use reported by the students refers to, in most cases, short trips from home to the leisure areas or between leisure areas. It has recently been reported that those who drive fewer kilo-metres have an increased risk of traffic accidents, the so-called low mileage bias (Langford et al., 2006).
and concerned about driving under the influence of alcohol than drugs.
The present findings suggest that the common predictor for driving after alcohol, alcohol and drug, or drug use among school students was the quantity of the substance used, such as the num-ber of SDUs per week and/or the numnum-ber of cannabis cigarettes smoked per week. In comparison with studies on the adult popula-tion (>18 years old) (Alvarez et al., 2007; Fischer et al., 2006; Jones et al., 2007), substance use-related problems seems to be the com-mon predictor if we consider predictors for driving after alcohol and drug use.
Limitations of this study include the possibility of under rep-resentation of the 16–18 year age group, since attendance is mandatory until 16 years of age. There is also the possibility of under representing car drivers, since the majority in the age group studied are permitted to ride. Furthermore, this is an age range (14–18) in which driving behaviour may not be relatively stable. Some of the students may have started riding/driving during the previous 6-month interval. Others may have acquired sporadic access to a vehicle. Furthermore, substance use behaviours may also be variable. Fourth, because the results are based on retrospec-tive self-reporting, a possible bias due to memory effects should be taken into account. Finally, we have analysed predictors of past behaviour using cross-sectional data. To what extent these could predict future behaviour is unknown. Furthermore, although the sample in the present study was representative of the school-aged students, the generalization of the results to either Spanish or Euro-pean school-aged students should be performed with caution.
In spite of increasing research in the field of drugs and driv-ing, namely those funded by the EU (EMCDDA, 2007; Raes and Verstraete, 2006) in recent years, there is a need for increased awareness in the field. It is expected that the outcome of the currently ongoing 5-year EU project, DRUID ( http://www.druid-project.org), will provide key information on relevant issues regarding the magnitude of drug driving epidemiology, the risk associated with driving under the influence of drugs, on the road detection of drugged-driving, and licensing/re-licensing and reha-bilitation issues. However, to the best of our knowledge, this study shows clearly that prevention approaches and their evaluation, at least at the EU level, are still lacking.
Our data adds to existing evidence of the widespread behaviour of driving after alcohol and drug use, not just by the adult popu-lation but also by school-aged students, and enables us to identify risk and protective factors. This information would be useful for developing more effectively targeted drunk- or drugged-driving prevention policies. For example, this study shows that the lower the awareness of the dangers of cannabis, the higher the likelihood of driving after consuming drugs or alcohol and drugs. This urge to promote an adequate risk perception about the danger of driv-ing after drug use has been highlighted previously (EMCDDA, 2007; Terry and Wright, 2005).
There is a need for the development of appropriate policies in the field of drugs and driving. Increasing the certainty of punish-ment would reduce driving after cannabis use, whereas providing information about the risk associated with such behaviour has little effect (Jones et al., 2006). There is insufficient evidence regarding the effectiveness of school-based programs for avoiding drunk-driving (Elder et al., 2005).
Along these lines, increasing efforts are being made in the field for a reliable system to detect drugs in oral fluids and the development of appropriate legislative and enforcement measures (Asbridge, 2006; Walsh et al., 2008).
Teenagers are at a greater risk of traffic accidents, particu-larly because they are less experienced drivers, have inadequate hazard-perception skills, and frequently use alcohol and/or drugs (Committee on Injury, Violence, and Poison Prevention,
Ameri-can Academy of Pediatrics; Committee on Adolescence, AmeriAmeri-can Academy of Pediatrics,Weiss, 2006). We have found that those stu-dents who drive a vehicle have more frequent alcohol and/or drug use than those who do not. Therefore, intervention at this level is a priority and must focus on educating and informing adolescents of the risks of driving after alcohol and drug use.
Conflict of interest
None.
Acknowledgements
The authors would like to thank the professionals from the “Unidades de Prevencion Comunitaria” of the Valencia Region (Spain) and the students who were evaluated. This work was sup-ported by grants from the Fundación para el Estudio Prevención y Asistencia a las Drogodependencias (FEPAD), Conselleria de Sanitat, Generalitat Valenciana; Consejería de Familia e Igualdad de Opor-tunidades; and from the Ministerio de Sanidad y Consumo, Instituto de Salud Carlos III, Redes Temáticas de Investigación Cooperativa, Red de Trastornos Adictivos RD06/0001/0020.
References
Alvarez, F.J., Fierro, I., Del Río, M.C., 2007. Cannabis and driving: results from a general population survey. Forensic Science International 170, 111–116.
Asbridge, M., 2006. Drugs and driving: when science and policy don’t mix. Canadian Journal of Public Health 97, 283–285.
Asbridge, M., Poulin, C., Donato, A., 2005. Motor vehicle collision risk and driving under the influence of cannabis: evidence from adolescents in Atlantic Canada. Accident Analysis and Prevention 37, 1025–1034.
Begg, D.J., Langley, J.D., Stephenson, S., 2003. Identifying factors that predict per-sistent driving after drinking, unsafe driving after drinking, and driving after using cannabis among young adults. Accident Analysis and Prevention 35, 669– 675.
Committee on Injury, Violence, and Poison Prevention, American Academy of Pedi-atrics; Committee on Adolescence, American Academy of Pediatrics, Weiss, J.C., 2006. The teen driver. Pediatrics 118, 2570–2581.
Elder, R.W., Nichols, J.L., Shults, R.A., Sleet, D.A., Barrios, L.C., Compton, R., 2005. Task Force on Community Preventive Services. Effectiveness of school-based programs for reducing drinking and driving and riding with drinking drivers: a systematic review. American Journal of Preventive Medicine 28 (5 Suppl.), 288–304.
European Commission, 2001. White Paper European Transport Policy for 2010: time to decide. Office for Official Publications of the European Communities, Luxem-bourg.
European Monitoring Centre for Drugs and Drug Addiction (EMCDDA), 2007. Drugs and Driving. Office for Official Publications of the European Communities, Lux-embourg.
Fischer, B., Rodopoulos, J., Rehm, J., Ivsins, A., 2006. Toking and driving: charac-teristics of Canadian university students who drive after cannabis use – and exploratory pilot study. Drugs: Education, Prevention & Policy 13, 179–187. Furr-Holden, D., Voas, R.B., Kelley-Baker, T., Millar, B., 2006. Drug and
alcohol-impaired driving among electronic music dance event attendees. Drug and Alcohol Dependence 85, 83–86.
Jones, C., Donnelly, N., Swift, W., Weatherburn, D., 2006. Preventing cannabis users from driving under the influence of cannabis. Accident Analysis and Prevention 38, 854–861.
Jones, C., Swift, W., Donnelly, N.J., Weatherburn, D.J., 2007. Correlates of driv-ing under the influence of cannabis. Drug and Alcohol Dependence 88, 83– 86.
Langford, J., Methorst, R., Hakamies-Blomqvist, L., 2006. Older drivers do not have a high crash risk – a replication of low mileage bias. Accident Analysis and Prevention 38, 574–578.
Laumon, B., Gadegbeku, B., Martin, J.L., Biecheler, M.B., 2005. Cannabis intoxication and fatal road crashes in France: population based case-control study. British Medical Journal 331, 1371–1376.
Midanik, L.T., Tam, T.W., Weisner, C., 2007. Concurrent and simultaneous drugs and alcohol use: results of the 2000 national alcohol survey. Drug and Alcohol Dependence 90, 72–80.
Mura, P., Chatelain, C., Dumestre, V., Gaulier, J.M., Ghysel, M.H., Lacroix, C., Kergueris, M.F., Lhermitte, M., Moulsma, M., Pépin, G., Vincent, F., Kintz, P., 2006. Use of drugs of abuse in less than 30-year-old drivers killed in a road crash in France: a spectacular increase for cannabis, cocaine and amphetamines. Forensic Science International 160, 168–172.
Raes, E., Verstraete, A.G., 2006. Cannabis and driving: the situation in Europe. Annales Pharmaceutiques Franc¸aises 64, 197–203.
Ramaekers, J.G., Berghaus, G., Van Laar, M., Drummer, O.H., 2004. Dose related risk of motor vehicle crashes after cannabis use. Drug and Alcohol Dependence 73, 109–111.
Ramaekers, J.G., Moeller, M.R., Van Ruitenbeek, P., Theunissen, E.L., Schneider, E., Kauert, G., 2006. Cognition and motor control as a function of Delta (9)-THC concentration in serum and oral fluid: limits of impairment. Drug and Alcohol Dependence 85, 114–122.
Richer, I., Bergeron, J., 2009. Driving under the influence of cannabis: links with dan-gerous driving, psychological predictors, and accident involvement. Accident Analysis and Prevention 41, 299–307.
Sabel, J.C., Bensley, L.S., Van Eenwyk, J., 2004. Associations between adolescent drink-ing and drivdrink-ing involvement and self-reported risk and protective factors in students in public schools in Washington State. Journal of Studies on Alcohol 65, 213–216.
Terry, P., Wright, K.A., 2005. Self-reported driving behaviour and attitudes towards driving under the influence of cannabis among three different user groups in England. Addictive Behaviors 30, 619–626.
Walsh, G.W., Mann, R.E., 1999. On the high road: driving under the influence of cannabis in Ontario. Canadian Journal of Public Health 90, 260–263.