Documentos de Trabajo
14 14
Documentos
de Trabajo
2012Plaza de San Nicolás, 4 48005 Bilbao
España
Tel.: +34 94 487 52 52 Fax: +34 94 424 46 21 Paseo de Recoletos, 10 28001 Madrid
España
Tel.: +34 91 374 54 00 Fax: +34 91 374 85 22 [email protected] www.fbbva.es
Jesús Peiró Palomino Emili Tortosa-Ausina
Social Capital, Investment
and Economic Growth
Evidence for Spanish Provinces
Evidence for Spanish Provinces
Jesús Peiró Palomino
1Emili Tortosa-Ausina
1,21 U N I V E R S I T Y J A U M E I
2 T H E VA L E N C I A N I N S T I T U T E O F E C O N O M I C R E S E A R C H ( I v i e )
Abstract
This working paper analyzes the impact of social capital on economic growth in Spain during the 1985-2005 pe- riod. The literature in this context is virtually nonexistent and, in addition, whereas most studies, regardless of their context, have used survey data in order to measure social capital, we use a measure whose construction is based on similar criteria to other measures of capital stock. In ad- dition, compared with more standard measures of social capital and trust, the measure we use is available with a high level of disaggregation, and with annual frequency for a long time period. Following a panel data approach, our findings indicate that social capital has a positive im- pact on GDP per capita growth in the context of Span- ish provinces, implying that social features are important for explaining the differences in wealth observable across Spanish provinces. Following some recent contributions, we also explore the transmission mechanisms from social capital to growth, finding a highly positive relation be- tween social capital and private physical investment.
Key words
Growth, physical capital investment, province, social capital.
Resumen
Este documento de trabajo analiza el impacto del capital social en el crecimiento económico español durante el pe- ríodo 1985-2005. Los trabajos en este contexto son prácti- camente inexistentes y, mientras que la mayoría de los es- tudios, independientemente de su contexto, han usado datos procedentes de encuestas para medir el capital social, en este documento se emplea una medida cuya construcción está basada en criterios similares a otras aplicadas en stock de capital. Además, en comparación con otras medidas más es- tándares de capital social y confianza, la aquí empleada está disponible con un alto nivel de desagregación, y con perio- dicidad anual para un largo período temporal. Siguiendo una aproximación de datos de panel, los resultados indican que el capital social impacta positivamente en el crecimiento eco- nómico en el contexto de las provincias españolas, eviden- ciando que las características sociales importan para expli- car las diferencias en términos de riqueza observables entre las provincias españolas. Siguiendo recientes contribuciones, se explora además los mecanismos de transmisión del capital social hacia el crecimiento, encontrando una fuerte relación positiva entre el capital social y la inversión física privada.
Palabras clave
Crecimiento, inversión física privada, provincia, capital social.
autores.
The BBVA Foundation’s decision to publish this working paper does not imply any responsibility for its contents, or for the inclusion therein of any supplementary documents or information facilitated by the authors.
La serie Documentos de Trabajo tiene como objetivo la rápida difusión de los resultados del trabajo de investigación entre los especialistas de esa área, para promover así el intercambio de ideas y el debate académico. Cualquier comentario sobre sus contenidos será bien recibido y debe hacerse llegar directamente a los autores, cuyos datos de contacto aparecen en la Nota sobre los autores.
The Working Papers series is intended to disseminate research findings rapidly among specialists in the field concerned, in order to encourage the exchange of ideas and academic debate. Comments on this paper would be welcome and should be sent direct to the authors at the addresses provided in the About the authors section.
Versión: Abril 2012
© los autores, 2012
© de esta edición / of this edition: Fundación BBVA, 2012
EDITA/ PUBLISHED BY
Fundación BBVA, 2012
Plaza de San Nicolás, 4. 48005 Bilbao
La serie Documentos de Trabajo, así como información sobre otras publicaciones de la Fundación BBVA, pueden consultarse en:
http://www.fbbva.es
The Working Papers series, as well as information on other BBVA Foundation publications, can be found at:http://www.fbbva.es
autores.
The BBVA Foundation’s decision to publish this working paper does not im- ply any responsibility for its contents, or for the inclusion therein of any supplementary documents or information facilitated by the authors.
La serie Documentos de Trabajo tiene como objetivo la rápida difusión de los resultados del trabajo de investigación entre los especialistas de esa área, para promover así el intercambio de ideas y el debate académico. Cualquier comentario sobre sus contenidos será bien recibido y debe hacerse llegar directamente a los autores, cuyos datos de contacto aparecen en la Nota sobre los autores.
The Working Papers series is intended to disseminate research findings rapidly among specialists in the field concerned, in order to encourage the exchange of ideas and academic debate. Comments on this paper would be welcome and should be sent direct to the authors at the addresses provided in the About the authors section.
Versión: Septiembre 2012
© Jesús Peiró Palomino and Emili Tortosa-Ausina, 2012
© de esta edición / of this edition: Fundación BBVA, 2012
edita / publishedby Fundación BBVA, 2012
Plaza de San Nicolás, 4. 48005 Bilbao
3
1. Introduction
TRADITIONALLY, economic growth has been one of the topics that has attracted most interest in the economic literature. The first steps in the question are attributed to Solow (1957), who proposed a model that included physical capital investment, labor and technological change.
Subsequently, the economic growth literature has considered a large set of potential explana- tory variables of a different nature, such as human capital or regional, political, religious and social variables. However, despite considerable efforts to determine what the robust factors behind the economic growth really are (Levine and Renelt 1992; Sala-i-Martin 1997; Crespo et al. 2011), no consensus has yet been reached.
In the last few years, several studies on this issue have considered a new variable: social capital, which was popularized in sociology by Coleman (1988)—although Loury (1977) had introduced it into modern social science research some years before. As Durlauf and Fafchamps (2005) noted, one may think of social capital as the informal forms of institutions and organiza- tions that are based on the social relationships, networks, and associations that create shared knowledge, mutual trust, social norms, and unwritten rules. Therefore, in the particular con- text of growth empirics, on which we focus, the analyst would be confronted with evaluating whether social features such as trust, associationism, social participation, or public-spiritedness influence the economic performance of one country or region, and how important this social component might be.
However, despite the growing importance of these issues, scholars face two impor- tant problems. The first one is what some authors refer to as the vagueness of the concept (Torsvik 2000). Social capital is characterized by its interdisciplinary nature and, although this might be a priori good, in practical terms it impedes a consensus about the impact of social capital—both where and how it truly impacts. The second problem scholars face when approaching the concept, and perhaps the most relevant from the point of view of measuring how it affects growth, is that data on social capital are relatively scarce and the data provided by different institutions usually carry different meanings—and, therefore, the implications for growth may also vary from one measure to the other. As we will see throughout the study, this will ultimately be the main reason for considering a social capital measure which has been constructed with similar underpinnings to those used for building other databases such as physical or human capital.
Within the particular discipline of economics, over the last few years some studies have analyzed how social capital affects different dimensions of economic activity in different countries and regions, finding positive links between trust and economic growth, and using social capital data provided by The World Values Survey (WVS) and The European Values Survey (EVS)1. In this line of research the number of contributions is already substantial. Al- though perhaps the most prominent studies were those by Knack and Keefer (1997) and Temple and Johnson (1998), which found a positive correlation between social capital and economic growth, other salient contributions have been made, such as those by Portela and Neira (2002) or Schneider et al. (2000), among others, who also focus on cross-country studies. More recent- ly, some studies have focused on regional levels such as Beugelsdijk and Van Schaik (2005), who consider a sample of 54 European regions.
Some of the studies cited above report interesting conclusions contributing to the un- derstanding of why some countries, or regions, are systematically richer than others in terms of GDP per capita. In the particular case of Spain, on which we focus, Pérez García (2007) concluded that all provinces experienced intense economic growth during the 1955-2005 pe- riod. However, there is a broad consensus among scholars who have studied the Spanish case that the process of regional convergence in GDP per capita slowed down in the 1980s, whereas labor productivity followed a convergent path (see, for instance, Raymond and García Greciano 1994; Maudos et al. 1998; Goerlich and Mas 2001; Goerlich et al. 2002).
Nevertheless, this literature seems to have fallen into a period of stagnation. Whereas it is true that contributions on the matter are growing (Castro 2007; Peña 2008; Pons and Tirado 2008; Peña 2011; Escribá and Murgui 2011), these studies confirm previous results using more sophisticated techniques, but they do not offer additional evidence on the factors behind the disparities apart from the traditional and well-known private and public capital, human capi- tal or productivity. Studies such as De la Fuente (2003) and Martín Mayoral and Garcimartín (2009) recognize the influence of additional factors and highlight the need to study the “black box”, or Solow’s residual of the Neoclassical model that might hide factors such as business climate or the institutions effect affecting growth profiles. We hold that social capital could be one important variable embedded in that residual.
1 More detailed information on these databases and the information used in the studies in section 2.2.
5
There are powerful additional arguments supporting the use of social capital. Pérez García (2007), determined that persistent disparities are a consequence of the distinct abili- ties of provinces to attract economic activity. In that sense, studies such as Becattini (1979), or Trigilia (2005), concluded that the existence of social capital in a given territory is one of the key factors for attracting new activity and boosting local development. Furthermore, the presence of social capital in one territory can also trigger off the generation of other types of capital, such as human or physical capital (Dearmon and Grier 2011). In this sense, it is well- known that the availability of credit is crucial to impel physical capital formation, and the relationship banking literature corroborates, in light of some recent contributions, that social capital has a major effect on credit decisions (Guiso et al. 2004; Pérez García et al. 2006).
In our particular case, since economic development in Spain has been accompanied by high levels of physical investment (Pérez García 2007), we go further and analyze the importance of social capital as a driver of physical capital formation in the Spanish provinces, and also distinguish between total investment and non-residential investment.
Therefore, the main objective of this study is to contribute to the understanding of how social capital has affected the growth profiles of Spanish provinces over the last two dec- ades. To this end, we will proceed in two steps. First, we will consider a variant of Mankiw et al.’s (1992) model of economic growth, in which social capital is included. This will tie in with previous contributions that analyze the direct link between trust and social capital, and economic development. However, in a second step, we will also consider recent contributions by Dearmon and Grier (2009, 2011), who advocate digging more deeply into the relationship between trust and the accumulation of human and physical capital, since the link between trust and economic development could be more involved—or indirect. In addition, we will follow a panel data approach which, as stated by Dearmon and Grier (2009), is very unusual, given the general unavailability of data on trust and social capital for long periods and large cross sections of countries or regions. We are able to do this thanks to a relatively new and unique dataset, provided by the BBVA Foundation and the Valencian Institute of Economic Research (Ivie), which provides this information for a period of over twenty years, and not only for Spanish regions and provinces but also for a large number of countries.
The empirical evidence on these issues in the case of Spanish regional growth is scant. We find that studies generally offer two different levels of disaggregation, namely, regions or comunidades autónomas, and provinces, or provincias. They correspond to NUTS
levels 2 and 3, respectively, in European terminology. In the particular case of Spain, apart from corresponding to two different levels of territorial organization and, therefore, being nested (each region contains one or more provinces), they differ remarkably in terms of powers, since both health and education competencies have been transferred to the regions.
However, there are notable differences in the size of the population living in each province—
for instance, the province of Madrid has more than 6 million inhabitants as of 2011, whereas those living in Soria are fewer than 100,000. Therefore, the analysis is relevant both for re- gions (given how important they are in terms of powers and, therefore, how responsible they might be for the levels of public deficit) and provinces (given the remarkable disparities in terms of population, which has a major implication when the analyst considers the wealth of all inhabitants in the country). Although many studies confine their analysis to the regional level, since the number of provinces (50) is much higher than the number of regions (17), and we have information for all variables at the provincial level, we consider it is far more informative to conduct the analysis at this level of disaggregation.
This paper is structured as follows. In section 2 we present a brief review of the litera- ture on social capital and its measurement. In section 3 we document some of the advantages of using Pérez García et al.’s (2005) model of social capital generation and accumulation. Section 4 presents the models to be estimated and in section 5 some descriptive statistics are reported.
Results are presented in section 6 and, finally, section 7 provides some conclusions. Appendix A (section 8) gives more details on the social capital measure used and Appendix B (section 9) provides a description of the variables employed.
2. A Brief Review of the Social Capital Literature
2.1. Two different approaches to the same concept
The concept of social capital can be examined from different perspectives. A great number of contributions deal with the concept itself and its impact on a variety of fields. It is widely accepted among scholars that social capital contributes to reducing transaction costs and positively affects economic development, among other beneficial effects. To date, however there is no agreement as to which definition, approach or methodology is the most appropriate to determine its effects.
7
Robert Putnam, in his seminal study Making Democracy Work (1993), analyzed the effect of social capital in explaining the differences in economic development and institutional performance in the Northern and Southern regions of Italy. His main conclusion was that so- cial capital partly explains the large differences between the North and South of Italy in terms of institutional performance and economic development. Other authors have tested whether Putnam’s results can be generalized using a sample of countries (Schneider et al. 2000), finding some conflicting results.
We can find two distinct views to explain the origins of social capital. Jackman and Miller (1998), compiled and discussed the various social capital approaches. They argued that the pioneering social capital studies employed an endogenous approach to the concept. That view implies that social capital is born inside individuals and organizations. Where A and B are two representative individuals in one specific society, Coleman (1988) defined trust as the expectation created in A of being returned by B when A does something for B. This would imply that a stock of social capital in a given society can be created by the accumulation of reciprocal trust relationships. Coleman (1988) also argued that information is needed to provide a basis for trusting others2. Another relevant factor is the penalties imposed if one individual acts in opportunistic way3. Opportunistic behavior may imply exclusion and the prevention from par- ticipating in the aggregated benefits that social capital provides4. Thus, trust in the long term is also viewed as an instrument to achieve a cooperative solution in the context of the Prisoner’s Dilemma (Torsvik 2000)5.
In contrast, the exogenous view of the concept, stresses that social capital is not a personal cooperative decision but a structural element of the society created by a confluence of certain cultural values, religion, political system, past and current institutions and social
2 In a society with accurate and clear information, making decisions is easier and more secure because individuals can check all the important variables they need to make a decision.
3 The nature of these penalties may be formal (laws and regulations) or informal (social cost imposed on opportunistic actors). The latter one would be closely related to social capital.
4 Exclusion has a damaging effect not only on the excluded but on the society as a hole.
5 In the classic iterated Prisioner’s Dilemma game, participants cooperate because they know that long- term benefits of cooperation are higher than short-term benefits derived from deviations from the coop- erative solution. The nature and the mechanisms of the endogenous view are very close to this theory.
structure. Whereas the above-mentioned views are incompatible for some authors like Jackman and Miller (1998), others do not make that distinction, combining different endogenous and exogenous aspects. These include, Knack and Keefer (1995, 1997), Keefer and Knack (1997, 2002), Putnam (1995), Helliwell and Putnam (1995), Akçomak and Ter Weel (2009), La Porta et al. (1997), Fukuyama (1995), or Granato et al. (1996a).
Within the exogenous view, other authors focus on social capital as a result of political regimes and policies (Granato et al. 1996b; Paldam and Svendsen 2000; Torcal and Montero 2000; Rose 2000; Paxton 2002)6, as well as on the implications of social capital for the credit market. Guiso et al. (2004) are one of the maximum exponents7.
The preceding paragraphs have focused on the different views of social capital and the fields where its positive effects have been demonstrated. Nevertheless, in order to understand how social capital spreads inside a society we need be aware of a key concept: the network, the role of which has been emphasized (Coleman 1988; Woolcock and Narayan 2000; Paldam and Svendsen 2000; Paxton 2002; Torsvik 2000). The network is understood as the relation- ships and ties between members of a society and is the instrument which enables the diffusion of social capital. If individuals in a society are rich in terms of social capital but the network is not wide enough, the positive effects that social capital provides will not be achieved. Accord- ing to Pérez García et al. (2005), high trust societies are characterized by a high-density, well connected network8.
The above overview has shown that there is no consensus on how social capital should be understood. Only one thing seems clear: regardless of the approach followed, either endog- enous or exogenous, in those areas where social capital is abundant, contracts and agreements may be enforced with lower transaction costs. However, in spite of the advances in the knowl- edge on this issue, more evidence on the effects of social capital is needed —at least from the point of view of some disciplines such as economics.
6 The general conclusion is that democracy and social capital are highly correlated and that communist societies are detrimental to the generation of social capital.
7 The authors concluded that in countries or regions with high social capital endowments, their inhabit- ants can gain better access to credit since there is an increase in the number of credit instruments used.
8 Societies with isolated groups may be detrimental to the creation of a social capital stock (Paxton 2002).
9
Yet this is not an easy task, since the analysts are firstly confronted with the difficul- ties of quantifying social capital itself. Accordingly, in recent years there has been a growing academic interest in determining and quantifying how important social capital is in order to achieve certain levels of economic development.
2.2. Measuring social capital
From the previous section it may be easily inferred that one of the major problems in the study of social capital is its measurement. Two of the measures traditionally used (Granato et al. 1996a; Knack and Keefer 1997; Zak and Knack 2001) are the trust and associational activity indicators contained in the World Values Survey (WVS)9 and in the European Values Survey (EVS)10 databases. Trust is measured using what scholars have referred to as the gener- ally speaking question. Specifically, the question asked by the WVS and the EVS is: ‘Generally speaking, would you say that most people can be trusted, or that you cannot be too careful in dealing with people?’, with two possible answers: ‘most people can be trusted’, or ‘can’t be too careful’. Both WVS and EVS also provide a membership association indicator.
Other measures have also been taken as proxies for social capital including political participation, institutional variables, confidence in government, compound civic indicators, as used by Knack and Keefer (1997), or different items or questionnaires used to measure spe- cific social capital levels in a particular region such as Narayan and Pritchett’s (1999) measure from The Social Capital and Poverty Survey Questionnaire, that tests the role of social capital viewed from a domestic perspective.
Unfortunately, the measures reviewed in the preceding paragraphs have certain disad- vantages which can jeopardize their use under some circumstances. First, they have a limited coverage both in terms of space (number of countries or regions included) and time (years in the sample). Second, in the particular case we are dealing with, in which we attempt to under- stand how social capital might have affected the wealth profiles of the fifty Spanish provinces, the measures reviewed above do not provide the required level of disaggregation (provinces,
9 See http://www.worldvaluessurvey.org.
10 See http://www.europeanvaluesstudy.eu.
NUTS 3 in European terminology, which would also include the autonomous cities of Ceuta and Melilla)11.
In order to expand both the space and time dimensions of our data we will consider a new measure of social capital constructed by the Ivie in collaboration with the BBVA Founda- tion. This measure is available not only for Spanish provinces and regions, but also for a large sample of countries and a long time span, and is updated on a regular basis. It has some addi- tional features that enhance its use in this particular setting. We summarize its main characteris- tics in the next section. This measure has already been used in recent studies applied to different contexts, but with aims related to those of the present study, such as Pastor and Tortosa-Ausina (2008) or Miguélez et al. (2011).
3. Using an Economic Approach to Social Capital
AS indicated above, an important branch of the literature has measured the impact of social capital on growth using proxies from surveys. In contrast to other measures of social capital such as those reviewed in the previous section, the measure we use is somewhat more sophis- ticated. This section explains the features that are most relevant to our study. Appendix A, in section 8, provides further technical details on the measure12.
As discussed previously, data from surveys provided by WVS or EVS are unavailable at a detailed level such as the Spanish provinces and for the analyzed time period13. In contrast to the surveys described above, the measure of social capital we use provides yearly data, ena- bling us to construct a balanced panel dataset, therefore, leading to sounder conclusions.
11 As indicated in the introduction, some studies such as Beugelsdijk and Van Schaik (2005) have ana- lyzed social capital issues for European regions; however, the level of disaggregation employed was far less detailed than that corresponding to Spanish NUTS 3.
12 However, all details on the measure we use are provided by its authors in (Pérez García et al. 2005) or, more concisely, in Pérez García et al. (2006).
13 Data are provided at country level, enabling a European regional disaggregation in EVS, although there is no data with a high enough level of disaggregation to study Spanish provinces during our refer- ence period. With respect to time periods, surveys are available for several years, but their frequency is by no means annual.
11
One of the most interesting features of the measure we use is that it deals with social capital as an asset in which to invest. Solow (2000) contested the idea that social capital may be one of the drivers of economic activity, partly because he did not accept that social capital could be considered as capital. Specifically, he claimed that the word capital is related to a stock of factors of production which are expected to yield productive services for a given period of time.
Dasgupta and Serageldin (2001) suggested the plausibility of the construction of an in- dex of aggregated social capital and highlighted the need for further research in that direction.
Meanwhile, Glaeser et al. (2000) stated that the traditional measures for social capital might not be the most appropriate in the particular field of economics. They developed a model of individual social capital accumulation, acknowledging the existence of difficulties in the ag- gregation at the society level. Therefore, this model cannot provide an answer when studying the differences among provinces, which are not individuals but communities of individuals and, consequently, aggregation becomes essential. In the same line, Durlauf (2002) criticized the lack of a theoretical framework for the determinants of social capital formation and accu- mulation and also pointed out the weakness of those studies which test the importance of social capital from a macroeconomic perspective.
The social capital measure we use provides an answer in this respect. The construction of the social capital accumulation model considered is based on similar ideas to those for mod- els of physical capital accumulation. This implies that social capital is understood as an addi- tional input in the production process, and a stock of social capital is available for each society, which depreciates over time like any other type of capital stock. Individuals invest in social capital because they expect future positive returns derived from that investment. Our approach considers that social capital provides services, and those services translate reduced transaction costs. That cost reduction represents the final benefits of investing in social capital.
Another advantage of this approach is the importance that the measure gives to the economic aspects in the generation of social capital, as opposed to other measures focusing on social and cultural characteristics. Our approach considers the economic relationships such as trade, employment, finance or income distribution as determinants of the incentives for invest- ing in social capital. Pérez García et al. (2005, 2006) claim that the cited economic variables have not been sufficiently considered by the social capital literature, and that their importance could have been underrated compared to other, more widely accepted, social or cultural vari-
ables. These authors also provide several explanations to justify the dominance of social vari- ables over economic variables in the measurement of social capital. The main conclusion they draw is that social capital generation cannot be exclusively confined to non-economic relation- ships, and that economic relationships must also be taken into account, especially when dealing with advanced economies with expectations of continuous progress —which is, precisely, the case of Spanish provinces.
The above arguments provide reasons to justify that our approach might be more ap- propriate in the specific context we are dealing with. This economic approach to measure social capital overcomes some of the biggest difficulties highlighted by the literature: the vagueness of the concept (Torsvik 2000), its measurement, the aggregation issues, the treatment of social capital as an asset in which to invest, and the consideration of economic variables in the social capital formation process. It can also offer additional insights in order to better understand the role of a concept characterized by a multifaceted perspective, and its use will allow for comparison with previous results from studies which have used more traditional measures, as described above.
4. Model Specification
4.1. Determinants of economic growth
Selecting the explanatory factors which determine economic growth is not an easy matter. As noted in the introduction, a vast number of contributions have focused on deter- mining the true determinants of economic growth (Brock and Durlauf 2001). The contribu- tions to this literature continue to growth in both quantity and quality, as demonstrated in other recent papers such as those by Durlauf et al. (2008), Ciccone and Jarocinski (2010), Henderson et al. (2012), or Moral (2012), to name a few. The number of theories put forth that attempt to explain economic growth is so large that they have led to an empirical co- nundrum known as theory open-endedness (Brock and Durlauf 2001), which suggests that, while several theories may explain the growth of an economy’s output, no particular theory can possibly rule out another theory as an authoritative predictor of cross-country growth (Henderson et al. 2012).
13
Few variables appear to be significant across studies. Among them, we can high- light three, namely, initial level of income, investment rate and human capital. However, one should also take into account that recent contributions in the field advocate using different techniques which do not focus on average effects, but rather allow for variation in the pa- rameter coefficients (Henderson et al., 2012). Yet studies based on linear specifications still dominate. Among them are the ‘Barro-type’ regressions (Barro 1991), including the three variables referred to above as well as a great number of regressors which are potential drivers of economic growth.
Sala-i-Martin (1997), in an effort to further investigate additional (more robust) vari- ables apart from those cited, considered a modified version of the extreme bounds test initially developed by Leamer (1985), concluding that a considerable set of variables could be used as robust growth determinants14. Unfortunately, a measure of social capital was neither included in this robustness analysis nor in the majority of studies on the determinants of economic growth, partly because most of the studies incorporating social capital are relatively recent and the data on social capital have some availability limitations.
Our study is based on Mankiw et al. (1992) (henceforth MRW), which is one of the most widely-accepted models in the economic growth literature. One of the reasons is that when studying regions within a country instead of countries, some widely used variables in
‘Barro-type’ regressions such as political, religious, or cultural variables are quite homogene- ous and it is difficult to draw sensible conclusions which could explain economic growth dis- parities. The MRW model is simpler in that sense. It is an extension of Solow’s basic model, including human capital as an additional regressor, so that the final list of regressors comprises the initial level of income, population growth, physical capital investment and human capital.
We add to these variables our variable of interest, namely, social capital.
Following MRW, the economic growth will be estimated using a model such as:
Documento de Trabajo – Núm. 13/2012
14
determinants of economic growth, partly because most of the studies incorporating social capital are relatively recent and the data on social capital have some availability limitations.
Our study is based on Mankiw et al. (1992) (henceforth MRW), which is one of the most widely-accepted models in the economic growth literature. One of the reasons is that when studying regions within a country instead of countries, some widely used variables in
‘Barro-type’ regressions such as political, religious, or cultural variables are quite homogeneous and it is difficult to draw sensible conclusions which could explain economic growth disparities. The MRW model is simpler in that sense. It is an extension of Solow’s basic model, including human capital as an additional regressor, so that the final list of regressors comprises the initial level of income, population growth, physical capital investment and human capital. We add to these variables our variable of interest, namely, social capital.
Following MRW, the economic growth will be estimated using a model such as:
µ β
β β
β β
β
α
+ GDP + NGS+ PRPK+ PLPK+ HK+ SK+GGDP= 1 0 2 3 4 5 6 (1)
where the dependent variable is economic growth (GGDP), measured as the difference of real income per capita logarithm between the end and the beginning of the period. The explanatory variables are: (i) the initial level of real income per capita (GDP0); (ii) population growth (NGS), corresponding to the growth population rate plus a fixed coefficient equal to 0.0515; (iii) private (PRPK) and public (PLPK) physical capital investment, as a percentage of GDP16 and (iv) human capital (HK), which is measured in terms of number of years in education of the working population.17
15 In contrast to MRW and, in line with Islam (1995), we take the total population growth instead of the working population growth. The coefficient 0.05 represents technological growth and depreciation rate and its value is the used in the MRW model, commonly accepted in the literature.
16 In MWR, both variables are considered together but we prefer a separate inclusion because there is no con- sensus on the role of public investment among the studies. Separate inclusion, which will allow for comparison, is therefore and interesting alternative.
17 This variable differs from the original MRW model, which measured human capital taking the rate of work- ing age population with secondary school studies. Nevertheless, this variable is not free of criticism, (see Islam (1995) for a complete discussion of this matter) and, therefore, we proxy human capital with the years of educa- tion.
(1)
14 Specifically, along with the three cited variables, Sala-i-Martin (1997) found nine different groups of robust variables: regional variables, political variables, religious variables, types of investment, primary sector production, trade openness, types of economic organization and former Spanish Colonies.
where the dependent variable is economic growth (GGDP), measured as the difference of real income per capita logarithm between the end and the beginning of the period. The explana- tory variables are: (i) the initial level of real income per capita (GDP0); (ii) population growth (NGS), corresponding to the growth population rate plus a fixed coefficient equal to 0.0515; (iii) private (PRPK) and public (PLPK) physical capital investment, as a percentage of GDP16 and (iv) human capital (HK), which is measured in terms of number of years in education of the working population17.
These variables make up the MRW framework. We also factor in social capital per capita (SK)18. A full description of the variables and sources is provided in Appendix B (sec- tion 9).
4.2. Determinants of investment
In the second stage of the study we test the impact of our social capital measure on private physical capital investment. This additional study is justified in the light of some recent contributions, which consider that the impact of social capital on growth might be channeled through other factors. For instance, Akçomak and Ter Weel (2009) or Miguélez et al. (2011)19, found evidence in favor of positive links from social capital to innovation. Closer to this section of the paper, Knack and Keefer (1997), Zak and Knack (2001) and recently, Dearmon and Grier
15 In contrast to MRW and, in line with Islam (1995), we take the total population growth instead of the working population growth. The coefficient 0.05 represents technological growth and depreciation rate and its value is the used in the MRW model, commonly accepted in the literature.
16 In MWR, both variables are considered together but we prefer a separate inclusion because there is no consensus on the role of public investment among the studies. Separate inclusion, which will allow for comparison, is therefore and interesting alternative.
17 This variable differs from the original MRW model, which measured human capital taking the rate of working age population with secondary school studies. Nevertheless, this variable is not free of criticism, (see Islam (1995) for a complete discussion of this matter) and, therefore, we proxy human capital with the years of education.
18 As previously commented on section 3, the Ivie social capital index is an aggregation of individuals’
social capital, so we must take average per capita values in order to control for the population factor.
19 This study focuses on Spanish regions (NUTS 2) and uses social capital data provided by the BBVA Foundation and the Ivie.
15
(2011), showed a positive impact of social capital on physical investment, highlighting that investment processes need trust and, consequently, social capital is a relevant element in the investment decision. In this part of the paper we analyze which elements are driving the invest- ment in the Spanish provinces and if social capital plays an important role in this concern.
Once more, there is no agreement as to what the determinants of this type of invest- ment really are, as manifested by Temple (1999). Authors studying this matter have weighed in different explanatory variables. Studies such as those by Knack and Keefer (1997) or Zak and Knack (2001), consider the price of investment goods, which is, a priori, one of the po- tential drivers of investment. However, the consensus on this matter is not widespread and other recent contributions such as Dearmon and Grier (2011) do not consider this variable, but incorporate other macroeconomic indicators which capture the investment environment in a certain period such as lagged inflation, lagged government spending as a percentage of GDP and lagged GDP growth, along with a human capital indicator, for which it is argued that some spillover effects that can affect investment may be present. We estimate a very similar model for our sample of Spanish provinces, although with some differences that will be explained in the ensuing paragraphs.
Specifically, in the case analyzed here the dependent variable is the private physical capital investment as a percentage of GDP (PRPK) and the explanatory variables are: (i) the real interest rate (R)20; (ii) lagged GDP growth (GGDP-1); (iii) lagged inflation (INF-1); (iv) lagged public investment as a percentage of GDP (PLPK-1) and (v) human capital (HK). To Dearmon and Grier’s basic framework we add social capital per capita (SK) as an additional regressor21.
In addition, due to the large impact of the construction sector in Spain during some years of the analyzed period, which is partly responsible for the current crisis affecting the country, we also use the dependent variable of the private physical investment minus the
20 This variable is not included in Dearmon and Grier (2011) but we have considered it as relevant in the investment decision in line with Knack and Keefer (1997) and Zak and Knack (2001).
21 Dearmon and Grier (2011) incorporate a social capital measure provided by WVS. They also include variables such as openness or trade liberalization, but we have not considered them because the informa- tion used in their construction is more addressed to countries instead of regions inside a single country, the case dealt with here. A description of how exactly these variables are constructed can be found in their paper.
16
amount corresponding to the residential investment (PRPKNR). Figure 1 shows how in prov- inces such as Málaga (in the region of Andalusia), Alacant (in the region of Valencian Com- munity), and Illes Balears (which is a region, the Balearic Islands, consisting of a single province), the residential component is around the 50% of total private physical investment.
To our knowledge, there is virtually no literature on the role of social capital in investment subtracting this residential component. We consider this a valid strategy in the specific case of Spain, where this separate analysis is essential. The reason is that the construction bubble, which burst around 2008, shortly after the US subprime crisis, had started in the mid-nineties, after the 1993-94 economic crisis. Therefore, a large part of the analyzed period is affected by these events. If social capital is one of the determinants of investment, it could be of in- terest to determine whether its effects remain significant when the residential component is removed, and how important the possible differences might be.
figure1: Investment components by province. Mean values, 1985-2005
Documento de Trabajo – Núm. 13/2012
FIGURE 1: Investment components by province. Mean values, 1985-2005
Therefore, we estimate two models, the only difference being the dependent variable. In the first one, the dependent variable is the total private physical capital investment, whereas in the second it is non-residential private physical capital investment.
A complete description of the variables and their sources can be found in Appendix B (sec- tion 9). The models are:
µ β
β β
β β
β
α
+ R+ GGDP− + INF− + PLPK− + HK+ SK+PRPK= 1 2 1 3 1 4 1 5 6 (2)
µ β
β β
β β
β
α
+ R+ GGDP− + INF− + PLPK− + HK+ SK+PRPKNR= 1 2 1 3 1 4 1 5 6 (3)
17
Documento de Trabajo – Núm. 14/2012
Therefore, we estimate two models, the only difference being the dependent vari- able. In the first one, the dependent variable is the total private physical capital investment, whereas in the second it is non-residential private physical capital investment. A complete description of the variables and their sources can be found in Appendix B (section 9). The models are:
17
FIGURE 1: Investment components by province. Mean values, 1985-2005
Therefore, we estimate two models, the only difference being the dependent variable. In the first one, the dependent variable is the total private physical capital investment, whereas in the second it is non-residential private physical capital investment.
A complete description of the variables and their sources can be found in Appendix B (sec- tion 9). The models are:
µ β
β β
β β
β
α
+ R+ GGDP− + INF− + PLPK− + HK+ SK+PRPK= 1 2 1 3 1 4 1 5 6 (2)
µ β
β β
β β
β
α
+ R+ GGDP− + INF− + PLPK− + HK+ SK+PRPKNR= 1 2 1 3 1 4 1 5 6 (3)
(2)
17
FIGURE 1: Investment components by province. Mean values, 1985-2005
Therefore, we estimate two models, the only difference being the dependent variable. In the first one, the dependent variable is the total private physical capital investment, whereas in the second it is non-residential private physical capital investment.
A complete description of the variables and their sources can be found in Appendix B (sec- tion 9). The models are:
µ β
β β
β β
β
α
+ R+ GGDP− + INF− + PLPK− + HK+ SK+PRPK= 1 2 1 3 1 4 1 5 6 (2)
µ β
β β
β β
β
α
+ R+ GGDP− + INF− + PLPK− + HK+ SK+PRPKNR= 1 2 1 3 1 4 1 5 6 (3)(3)
5. Data and Descriptive Statistics
BEFORE reporting the estimation results of the previous models, in this section we carry out a brief descriptive analysis of our data. Table 1 reports some basic data for the Spanish territorial units. The first column of the table displays the different comunidades autónomas (NUTS 2) and in the adjacent column, the provincias (NUTS 3), into which each comunidad autónoma is subdivided. The subsequent columns show some important variables at the beginning (1985) and the end (2005) of the studied period, enabling a better knowledge of the differences across provinces, and showing quite large disparities in some cases22.
As noted in section 4.2, figure 1 depicts the decomposition of investment in its residen- tial and non-residential components, and provides some rationale as to the importance of the double analysis developed, due to the relevancy of the non-residential component in most of the provinces.
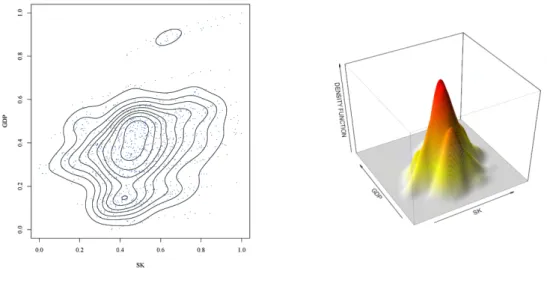
Figures 2, 3 and 4 plot bivariate densities, estimated using nonparametric kernel smooth- ing, which is a popular tool for visualizing the distribution of data (see, for instance Silverman
22 Note that the variables physical capital investment (total and non-residential) and public investment are provided in monetary terms instead of rates, as in the regression analysis. We prefer this option for the table because it allows for a better comparison of the magnitudes across provinces.
1986)23. All values have been 0-1 scaled, to ease comparisons. In the first case, when we jointly evaluate GDP per capita and social capital per capita, a positive relationship emerges. A remarkable amount of probability mass clusters along the 45-degree line, making this a high- density area and, pointing to positive relationship between GDP per capita and social capital per capita. We also found an isolated high-density area for higher values of GDP per capita, which corroborates this result for the richest provinces. Figures corresponding to investment, both total and non-residential, show a very similar pattern. A positive correlation and high den- sities around the mean appear for both cases. However, in this case, isolated high-density areas are not apparent.
We also provide maps in order to better understand how variables are distributed across Spanish provinces. Map 1 reveals that this is actually the case, as significant dispari- ties exist within the Spanish territory. In 1985, the Mediterranean coastal regions, compris- ing some provinces of Catalonia (Tarragona, Barcelona and Girona), Valencian Community (especially València and Alacant), Murcia, Balearic Islands, as well as Zaragoza in the region of Aragon, some of the Northern regions (A Coruña in the region of Galicia, the Basque Country and Asturias), Sevilla and Málaga in the region of Andalusia and Madrid, had the highest levels of GDP per capita, whereas the rest of the country had lower levels. The pattern differs slightly for 2005, but remarkable differences across provinces persist. Specifically, the wealthier regions are located in the North and the Northeast part of the country, with the exception of Madrid.
23 Specifically, they were estimated specifying a Gaussian kernel and the multivariate generalization of the plug-in bandwidth selector by Wand and Jones (1994), and implemented using the ks package for R (see Duong 2007).
Documento de Trabajo – Núm. 14/2012 19
table1: Descriptive statistics for Spanish provinces, 1985-2005
Documento de Trabajo – Núm. 1 19
TABLE1:Descriptive statistics for Spanish provinces, 1985-2005 RegionProvince GDP per capitaa Private physical capitalbPrivate physical capital (non-residential)bPublic investmentb Populatio 198520051985200519852005198520051985 AndalusiaAlmería7,550 15,330710,204 2,740,018 369,453 1,825,803 139,415 357,079 430,069 Cádiz 7,804 13,0101,365,110 4,532,782 703,085 3,023,796 274,546 763,525 1,034,533 Córdoba 7,043 11,070820,859 2,410,765 514,528 1,862,800 207,220 548,778 741,582 Granada 6,243 11,5901,245,980 3,078,974 602,352 1,998,060 327,410 533,311 776,907 Huelva 8,581 13,960612,504 2,272,457 301,740 1,506,026 110,460 311,578 429,582 Jaén6,949 10,550709,590 2,024,585 460,162 1,408,666 200,590 366,352 646,066 Málaga8,008 13,3902,229,009 7,541,517 868,325 4,014,079 374,068 925,160 1,072,204 Sevilla7,597 13,1601,954,017 6,702,257 1,037,225 4,888,329 435,952 835,515 1,542,752 AragonHuesca10,90516,810541,352 1,705,614 383,475 1,046,041 152,944 277,149 212,937 Teruel 10,47217,760359,153 967,757 269,409 815,867 90,669300,966 151,006 Zaragoza10,16818,4201,620,467 4,530,717 1,069,562 3,430,601 297,180 706,192 837,727 Asturias Asturias 8,973 14,7501,840,294 4,686,708 1,442,251 3,135,047 318,698 1,013,603 1,124,646 Balearic IslandsIlles Balears 13,32418,2801,032,476 5,926,796 650,902 3,713,662 245,533 828,264 665,580 Canary IslandsLas Palmas10,71815,8101,676,442 4,089,235 1,070,897 3,193,413 271,603 690,601 730,419 Sta. C. de Tenerife8,988 14,5901,756,380 5,512,771 1,074,423 3,367,001 262,561 653,286 685,354 CantabriaCantabria10,02716,3601,111,854 2,904,759 673,303 1,921,967 186,882 707,455 523,640 Castile and LeónÁvila7,539 13,440297,323 752,477 185,600 542,461 90,487151,371 181,565 Burgos11,90919,330891,089 2,246,669 530,420 1,441,889 115,957 361,784 361,872 León9,422 14,8901,421,383 2,096,107 914,184 1,840,156 195,393 584,490 531,887 Palencia9,764 16,720384,868 946,299 340,874 637,787 86,551190,924 190,306 Salamanca7,655 14,140621,404 1,512,273 507,488 901,996 164,953 341,011 366,367 Segovia 10,18917,460300,672 1,034,366 198,484 692,543 67,069266,586 149,749 Soria10,53616,230246,127 400,218 156,595 283,739 73,450123,413 99,281 Valladolid10,37218,100892,359 2,470,537 631,953 1,825,826 147,273 445,883 491,<