Unsupervised Feature Selection Method for Mixed Data
Saúl Solorio-Fernández, Ariel Carrasco-Ochoa
Technical Report No. CCC-19-005 November 2019
© Computer Science Department
INAOE
Luis Enrique Erro 1 Sta. Ma. Tonantzintla, 72840, Puebla, México.
Unsupervised Feature Selection Method for Mixed Data
Saúl Solorio Fernández Jesús Ariel Carrasco Ochoa Computer Science Department
National Institute of Astrophysics, Optics and Electronics
Luis Enrique Erro # 1, Santa María Tonantzintla, Puebla, 72840, México E-mail:{sausolofer,ariel}@inaoep.mx
Abstract
In recent years, unsupervised feature selection methods have attracted considerable interest in different areas; this is mainly due to their ability to identify and remove irrelevant and/or redundant features without needing a supervised dataset. However, most of these methods can only process numerical data; so in practical problems in areas such as medicine, economy, business, and social sciences, where it is common that objects are described by numerical and non-numerical features (mixed data), these methods cannot be directly applied. To overcome this limitation, in practice, it is common to apply an encoding method over non-numerical features. Nevertheless, in general, this approach is not a good choice, since by coding data we incorporate a notion of order into the feature values that does not necessarily correspond to the nature of the original dataset. Moreover, the permutation of codes for two values can lead to different distance values, and some mathematical operations do not make sense over the transformed data. For this reason, this Ph.D. research proposal focuses on developing a new unsupervised feature selection method for mixed datasets.
Keywords—Feature selection, Unsupervised feature selection, Mixed data
Contents
1 Introduction 4
2 Theoretical Basis 5
2.1 Unsupervised Feature Selection . . . 5
2.2 Clustering algorithms for mixed data . . . 8
2.3 Performance Evaluation. . . 10
3 Related Work 11 3.1 Filter approach . . . 11
3.2 Wrapper approach. . . 14
3.3 Hybrid approach . . . 15
3.4 Concluding remarks. . . 16
4 Justification and Motivation 17 5 Ph.D. Research Proposal 17 5.1 Problem to be solved . . . 17
5.2 Research questions . . . 17
5.3 Hypothesis . . . 17
5.4 Objectives . . . 18
5.5 Methodology . . . 18
5.6 Expected contributions . . . 20
5.7 Publication plan . . . 20
5.8 Schedule. . . 22
6 Preliminary Results 23 6.1 A new filter unsupervised spectral feature selection method for mixed data . . . 23
6.2 Experimental results . . . 26
6.3 Discussion. . . 40
7 Conclusions 41
1 Introduction
Feature selection [1–4] (also known as attribute selection) appears in different areas such as pattern recog- nition, machine learning, data mining and multivariate statistical analysis. In these areas often the objects1 of study may include in their description irrelevant and redundant features [5] that can significantly affect the analysis of the data, resulting in biased or even incorrect models [6]. Feature selection methods aim to select only those features that allow improving the classification results. Moreover, feature selection does not only reduce the dimensionality of the data; but it also leads to more compact models and possibly better generalization ability [7].
Over the last decades, many feature selection methods have been proposed, most of them for supervised problems [8–12]. However, there are many real applications where unsupervised problems arise (i.e., the objects are not labeled) [13,14], and supervised features selection methods cannot be applied. Under this context, unsupervised feature selection [15,16] has gained significant interest into the scientific community [17] since according to [1,18,19], unsupervised feature selection methods have two important advantages.
1) they are unbiased and perform well when prior knowledge is not available, and 2) they can reduce the risk of data over-fitting in contrast to supervised feature selection that may be unable to deal with a new class of data.
Several recent works [20–28] show that unsupervised feature selection is an active research area, with applications in genomic analysis [13,29,30], text mining [14,31,32], image retrieval [33–35], and intrusion detection [36,37], to name a few. However, most unsupervised feature selection methods developed so far, are exclusively for numerical data; therefore they are not directly applicable on datasets where the objects are described by both numerical and non-numerical features (mixed data). Mixed data [38,39] are very common, and they appear in many problems. For example, in biomedical and health-care applications [40–42], socioeconomics and business [38], software cost estimations [43], etc.
In practice, for applying unsupervised feature selection methods for numerical datasets over mixed data, is common to perform a previous process of data transformation. The process of transforming from a non- numerical feature to a numerical feature is called encoding, and there are several methods for achieving this, such as ordinal coding, one-hot, binary, polynomial, etc. [44–46]. All of them aim the same purpose; pro- viding a numerical meaning for non-numerical features in such a way they can be processed by algorithms developed to handle numerical data. However, whatever the encoding method used, this process has the following disadvantages:
1. Feature codification introduces an artificial order between features values, which does not necessarily correspond to the original nature of the dataset [44].
2. Different relative distances are introduced that may not match the essence of the data.
3. The permutation of codes for two non-numerical values can lead to different distance values [47].
4. Some mathematical operations such as addition and multiplication by a scalar do not make sense over the transformed data because they do not meet any algebraic, logical or topological supposition on themselves [48].
On the other hand, as we will see later in the related work section, there are some unsupervised fea- ture selection methods that perform an a priori discretization for transforming numerical features into non- numerical ones. Nevertheless, this discretization brings with it an inherent loss of information due to the
1Also called instances, records, observations or samples. Throughout this research proposal, we will refer to them as objects.
binning process [47], and the results of feature selection will highly depend on the applied discretization method. Additionally, it is known that some unsupervised discretization methods are sensitive to out- liers [49–51].
As far as we know, in the literature of unsupervised feature selection, only three works claim they can be applied over mixed datasets. These works will be discussed in detail in the related work section. However, it is important to highlight that two of them make feature transformation before performing feature selection.
Regarding the third one, the authors introduced a data clustering method, and during the clustering process, this method performs feature selection. Moreover, as we will explain later, this method requires the setting of several parameters, and it is computationally expensive.
In view of the above mentioned, in this Ph.D. research proposal the unsupervised feature selection prob- lem over mixed datasets is addressed, i.e., on datasets where the objects are described simultaneously by numerical and non-numerical features.
The rest of this document is organized as follows: In section2, theoretical basis about unsupervised fea- ture selection are given. Section3reviews the related work, and in section4, the justification and motivation for the development of this research are presented. The Ph.D. research proposal is presented in section5, in- cluding a description of the problem to be solved, research questions, hypothesis, objectives, methodology, expected contributions, publication plan and the schedule of activities. Preliminary results are presented in section6, and finally, in section7our conclusions are provided.
2 Theoretical Basis
In this section, the necessary background of the main topics required for understanding the contents of this research is presented. First, we define the unsupervised feature selection problem. Then, the main approaches in unsupervised feature selection are presented. After, a brief description of the most popular clustering algorithms for mixed data is given. Finally, we discuss the measures and strategies commonly used to assess unsupervised feature selection methods.
2.1 Unsupervised Feature Selection
In the supervised classification, feature selection methods maximize some objective function linked to class prediction. In this context, since class labels are available, it is natural to keep only the features that are related to or lead to these classes. However, in unsupervised classification, we are not given class labels, in fact, the goal is to find groups (also known as clusters). Therefore, the following questions arise:
which features should we keep? Why not use all the information that we have? The problem is that not all the features are important or relevant. Some of the features may be redundant, and some others may be irrelevant [5,16].
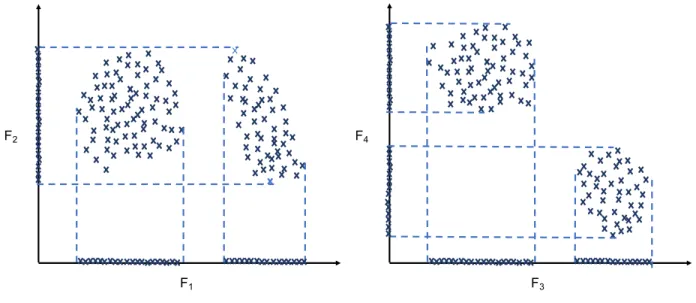
According to [4], a relevant feature (also known as a consistent feature) contains information about the objective concept2, and therefore, in unsupervised classification, it helps to find good cluster structures in the data. Conversely, an irrelevant feature does not allow to distinguish good cluster structures in the data.
To clarify this, in Figure1a an example of relevant and irrelevant features is shown. In this figure, we can see thatF1is a relevant feature because it can separate the data; as it can be seen when the data are projected to its respective axis. On the contrary,F2is an example of an irrelevant feature because it by itself is unable to separate the data, as we can see in its projection.
2In the case of unsupervised (clustering) tasks, this concept is closely linked to those features that reveal interesting and natural structures underlying the data [16].
On the other hand, a redundant feature refers to a feature that is relevant for discovering cluster structures in the data. But if it is removed from the data, it has not negative effect due to the existence of another feature (or set of features) that provides the same information (see Figure 1b). Redundant features unnecessarily increase the dimensionality, and therefore they can be removed [5]. Furthermore, it has been empirically shown that removing redundant features can result in significant performance improvement [9].
2.1.1 Formal problem statement
According to [52–54], a good feature selection method should select a subset of features that are not only individually relevant but also with low redundancy. Therefore, the unsupervised feature selection problem can be formulated as follows:
Given a collection ofmobjectsX ={x1,x2, . . . ,xm}, described by a set ofnfeaturesT = {F1, F2, . . . , Fn} possibly of different type (mixed data). Unsupervised feature selection consists in identifying a subset of featuresT0 ⊆ T, without using class label information, such thatT0 does not contain irrelevant and/or redundant features, and good cluster structures in the data can be obtained or discovered.
2.1.2 Approaches
Similar to feature selection for supervised classification, unsupervised feature selection methods can be categorized in three main approaches [55]: filter, wrapper, and hybrid.
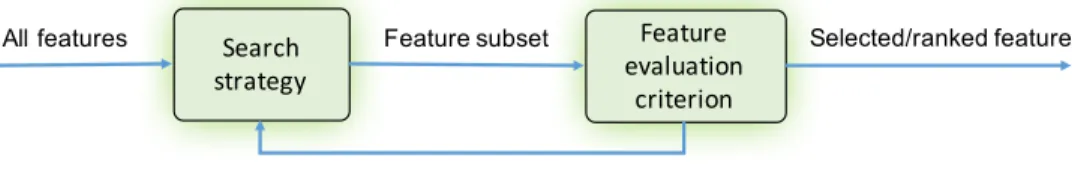
Methods based on the filter approach select features based only on the intrinsic properties of the data, such as the variance of features, similarity among features, consistency, entropy, etc. A typical filter method is composed by two components (see Figure2); a feature search strategy and a feature evaluation criterion.
In the feature search strategy, a feature subset is generated, and then, this is evaluated through some intrinsic quality measure. This process ends until some pre-established stop criterion is met. As it can be seen, these
F1 F2
(a) Relevant and irrelevant features
F3 F4
(b) Redundant features
Figure 1: Relevant, irrelevant and redundant features.
methods are very simple, and unlike methods based on the wrapper approach they do not need a clustering algorithm for finding relevant features; consequently they tend to be faster and scalable.
According to [55], filter methods can be classified as univariate and multivariate. Univariate methods evaluate each feature in order to get an ordered list (ranking). These methods can effectively identify and remove irrelevant features, but they are unable to remove redundant ones because they do not take into account possible dependencies between features. On the other hand, filter multivariate methods assume that the dependent features should be discarded, being the independent ones the most relevant. These later methods can handle redundant and irrelevant features.
Search strategy
Feature subset Feature evaluation
criterion All features
Criterion value
Selected/ranked features
Figure 2: Filter approach for unsupervised feature selection.
On the other hand, methods based on the wrapper approach evaluate feature subsets depending on their performance under a specific clustering algorithm. As it is shown in Figure3, a typical unsupervised feature selection method based on the wrapper approach consists of three basic components, namely, a search strategy, a clustering algorithm, and a feature evaluation criterion. In the first component, a candidate feature subset is generated based on a given search strategy, then in the second component, a clustering algorithm is applied to the data described by the candidate feature subset. In the final component, clusters are evaluated according to a feature evaluation criterion. The subset that best fits the evaluation criterion will be chosen from all the candidates that have been evaluated. These methods usually obtain good feature subsets. However, the main disadvantages of these methods are that they usually have a high computational cost, and they have to be applied in conjunction with a particular clustering algorithm.
According to [2], methods based on the wrapper approach can be divided into two broad categories;
sequential and bio-inspired. In the former, features are added or removed sequentially, but they tend to be trapped in local optimal solutions. The latter, on the other hand, try to incorporate randomness into their search procedure for escaping from these local solutions.
Search strategy
Feature subset Clustering algorithm
Feature evaluation
criterion
All features Clusters
Criterion value
Selected features Clusters
Figure 3: Wrapper approach for unsupervised feature selection.
Finally, methods based on the hybrid approach try to exploit the advantages of both, filter and wrapper, approaches, with the aim of obtaining a reasonable compromise between efficiency (computational effort) and effectiveness (good feature subsets). A typical hybrid method goes through the following steps: (1) it
employs a filter criterion to select different candidate subsets or to produce a feature ranking. Then, (2) it evaluates the quality of clustering for each candidate subset or some feature subsets based on the feature ranking. In the final step, (3) the subset with the highest clustering quality is selected. Algorithms belonging to the hybrid approach usually produce better clustering quality than those of the filter approach, but, they are less efficient. Compared to the wrapper approach, the hybrid methods are much more efficient [56], but they usually produce lower quality solutions.
2.2 Clustering algorithms for mixed data
Given a data sample, the objective of clustering is to group similar objects together. Generally, the clustering algorithms can be classified as partitional and hierarchical. Partitional clustering provides one level of clustering. Hierarchical clustering, on the other hand, provides multiple levels (a hierarchy) of clustering solutions. There are several algorithms for performing clustering, a survey of these algorithms can be found in [57,58].
Since one of the tasks involved in this research proposal is the clustering of mixed data, in this section, we briefly present two popular partitional clustering algorithms for this kind of data:k-prototypes and finite mixture model clustering.
2.2.1 k-prototypes
Thek-prototypes algorithm [59] is a clustering algorithm designed to cluster mixed datasets. This algorithm is based on the idea ofk-means [60].
Let X be a mixed dataset containing m objects, each one described by n features. Without loss of generality, we assume that the firstpfeatures are numerical and the lastn−pfeatures are non-numerical.
The distance between two objectsxandyinXcan be defined as [59]:
Dmix(x,y, β) =
p
X
i=1
(xi−yi)2+β
n
X
i=p+1
δ(xi, yi) (1)
wherexiandyiare theithcomponent ofxandyrespectively,βis a balance weight used to avoid favoring either type of attribute, andδ(·,·)is the simple matching distance defined as
δ(xi, yi) =
(0 ifxi =yi 1 ifxi 6=yi
The objective function thatk-prototypes tries to minimize is defined as Pβ =
k
X
j=1
X x∈Cj
Dmix(x,µj, β) (2)
whereDmix(·,·, β)is defined in (1),kis the number of clusters,Cj is thejth cluster, andµj is the center or prototype of the clusterCj.
To minimize the objective function defined in (2), the algorithm iteratively updates the cluster member- ships given the cluster centers, and updates the cluster centers given the cluster memberships until a stop condition is met.
At the beginning, thek-prototypes algorithm initializeskcluster centers by randomly selectingkdistinct objects from the dataset. Suppose µ(0)1 ,µ(0)2 , . . . ,µ(0)k are the k initial cluster centers. Thek-prototypes algorithm updates the cluster membershipsγ1, γ2. . . . , γmas follows:
γi0 = argmin
1≤j≤k
Dmix(xi,µ(0)j , β), (3) whereDmix(·,·, β)is defined in (1).
Once the cluster memberships have been updated, the algorithm proceeds to update the cluster centers as follows:
µ(1)jh = 1
|Cj| X x∈Cj
xh, h= 1,2, . . . p
µ(1)jh =modeh(Cj), h=p+ 1, p+ 2, . . . , n,
(4)
whereCj ={xi ∈X :γi(0) =j}forj = 0,1, . . . , k, and modeh(Cj)is the most frequent non-numerical value of thehth feature in clusterCj. Thekprototypes algorithm repeats the above steps until the cluster memberships do not change or the maximum number of iterations is reached.
2.2.2 Finite mixture models
A finite mixture model assumes that a datasetX = {x1,x2, . . . ,xm}withmobjects is generated from a mixture ofkcomponent density functions, in whichp(xi|θj)represents the density function of componentj forj= 1,2, . . . k, whereθj is the parameter (to be estimated) for clusterj. The probability density function for an objectxiis expressed by
p(xi) =
k
X
j=1
αjp(xi|θj) (5)
where theαj are the mixing proportions of the components (subject toαj ≥ 0 andPk
j=1αj = 1). The log-likelihood ofXis then given by
L(Θ|X) =
m
X
i=1
ln
k
X
j=1
p(xi) (6)
where Θis the set containing the mixture parameters θj. For optimizing (6), it is necessary to estimate Θ. This optimization is commonly achieved applying the Expectation-Maximization (EM) [61] algorithm which allows finding a (local) maximum likelihood or maximum a posteriori (MAP) estimate of the pa- rameters for the given dataset. The EM algorithm iterates between an Expectation-step (E-step), which computes the expected complete data log-likelihood given the observed data and the model parameters, and a Maximization-step (M-step), which estimates the model parameters by maximizing the expected com- plete data log-likelihood from the E-step, until convergence. The clustering solution that we obtain in a mixture model is “soft” because we obtain an estimated cluster membership (i.e., each object belongs to all clusters with some probability of belonging to each cluster), in contrast to k-prototypes which provides a
“hard”-clustering solution (i.e., each object only belongs to a single cluster).
Mixture-based models can deal with different types of features [4]. A Gaussian distribution is typically used for numerical features and multinomials for non-numerical features (Gaussian-multinomial mixture)
[62]. A more thorough description of clustering using Gaussian-multinomial finite mixture models can be found in [63–66].
2.3 Performance Evaluation
There are two standard ways to assess the performance of unsupervised feature selection methods [17]:
in terms of clustering results and in terms of supervised classification results. For assessing clustering results, the clustering accuracy (ACC) and the Normalized Mutual Information (NMI) evaluation measures are commonly used. These evaluation measures are defined as follows:
Denoting byqithe label computed by a clustering algorithm and bypithe true label ofxi.ACC [67] is computed as follows:
ACC= Pm
i=1δ(pi, map(qi))
m (7)
wherem is the total number of objects and δ(x, y) = 1 ifx = y; otherwise δ(x, y) = 0. map(qi)is a mapping function that permutes clustering labels to get the best match with the true labels. ACC values range from0to 1 where largerACCmeans a better clustering.
Given the clustering results and the true labelsPandQ, respectively, NMI [67] is defined as N M I = I(P, Q)
max{H(P), H(Q)} (8)
whereH(P)andH(Q)are the entropies ofP andQrespectively, andI(P, Q) is the mutual information [68] betweenP andQdefined as follows:
I(P, Q) = X
pi∈P,qj∈Q
p(pi, qj)·log2 p(pi, qj) p(pi)·(qj)
wherep(pi)andp(qj)are the probabilities that an object arbitrarily selected from the dataset belongs to the clusterspiandqj, respectively, andp(pi, qj)is the joint probability that an arbitrarily selected object belongs to the clusterspi andqj at the same time. Values of NMI range from0to1. NMI reflects how identical or independent areP andQ. Hence, better clusterings get larger NMI values.
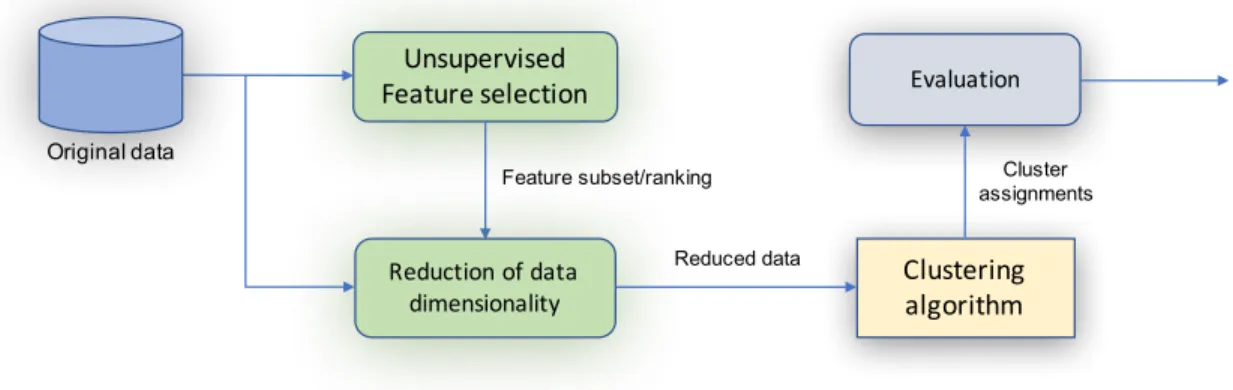
Unsupervised Feature selection
Feature subset/ranking
Clustering algorithm
Reduced data
Reduction of data dimensionality
Evaluation
Cluster assignments Original data
Figure 4: Feature selection evaluation using the clustering results.
To evaluate the performance of unsupervised feature selection methods in terms of clustering results, the steps showed in Figure4are commonly followed. An unsupervised feature selection method is first applied over the original dataset to select/rank features. Then, a clustering algorithm is applied over the reduced data, and the clustering results are assessed through an evaluation measure. In these last two steps, because in our experiments we will use k-prototypes and EM as clustering algorithms, and since these depend on the initial centers, we repeat these algorithmsktimes with different initialization points and the average of these results is reported.
On the other hand, for assessing the results of unsupervised feature selection methods regarding super- vised classification results, the accuracy ACC (or error rate) of a classifier is commonly used. This evaluation is performed as follows: the whole dataset is usually divided into two parts - a training set and a test set.
An unsupervised feature selection method is first applied on the training set to obtain a subset of relevant features, but without using the class labels. Then after training the classifier using the training set on the selected features, the test set on the selected features is used for assessing the classifier through its accuracy or error rate. To get more reliable results ak-fold cross validation technique is usually applied, and the final classification performance is reported as an average over thekfolds. The higher the average classification accuracy, the better the feature selection method. These evaluation steps are shown in Figure5.
Unsupervised Feature selection
Feature subset/ranking
Classifier
Reduced training data
Reduced testing data
Reduction of data dimensionality
Evaluation Classification Training data
Test data Original data
Figure 5: Feature selection evaluation using the classification results.
3 Related Work
In this section, we review the main unsupervised feature selection methods (filter, wrapper, and hybrid) reported in the literature. For this, we will follow the taxonomy shown inFigure 6.
3.1 Filter approach 3.1.1 Univariate
One of the first works developed in this category was introduced by Dash et al. in [69]. In this work, the authors introduced a new filter method called Sequential backward selection method for Unsupervised Data (SUD). This filter-based method weighs features using a measure of “entropy of similarities”, which is defined as the total entropy induced from a similarity matrix W, where the elements of W represent the similarity of each pair of objects in the dataset. The similarities inW are calculated as follows: when
Unsupervised feature selection
Filter Wrapper Hybrid
Sequential Bio-inspired
Univariate Multivariate
Information Spectral/Similarity
• Laplacian Score (He, et al., 2005)
• SPEC (Zhao and Liu, 2007)
• Liu et al., 2009
• Padungweang et al., 2009
• Garcia-Garcia and Santos- Rodriguez, 2009
• SUD (Dash et al., 1997)
• Dash et al., 2002
• Varshavsky et al., 2006
• Devakumari and Thangavel, 2010
• Banerjee and Pal, 2014
• Dy and Brodley, 2004
• Law et al, 2004
• Hruschkaand Covoes, 2005
• Breaban and Luchian, 2011
• BFK (Hrushkaet al., 2005)
• Li et al., 2006
Bio-inspired Sparse learning Spectral/Similarity Statistical based
• MRSF (Zhao et al., 2010)
• UDFS (Yang et al., 2011)
• JELSR (Hou et al., 2014)
• NDFS (Li and Tang , 2015)
• RSR (Zhang et al., 2016)
• FSFS (Mitra et al., 2002)
• Li et al., 2007
• MCFS ( Cai et al., 2010)
• SPEC (Zhao and Liu, 2011)
• UFSACO (Tabakhi et al., 2014)
• IRFSACO (Tabakhi et al., 2015 )
• RRFSACO (Tabakhiet al., 2015)
• MGSACO (Tabakhi et al., 2015)
• ELSA (Kim et al., 2002, 2003)
• MOGA (Dutta et al., 2014)
• Dash and Liu, 2000a
Figure 6: Taxonomy of unsupervised feature selection methods.
all features describing the objects in the dataset are numerical, the similarities are calculated using the exponential of the Euclidean distance metric; on the other hand, when the whole features in the dataset are non-numerical, the Hamming distance is used. For mixed data, the authors recommend performing a feature discretization before using the Hamming distance. The relevance of each feature is quantified using a leave- one-out sequential backward strategy jointly with the entropy measure above mentioned. The final result is a feature ranking ordered from the most to the least relevant feature. A later work based on this same idea was introduced in [70], where the main difference regarding the first one, is that instead of getting a feature ranking, a subset of features is selected using a forward selection search. Furthermore, the authors do not mention that their method can be applied to mixed data.
On the other hand, in [71] an unsupervised feature selection method for numerical data called SVD- Entropy is proposed. This method uses a measure based on the Singular Value Decomposition (SVD) of the data matrix [72]. The basic idea of this method is to measure the entropy of the data according to their singular values. When the entropy is low well-formed clusters are generated; by contrast, when the entropy is high the spectrum is uniformly distributed. In this work, some strategies including simple ranking, forward selection, and backward elimination were used. Two most recent works based on this measure of entropy were introduced in [19,73]. In these last works, it is tried to avoid some drawbacks of SVD-Entropy, such as the weaknesses of forward selection and backward elimination searches, and the inability to distinguish features having a constant value.
Another relatively recent unsupervised feature selection methods for numerical data that has won accep- tance for its affectivity, robustness and scalability are those methods based on spectral feature selection [6].
Spectral feature selection is based on the spectral graph theory [74], linear algebra and mathematical opti- mization. The general idea of spectral feature selection methods is to construct an affinity matrixW from the data similarities. This matrix represents the local or global data structure depending on the number of neighbors specified. Subsequently, from the affinity matrix, Laplacian or normalized Laplacian matrices are generated, which have many useful properties for feature selection. The Laplacian matrices or their
eigen-system associated are used by score functions to measure the relevance/consistency of each feature.
Examples of univariate methods based on this approach are SPEC [75], Laplacian Score [67] and its deriva- tive methods [76–78]. Spectral feature selection has been also used in multivariate methods; some examples are given in the following sub-section.
3.1.2 Multivariate
One of the most representative and referenced works in this category is FSFS (Feature Selection using Fea- ture Similarity) introduced by Pabitra Mitra et al. in [79]. In this work, the authors introduced a measure of dependency/similarity to reduce feature redundancy; this measure called Maximal Information Compres- sion Index (MICI) is based on the variance-covariance between features. The method involves partitioning the original set of features into clusters or groups, such that those features in the same cluster are highly similar (using MICI), while those in different clusters are dissimilar. Partitioning of the features is done based on the KNN principle. In the last stage, once the clusters are formed, FSFS selects only one feature from each cluster to form the final feature subset. Likewise, following a similar idea, in [80] a hierarchical method that tries to remove both redundant and irrelevant features is proposed. This method uses the MICI index proposed in [79] to remove redundant features. Subsequently, an exponential entropy measure is used to sort features according to their relevance. At the end, a non-redundant feature subset is selected using the fuzzy evaluation index FFEI [81].
Recently several bio-inspired unsupervised feature selection methods based on swarm intelligence frame- work [82,83] have been proposed. In [84], a method based on this idea called Unsupervised Feature Selec- tion based on Ant Colony Optimization (UFSACO) is proposed, whose main objective is to select feature subsets with low redundancy. In this work, first of all, the search space is represented as an undirected graph completely connected; where the set of nodes represent each feature and the weight of each edge denotes the similarity between nodes. This similarity is calculated using cosine similarity function, where the authors follow the idea that if two features resemble this similarity, then the features are redundant. Each node in the graph has a desirability measure associated called pheromone, which is updated by agents (ants) in function of its current value, a pre-specified decay rate, and the number of times that a given feature is selected by any agent. The complete procedure is performed as follows: at the beginning, a constant amount of initial pheromone to each node is assigned, then, the agents randomly placed in each node traverse the graph according to a transition rule (greedy and probabilistic) and a maximum number of nodes to visit.
The transition rule that moves an agent from a nodeuto the othervis in function of the pheromone value ofvand the inverse of the similarity measure betweenuandv, so the agents prefer high pheromone values and low similarities. The agents traverse the graph iteratively following the transition rule above mentioned until a pre-specified stop criterion (number of iterations) is reached. Finally, those features with the highest pheromone value are selected. Thus, it is expected to select feature subsets with low redundancy. Other three methods based on this idea are MGSACO [85], IRFSACO, and RRFSACO [54]. The difference is that these methods while minimizing redundancy between features, also aim to maximize the relevance.
Other multivariate feature selection methods that have received much attention in the last years due to their good performance and interpretability [17] are those based on sparse learning. Sparse learning [86]
refers to that collection of learning methods that seek a trade-off between some goodness-of-fit measure and sparsity of the result, the latter property is used in many supervised and unsupervised feature selection methods. The general idea of feature selection methods based on sparse learning is to minimize fitting errors along with some sparse regularization terms. The sparse regularization forces some feature coefficients to be small or exactly zero; then the corresponding features can be simply eliminated. Examples of methods
based on this idea are: RSR [87], UDFS [88] NDFS [89,90], JELSR [91,92] and MRSF [93].
Finally, some methods based on multivariate spectral feature selection combined with sparse learning have also been developed, an example of these methods is introduced by Cai et al. in [94], where an unsupervised feature selection method to measure the correlation between features called Multi-Cluster Feature Selection (MCFS) is proposed. MCFS consists of three steps: (1) the spectral clustering step, (2) sparse coefficient learning step and (3) feature selection step. In the first step, spectral clustering is applied on the dataset to detect the multi-cluster structure of the data. In the second step, since the embedding of the data is known, through of the firstk eigenvectors of the Laplacian matrix MCFS measures the importance of a feature by a regression model with a L1-norm regularization [95]. In the third step, after solving the regression problem, MCFS selects dfeatures base on the coefficients obtained through the regression problem. Another unsupervised feature selection method based on spectral feature selection and sparse learning is described in [6], which shows how to extend the univariate method SPEC [75] to multivariate, making this method capable of removing redundant features.
3.2 Wrapper approach 3.2.1 Sequential
One of the most outstanding works in this category was introduced by J. G. Dy and C. E. Brodley in [16]. In this work two feature selection criteria were examined: the criterion of maximum likelihood ML (Maximum Likelihood) and the scatter separability criterion (criterion of trace TR). The basic idea of this method is to search through the space of subsets of features, evaluating each candidate subset as follows: Expectation Maximization (EM) [61] ork-means [60] algorithms are performed on the data described by each candidate subset. Then, the obtained clusters are evaluated with the ML or TR criteria. The method uses a forward selection search for generating subsets of feature that will be evaluated as described above. The algorithm ends when the change in the value of the used criterion is smaller than a given.
Another important work in this category was proposed by Martin H. C. Law et al. in [96]. In this method, the authors assume that features are conditionally independent given the class. The method proposes a strategy to cluster data using the EM algorithm, which was modified to find simultaneously the parameters of the density functions that model the clusters, as well as a set of real values (one for each feature) called
“feature saliences” that quantify the relevance of each feature. Features are selected based on these feature saliences values (high feature saliences values are preferred), and the method returns the selected subset of features jointly with the clusters.
In [97] a method where a new optimization criterion that minimizes and maximizes the intra-cluster and inter-cluster inertias, respectively, is proposed. This criterion according to the authors, in most cases is unbiased w.r.t. the number of clusters. The criterion simultaneously provides both a ranking of relevant features and an optimal partition.
Finally, in [98], a method for feature selection called SS-SFS (Simplified Silhouette-Sequential Forward Selection) is proposed. The idea of this method is to select a feature subset that provides the best quality according to the simplified silhouette criteria. In this method, a forward selection search for generating subsets of features is used. Each feature subset is used to describe the data; then the data are clustered using thek-means clustering algorithm. After the clusters are evaluated by the simplified silhouette criterion, and finally the feature subset that maximizes this criterion is selected.
3.2.2 Bio-inspired
Two representative works in this category are those proposed by YongSeog Kim in [99,100], where an algorithm of evolutionary local selection (ELSA) to search feature subsets as well as the number of clusters using the clustering algorithms k-means and Gaussian mixture was proposed. Each solution provided by the clustering algorithms is associated with a vector whose elements represent the quality of the evaluation criteria, which are based on the cohesion of the clusters, inter-class separation, and maximum likelihood.
Those features of the subset that optimize the objective functions in the evaluation stage are selected as the final result.
Another more recent work, also based on an evolutionary algorithm, is introduced by Dipankar Dutta et al. in [101]. In this work, feature selection is performed while the data are clustered using a multi-objective genetic algorithm (MOGA). The basic idea of this method is to minimize intra-cluster distance (uniformity) and maximize inter-cluster distance (separation) through a multi-objective fitness function. For optimizing this fitness function, the authors employs k-prototypes [59,102] as clustering algorithm. Therefore, this method can handle both numerical and non-numerical features (mixed data). In the final stage, this method returns the feature subset that optimizing the fitness function jointly with the clusters.
3.3 Hybrid approach
Dash and Liu introduced one of the first unsupervised hybrid feature selection methods in [103]. This method is based on the entropy measure proposed in [69] (filter stage), jointly with the internal scatter separability criterion [16] (wrapper stage). In the filter stage, the authors apply the following search strategy for feature ranking: each feature, in the whole set of features, is removed in turn, and the entropy generated on the data set is calculated. This produces a list of features sorted in according to the degree of disorder that each feature generates when it is removed from the whole set of features. Once all features are sorted, in the wrapper stage, a forward selection search is applied jointly with thek-means algorithm in order to build clusters which are evaluated by a scatter separability criterion. At the end, the method selects the subset of features that provides the highest value for the separability criterion. According to the authors, this method can be applied to mixed data by performing a discretization of the numerical features before the use of a similarity measure based on the Hamming distance. Finally, It is also worth mentioning that this method performs random sampling of objects, resulting in a loss of information.
Another hybrid method also based on feature ranking was proposed by Yun Li et al. in [104]. In this method, the authors combine an exponential entropy measure with the fuzzy evaluation index FFEI [81] for feature ranking and feature subset selection respectively. The method employs sequential search considering subsets of features based on the generated ranking, by using the fuzzy evaluation index as quality measure.
Finally, in the wrapper stage, the fuzzy-c-means algorithm and the scatter separability criterion are employed to select a “compact” subset of features.
Finally, in [105] a hybrid method called BFK which combinesk-means and a Bayesian filter for feature selection is proposed. This method, unlike the above, at the initial stage begins with the wrapper stage, by running thek-means clustering algorithm on the data set with a range of clusters specified by the user. The clusters are evaluated with the simplified silhouette criterion and that one with the highest value is selected.
Subsequently, in the filter stage, to select a subset of features a Bayesian network is built, where each cluster represents a class, the nodes represent features, and the edges represent the relationships between features.
Finally, using the concept of Markov blanket a feature subset is selected.
3.4 Concluding remarks
From the review on unsupervised feature selection methods reported in the literature, we can see that, there are no studies addressing the problem of unsupervised feature selection specifically for mixed data.
And those mentioning that the proposed unsupervised feature selection method can be applied for mixed data, as SUD in [69] and Dash and Liu in [103], have the following limitations:
a) Although they use different distance measures for each type of feature (Euclidean for numerical features and Hamming for non-numerical ones); for handling mixed data, they recommend performing a pre- liminary discretization of numerical features. Which, as we have already mentioned, results in loss of information and a high dependence on the used discretization technique [47].
b) The method proposed by Dash and Liu [103] optimizes an internal validation index, which biases the method towards trivial solutions because it suffers from the so-called “Bias of Criterion Values to Di- mension” [16].
c) In Dash and Liu [103] random sampling of objects is performed, however, according to [7], this type of sampling is not a good choice, because relevant information could be ignored, and additionally the quality of the algorithms may change unpredictably and significantly.
Finally, MOGA [101] due to its meta-heuristic approach based on populations requires the tunning of several parameters (percentage of mutation, crossover rate, the number of iterations, etc.). Moreover, it is also worth mentioning that this algorithm was not proposed exclusively for feature selection, but rather its main objective is clustering, suffering also of the Bias of Criterion Values to Dimension since it also uses an internal validation index for clustering and feature selection.
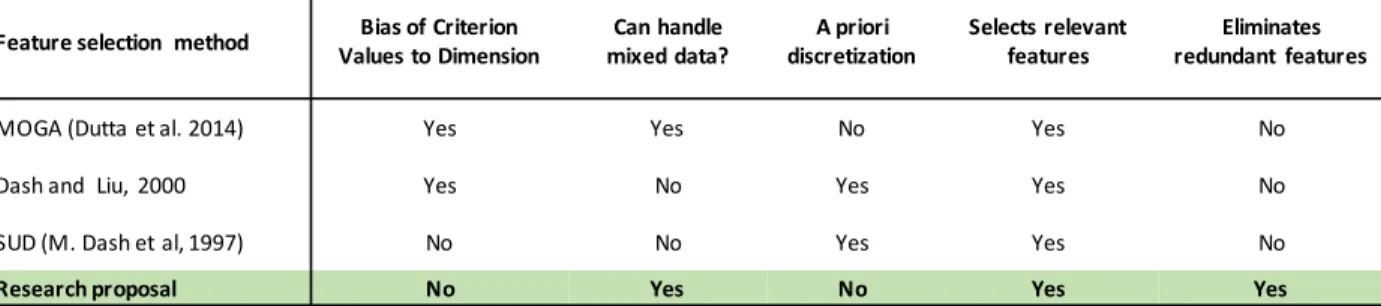
Table 1: Characteristics of unsupervised feature selection methods for mixed data.
Feature selection method Bias of Criterion
Values to Dimension Can handle
mixed data? A priori
discretization Selects relevant
features Eliminates
redundant features
MOGA (Dutta et al. 2014) Yes Yes No Yes No
Dash and Liu, 2000 Yes No Yes Yes No
SUD (M. Dash et al, 1997) No No Yes Yes No
Research proposal No Yes No Yes Yes
As we can see, these methods do not solve the unsupervised feature selection problem for mixed data, in addition they have several characteristics that adversely affect the quality of their results. So it is important to propose new methods that pose a solution to these problems. To conclude this section, inTable 1we can see a comparative of the main differences between the method to be developed in this Ph.D. research and the unsupervised feature selection methods for mixed data mentioned before. In this table, it is possible to ap- preciate that the method to be developed in this research will work with mixed data without a preprocessing stage, in contrast to SUD and the method proposed by Dash and Liu [103] that perform an a priori feature discretization. Also, unlike other methods, our method will eliminate redundant features and, in the case of using an internal validation index for feature subsets evaluation, we will include a solution to mitigate the Bias of Criterion Values to Dimension.
4 Justification and Motivation
As we have previously stated, there are several real-world applications where data are described by both, numerical and non-numerical features, that is, mixed data; and in many cases, these data are not labeled (unsupervised data). However, as we have seen in the related work section, the development of unsupervised feature selection methods for mixed data has been little explored. To the best of our knowledge, in the literature, only three works raise the possibility of processing mixed data. However, as we have already discussed, two of these methods perform an a priori discretization of numerical features. Meanwhile, the third work is not really a feature selection method, because its primary objective is data clustering.
In view of the above mentioned, in this Ph.D. research, we will introduce a new unsupervised feature selection method for mixed data.
5 Ph.D. Research Proposal
In this section, we address the problem to be solved, the research questions, hypothesis, objectives, the expected contributions, the methodology, the publication plan and the schedule of activities.
5.1 Problem to be solved
The problem to be solved in this Ph.D. research is to develop a new unsupervised feature selection method for mixed data, which outperforms the methods reported in the literature. This raises some serious difficul- ties, which are listed below:
1. In unsupervised feature selection, there is not a measure to assess the relevance of a feature (or a feature subset) in mixed datasets. Therefore new mechanisms for identifying relevant features in this kind of data should be introduced.
2. For identifying redundant features, a pairwise comparison between features is commonly performed.
However, if the features are of different type, it is not clear how to determine redundant features.
3. Simultaneously identifying relevant and non-redundant feature subsets in unsupervised mixed data has not been studied.
5.2 Research questions
From the difficulties above commented, the following research questions emerge:
Q1. How to quantify the relevance of a feature (or a feature subset) in unsupervised mixed datasets?
Q2. How to identify redundant features in unsupervised mixed datasets?
Q3. How to select relevant and non-redundant features in unsupervised mixed datasets?
5.3 Hypothesis
In our research, we consider the following hypothesis:
It is possible to find a subset of relevant and non-redundant features in unsupervised mixed datasets.
5.4 Objectives
Following our hypothesis, to solve the research questions we established the following objectives.
5.4.1 Main objective
Propose a new unsupervised feature selection method that can select a subset of relevant and non-redundant features in mixed data, which outcomes statistically better results than state-of-the-art methods.
5.4.2 Specific objectives
• Propose a quality measure to evaluate how relevant a feature (or a feature subset) is in unsupervised mixed datasets.
• Propose a measure to evaluate redundancy between features in unsupervised mixed datasets.
• Propose a way for combining redundancy and relevance measures for selecting features in unsuper- vised mixed datasets.
• Develop a new unsupervised feature selection method for mixed data such that the results, in terms of classification, be statistically better than the state-of-the-art methods.
5.5 Methodology
To carry out our specific objectives, the following methodology is proposed:
I. Select, collect and critically analyze the related works reported in the literature.
II. Data generation and collecting.
1. Collect and pre-process real-world datasets from different sources to evaluate the performance of the unsupervised feature selection method developed in this research.
2. Generate synthetic datasets with different characteristics to evaluate the performance of the pro- posed method in controlled situations. These datasets will be generated following the most com- monly used guidelines in feature selection [16,96,106] and clustering [107].
III. Develop a strategy for identifying and selecting relevant features in unsupervised mixed datasets, for doing this, we will follow the next steps:
1. First, we will analyze and evaluate the possibility of using or extending the ideas employed by the reported supervised feature selection methods for mixed data in an unsupervised context. At this point, we will explore among others: Information theory [43,47,108–110], Testor’s theory [111,112], Rough set theory [113–118], and the decision tree approach [119].
2. Develop a way to assess feature subsets and/or individual features based on the most effective and important approaches used for identifying relevant features in unsupervised feature selection. At this point, we will address, among others, the following lines of research:
a) Spectral feature selection. In this approach, we consider proposing new algorithms to construct a good data representation through a kernel matrix [120] (which is necessary for constructing Laplacian matrices). In this step, we will evaluate the performance of some kernel functions [42,121] and distance measures, such as those described in [122–125], that have been developed for mixed data. Also, we will explore new score functions to measure the relevance of a feature following this approach.
b) Decision trees. Here, we will propose a way for evaluating features individually using split evaluation measures and strategies used in unsupervised decision trees [126,127] for identifying relevant features in mixed data.
c) Information theory. In this approach, initially, we will propose a way for evaluating feature relevance in unsupervised mixed datasets using measures from information theory [68] such as entropy, mutual information, or conditional mutual information.
3. Propose a new method for identifying and selecting relevant features in unsupervised mixed data based on the experience obtained from pointsIII1andIII2.
4. Implementing the main unsupervised feature selection methods of the approaches mentioned above for identifying relevant features.
5. Testing, comparing results, analysis, and feedback of the approaches and methods analyzed in the pointsIII1,III2,III3, andIII4as well as the new ideas generated from these steps.
IV. Develop a strategy for identifying redundant features in unsupervised mixed datasets, for this, the next steps will be followed:
1. Analyze and evaluate the possibility of extending, to the unsupervised context, the strategies used in supervised feature selection for identifying redundant features in mixed data. For doing this, we will explore some strategies used in Game Theory [128,129] and Information Theory [10,11].
2. Develop a way to assess feature redundancy in mixed datasets following ideas from the most ef- fective and robust multivariate strategies used for eliminating redundant features in unsupervised numerical datasets. At this point, we will address three main approaches:
a) Multivariate spectral feature selection. It is planned to develop a mechanism for identifying redundant features using the kernel matrices constructed in pointIII(2)aapplying the spectral feature selection approach in a multivariate way [6].
b) Sparse learning approach. Develop an evaluation mechanism based on the sparse learning [87,93] approach to identify redundant features in mixed data, modeling the feature selection as a loss minimization problem using the similarity matrix constructed in pointIII(2)a.
c) Statistical approach. Evaluate non-parametric and functional dependence methods [7] for mea- suring the similarity (correlation) between features in mixed data.
3. Based on the experience obtained from pointsIV1andIV2, proposing a new algorithm for identi- fying and eliminating redundant features in unsupervised mixed data.
4. Implementing the main unsupervised feature selection methods of the approaches mentioned above for eliminating redundant features.
5. Testing, comparing results, analysis, and feedback of the approaches and methods analyzed in the pointsIV1,IV2,IV3, andIV4as well as the new ideas generated in these steps.
V. Proposing a new unsupervised feature selection method for identifying and selecting relevant and non- redundant features in mixed datasets. For this, we will proceed as follows:
1. Propose a strategy to combine the results obtained at pointsIIIandIVfor selecting a feature subset.
In this step, filter, wrapper, and hybrids approaches will be explored considering, among others, the following combination options:
a) Sequential combination. Propose an algorithm for generating and evaluating feature subsets using the measures of relevance and redundancy developed in the pointsIIIandIV, considering some sequential or bio-inspired search strategies.
b) Joint combination. Propose an algorithm that allows the interaction betweenIIIandIVfor a joint search of relevant and non-redundant features. Additionally, we will look for a function that simultaneously quantifies the relevance/redundancy of the features in mixed data.
2. Testing, comparison of results, analysis, and feedback.
VI. Experimental evaluation.
1. Develop a platform for feature selection, which allows doing the evaluation, and comparative study of unsupervised feature selection methods.
2. Evaluate and compare the proposed unsupervised feature selection method against state-of-the-art methods. For this evaluation and comparison, we will follow two standard forms of assessment of unsupervised feature selection methods:
a) In terms of the clustering quality [27,90,94,130–132]. In this context, we will use the most common evaluation measures in unsupervised classification such as ACC, NMI or the Jaccard coefficient, over the results of a clustering algorithm likek-prototypes or finite mixture models;
working over the selected subset of features.
b) In terms of classification quality using supervised learning algorithms [54,75,84,85,87], such as Support Vector Machines, Random-Forest, k nearest-neighbor, Naive Bayes, and Decision Trees; working over the selected subset of features.
A diagram of this methodology is shown in Figure7.
5.6 Expected contributions
The expected contributions of this research include:
• A new unsupervised feature selection method for mixed data.
• A new measure to assess feature relevance in unsupervised mixed data.
• A new measure to quantify the redundancy between features in unsupervised mixed data.
5.7 Publication plan
The publication plan of this research is as follows:
1. A review of unsupervised feature selection methods. This will be sent toArtificial Intelligence review.
Critical analysis of the state of the art
Develop a strategy for identifying and selecting relevant features
Spectral feature selection
Information theory Testor's
theory Rough set theory
Explore, analyze and/or extend
Other
approaches Propose a new
approach
Develop a strategy for Identifying and eliminating redundant features
Game theory Statistical
approach Sparse learning
Explore, analyze and/or extend
Propose a new approach Spectral
feature selection
Other approaches
Propose a new unsupervised feature
selection method for mixed data
ü Sequential combination ü Joint combination
Testing, comparison of results, analysis, and feedback
Testing, comparison
of results, analysis, and
feedback Combine the relevancy and
redundancy evaluation measures for feature selection
Figure 7: General diagram of the proposed methodology.
2. An article in a JCR Journal reporting how to identify and select relevant features in unsupervised mixed datasets. This will be sent toPattern RecognitionorExpert Systems with Applications.
3. An article in a JCR Journal reporting a way to identify and eliminate redundant features in unsuper- vised mixed datasets. This article will be sent toPattern Analysis and ApplicationsorKnowledge and Information Systems.
4. An article in a JCR Journal reporting a new unsupervised feature selection method for mixed data
that eliminates redundant features and selects the most relevant ones. This article may be sent to NeuroComputing.orKnowledge-Based Systems.
5. We also plan to send articles to refereed international conferences (for example: MCPR, CIARP, and/orMICAI) reporting intermediate results.
5.8 Schedule
Table 2shows the schedule for this Ph.D. research.
Table 2: Schedule of activities.
No. 2016 2017 2018 2019
1 2 3 1 2 3 1 2 3 1 2 3
1 Collection and analysis of the literature (Point I of the methodology)
2 Collection and generation of mixed datasets 3 Developing preliminary results
4 Writing the PhD. research proposal 5 Public defense of the PhD. research proposal 6
Critical study, analysis and exploration of the most effective and important approaches used for identifying relevant features (Point III of the methodology).
7 Develop a strategy for identifying and selecting relevant features in mixed data sets
8 Critical study and analysis of feature selection approaches for identifying redundant features (Point IV of the methodology) 9 Develop a strategy to identifying and eliminating redundant
features in mixed data
10 Propose an unsupervised feature selection method for mixed data that eliminates redundant features and selects the relevant ones (Point V of the methodology)
11 Experimental evaluation (Point VI of the methodology) 12 Writing of the PhD. thesis document
13 Writing and submitting articles to journals or conferences 14 Revisions of the PhD. thesis document (advisors)
15 Delivery of the PhD. thesis document to the PhD. committee 16 Thesis corrections
17 Public defense of the results of this PhD. research
Period of time In progress PhD. defense
Activity Quarter
6 Preliminary Results
This section presents the preliminary results obtained following the methodology described in subsection 5.5. Section6.1presents a new filter unsupervised feature selection method for mixed data, and Section6.2, we present our experimental results over real and synthetic datasets.
6.1 A new filter unsupervised spectral feature selection method for mixed data
Given a collection ofmobjectsXT ={x1,x2, . . . ,xm}, described by a set ofnfeaturesT ={F1, F2, . . . , Fn}, and am×msimilarity matrixW, containing the similaritieswij ≥0between all pairs of objects xiandxj. According to the spectral clustering theory [74,133,134], we can obtain structural information (cluster structure) fromXT, by studying the eigensystem of the Laplacian matrix derived fromW. Based on this knowledge, spectral feature selection [6] is a relatively new and effective feature selection framework that uses the similarity matrixW, the Laplacian matrix, and the eigen-system of the Laplacian matrix for finding relevant features through the features’ consistency. Nevertheless, to quantify the feature relevance in mixed data using the theoretical bases of this feature selection framework, two important problems must be solved: 1) a way of quantifying the objects’ similarities in mixed data must be proposed. 2) in mixed data, there is no way to measure the consistency of a non-numerical feature against the Laplacian matrix or its eigenvectors (as it is usually done). To address these problems we propose the following:
1. Build a similarity matrixW through a kernel function capable of quantifying the similarity between objects in mixed datasets. With this, in addition to employing an effective and widely used approach in the context of unsupervised learning for describing relationships among objects, we also provide a mechanism for abstracting the feature type in mixed data.
2. Because the structural information of the data is contained in the spectrum of the Laplacian matrix, and since the spectrum is independent of the type of features in the dataset (because the spectrum is in function of theW matrix). We propose measuring the consistency (relevance) of each feature through a feature relevance evaluation measure based on the spectrum of the Normalized Laplacian matrixL derived from the similarity matrixW together with a leave-one-out feature elimination strategy. The idea is to quantify the variation of the distribution of the spectrum in such a way that depending on that variation; we can measure the consistency of each featureFi∈T.
Below, these points are explained in detail.
6.1.1 The similarity matrix
Am×m object similarity matrix W = w(i, j) = wij, contains the similarity between the objects in a datasetXT. In this matrix , the elementswij represent the similarity between the objectxi and the object xj, which can be viewed as the weight on the edge connecting the ith and jth data points in a graph G.
The number of edges onGdepends on the type of the graph that we want to model, such as thek-nearest neighbor or the fully connected graph [133]. To model the global structure of the data, we construct the fully connected graph, and we takeW as the adjacency matrix ofG.
W is also called as affinity or kernel matrix, a positive semi-definite matrix where it holds that∀z∈Rm, z|Wz ≥ 0. For building the matrix W, we propose to use the clinical kernel [121], which assumes that all features are equally important in the original space. We selected this kernel because it has shown good
results for classifying mixed data [42,135]. The clinical kernel averages univariate sub-kernels for each feature as follows:
wij =K(xi,xj) = 1 n
n
X
p=1
k(xip, xjp) (9)
wherek(a, b) = 1−distF(a, b), beingdistF(a, b)any metric that can handle different types of features.
6.1.2 The Normalized Laplacian matrix and its spectrum Letddenote the vector: d={d1, d2, . . . , dm}, wheredi =Pm
k=1wik. The degree matrixDof the graph Gis defined asD(i, j) =diifi=j, and0otherwise. di can be interpreted as an estimation of the density aroundxi. The Laplacian (L) and the Normalized Laplacian (L) matrices are defined as:
L=D−W
L=D−12LD−12 (10)
where D−12 is the reciprocal square root ofD whose diagonal entries are the reciprocals of the positive square roots of the diagonal entries ofD. Finally, the spectrumSLof the Normalized Laplacian matrixLis defined as:
SL= (λ1, λ2, . . . , λm) (11) whereλ1 ≤ λ2 ≤ . . . ≤ λm are the eigenvalues of Larranged in ascending order. In this spectrum, the eigenvalueλ1is always equal to0[74], and together with its corresponding eigenvector, they are called the trivial eigenpair ofL.
SL has two useful properties for feature selection. 1) the eigenvalues close to zero (i.e., the first non- trivial eigenvalues of SL) quantify the consistency of their corresponding eigenvectors; in other words, they quantify how well their corresponding eigenvectors can separate the data [6]. 2) when a dataset has a separable cluster structure, the differences between elements inSL(also called eigengaps or spectral gaps) are larger [133]. For illustrating these facts, in Figure8we show the distribution of the spectrumSLof a synthetic3mixed dataset composed by 600 objects, 44 relevant features, and six clusters. In Figure8a, we can see the spectrum of this dataset when it is described only by the 44 relevant features. While in Figure8b, we can observe the same dataset, but adding 20 irrelevant features. As can be seen in these figures, when we added irrelevant features, the spectral gap between the first non-trivial eigenvalues ofSLtend to be smaller.
The two properties above mentioned can help us to identify relevant features in the data. Therefore, we propose to use these properties for introducing a new unsupervised feature selection method capable of handling mixed data.
6.1.3 Identifying relevant features
As we have already commented, the cluster structure of the data can be quantified from the information provided by the first eigenvalues4ofSL. Based on this fact, and also knowing that the firstk+1eigenvectors
3For details on how these datasets are generated, see Section6.2.
4Except the eigenvalueλ1, which, as we have already mentioned, is always equal to0.