Annals of Hepatology 7(3) 2008: 212-220
212
www.medigraphic.com
Annals of Hepatology 2008; 7(3): July-September: 212-220
Annals of Hepatology
Concise Review
Imaging techniques for assessing hepatic fat
content in nonalcoholic fatty liver disease
Ernesto Roldan-Valadez,
1Rafael Favila,
2Manuel Martínez-López,
1Misael Uribe,
3Nahum Méndez-Sánchez
31MRI Unit. Medica Sur Hospital, Mexico City. Mexico. 2GE Healthcare. Mexico City. Mexico.
3Liver Unit and Department of Biomedical Research. Medica Sur Clinic & Foundation. Mexico City. Mexico.
Address for correspondence:
Nahum Méndez-Sánchez, MD. Liver Research Unit, Medica Sur Clinic & Foundation, Mexico City, Mexico. Puente de Piedra 150, Col. Toriello Guerra, Zip Code 14050, Mexico City, Mexico. Phone number: (525) 55606-6222, ext. 4215. Fax number: (525) 55666-4031 and (525) 55606-1651.
E-mail: [email protected]
Manuscript received and accepted: 25 July 2008
Abstract
Nonalcoholic fatty liver disease (NAFLD), an emerging
clinical entity with worldwide recognition, is today the
most common cause of abnormal liver function tests
among adults in the United States. In Mexico City, its
prevalence has been reported by our group to be
around 14%, but its incidence is higher in the hispanic
population in the United States (hispanic population
45%, white population 33%, black population 24%).
The main issues in the diagnosis, follow-up, and
man-agement of NAFLD are our limited understanding of
its pathophysiology and the difficulties involved in
de-veloping a noninvasive diagnostic method. Several
im-aging techniques can detect fatty infiltration of the
liv-er, each with its own advantages and disadvantages.
Ul-trasound is still in the first option for diagnosis, but its
accuracy depends on the operator and the patient’s
fea-tures. Computed tomography can detect hepatic fat
content, but only at a threshold of 30%, and it involves
ionizing radiation. Magnetic resonance (MR)
spectros-copy is probably the most accurate and fastest method
of detecting fat, but it is expensive and the necessary
software is still not easily available in most MRI units.
MR elastography, a new technique to detect liver
stiff-ness, has not been demonstrated to detect NAFLD, and
is still undergoing research in patients with hepatitis
and cirrhosis. In conclusion, all these imaging tools are
limited in their ability to detect coexisting
inflamma-tion and fibrosis. In this review, we discuss the
radio-logical techniques currently used to detect hepatic fat
content.
Key words: Computed tomography, MR elastography,
ultrasound, MR spectroscopy, steatosis.
Nonalcoholic fatty liver disease (NAFLD) occurs at a
high frequency in the general population (13–34%).
1,2In
Mexico City, its prevalence has been reported by our
group to be around 14%,
3but its incidence is higher in
the hispanic population living in the United States
(his-panic population 45%, white population 33%, black
population 24%).
4Today, NAFLD is the most common
cause of abnormal liver function tests among adults in
United States,
4-8and will be the second most important
cause of liver disease in the future, with an impact higher
than that of infectious diseases.
9NAFLD is characterized by the accumulation of fat
(predominantly triglycerides), constituting more than 5–
10% of the liver weight,
1and asymptomatic, mild
eleva-tions of serum aminotransferase levels, in the absence of
excessive alcohol intake or other chronic liver
diseas-es.
10,11It is also common among patients with insulin
re-sistance (such as that observed in type 2 diabetes
melli-tus), high plasma leptin levels,
12,13low levels of
adi-ponectin,
12,14,15hyperlididemia,
13and obesity,
6,13,15,16all
of which are components of the metabolic syndrome.
15,17As the prevalence of obesity increases, the prevalence of
NAFLD is increasing worldwide, making it potentially
the most common form of chronic liver disease.
10,18The Mexican population has a high incidence of
over-weight
19(up to 70% of adults between 30 and 60 years of
age) and obesity (around 30% of adults older than 20
years).
19,20Mexicans are also susceptible to the insulin
re-sistance associated with obesity (the phenotype known
as the «metabolic syndrome»).
21It has been suggested
that insulin resistance is involved in the pathogenesis of
NAFLD. In Mexico, type 2 diabetes mellitus is the first
and second causes of death in women and men,
respec-tively, and the prevalence of NAFLD in patients with
type 2 diabetes mellitus may be as high as 100%.
22The
subclinical nature of NAFLD has led to increased efforts
to facilitate its diagnosis and to prevent its potential
pro-gression to nonalcoholic steatohepatitis (NASH), liver
cirrhosis, and hepatocellular carcinoma.
23From a previous study that suggested a total hepatic fat
fraction of 30% in living transplantation donors,
24we
have a reference for the maximum acceptable percentage
Artemisa
E Roldan-Valadez.Imaging techniques for assessing hepatic fat content in nonalcoholic fatty liver disease
www.medigraphic.com
of fat in clinical practice. The main issues in the diagnosis,
follow-up, and management of NAFLD are the difficulties
involved in developing a noninvasive diagnostic method
and our limited understanding of its pathophysiology.
Traditionally, the assessment of liver fat infiltration has
been based on a liver biopsy, because the histological
de-termination of fat content in liver biopsy specimens is
ac-cepted as the gold standard in the evaluation of donors for
split liver transplantation. However, the biopsy procedure
is often painful,
25requires bed rest for 6–8 h,
26and is
asso-ciated with discomfort because of its invasive nature, risk
of infection, and biliary leakage. More serious drawbacks
include bleeding and even a low mortality risk.
27Biopsies
are also subject to sampling error because less than 1/
50,000th of the liver is available for histological
analy-sis.
28Furthermore, liver biopsies may not accurately reflect
the degree of hepatic steatosis when the distribution of fat
infiltration is heterogeneous.
29,30Noninvasive imaging techniques, such as ultrasound
(US), computed tomography (CT), magnetic resonance
imaging (MRI), and proton magnetic resonance
spectros-copy (MRS), can detect fatty infiltration of the liver, but
they are limited in their ability to detect coexisting
in-flammation or fibrosis.
28We discuss the main
radiologi-cal modalities used in the diagnosis of increased fat
ac-cumulation (steatosis) in the hepatic parenchyma.
Ultrasound
Ultrasound is much more accessible than CT or MRI,
is less expensive, and allows a qualitative assessment of
hepatic fat. In abdominal US evaluations, steatosis
ap-pears bright or hyperechoic relative to the adjacent right
kidney or spleen.
31,32The sensitivity of US increases with
increasing degrees of steatosis.
33Mild steatosis
is
charac-terized by a mild increase in liver echogenicity.
Moder-ate steatosis
appears as increased liver echogenicity that
obscures the hepatic and portal vein walls
(Figure 1)
. In
severe steatosis, there is posterior attenuation of the deep
liver parenchyma, which is useful in diagnosing steatosis
of more than 30%.
34However, the ultrasonographic
eval-uation of steatosis does not exactly match the
histo-pathological quantification of steatosis, so accurate
quantification of steatosis is not feasible with the current
technology. The degree of fatty infiltration is based upon
a visual assessment of the intensity of the echogenicity:
10grade 0, normal echogenicity; grade 1, slight, diffuse
in-crease in fine echoes in the liver parenchyma, with
nor-mal visualization of the diaphragm and intrahepatic
ves-sel borders; grade 2, moderate, diffuse increase in fine
echoes, with slightly impaired visualization of the
intra-hepatic vessels and diaphragm; and grade 3, marked
in-crease in fine echoes, with poor or no visualization of the
intrahepatic vessel borders. However, the US method is
somewhat subjective.
28In hepatitis accompanied by
in-flammation and fibrosis,
35,36the fibrosis may be
hypere-choic. However, most of the time, fibrosis and fatty
infil-tration coexist in cirrhotic patients, in the so-called
«fat-ty–fibrotic pattern».
33,37Several studies have assessed the sensitivity and
specificity of US in detecting hepatic steatosis. The
sen-sitivity ranged from 60 to 94% and the specificity from
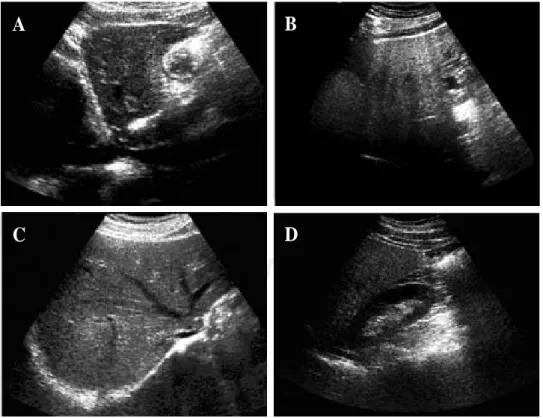
Figure 1. Characteristic ap-pearance of liver steatosis. A and B, sagittal views of the left lobe of livers with grade 1 and grade 3 steatosis respecti-vely. There is hyperechogeni-city with deep attenuation, which makes visualization of the cava vein difficult. C, Hy-perechoic liver parenchyma with partial visualization of the suprahepatic veins. D, Comparison of the echogeni-city of the right kidney and the right lobe of the liver. The hepatic attenuation allows a qualitative diagnosis of mode-rate steatosis.
A
B
www.medigraphic.com
84 to 95%.
37–39The operator dependency of ultrasound,
its inability to precisely quantify the hepatic fat
con-tent, and its inability to detect small changes in liver fat
with time all potentially limit its use in longitudinal
clinical studies.
28Computed tomography
Steatosis results in a reduction in the attenuation of
the liver, which can be measured in Hounsfield units
(HU) and appears as hypodense liver parenchyma.
40–42Unenhanced CT images are used for qualitative
evalua-tions and the spleen is used as the reference organ for
comparisons. Knowledge of the attenuation value in the
healthy liver (50–57 HU) on noncontrast-enhanced CT,
and its reduction by 1.6 HU for each milligram of
trig-lycerides deposited per gram of hepatic tissue
43facili-tates several methods of determining the appropriate CT
values.
44These methods include the measurement of
he-patic attenuation only
45and the normalization of the
he-patic attenuation to the splenic attenuation, the
mea-surement of the difference in attenuation between the
liver and the spleen,
46–48and the calculation of the ratio
of these values.
41The pattern of hepatic fatty changes can be graded
as: 0, normal; 1, diffuse, homogeneous; 2, geographic
pattern; 3, focal; and 4, focal sparing (pseudotumor,
glove pattern, simulating metastasis). The severity of
hepatic fatty infiltration is graded as: grade 0, normal;
grade 1, liver attenuation slightly less than that of the
spleen; grade 2, more pronounced difference between
the liver and spleen, and the intrahepatic vessels are not
visible or show slightly higher attenuation than that of
the liver; and grade 3, markedly reduced liver
attenua-tion, with sharp contrast between the liver and
intrahe-patic vessels.
10In quantitative evaluations, a spleen-to-liver
attenua-tion ratio with a cut-off value of 1.1 has been proposed to
exclude moderate steatosis.
40Calculating the difference
between the attenuation of the spleen and that of the
liv-er can also be used to evaluate steatosis. The attenuation
of the spleen is approximately 8–10 HU less than that of
the liver in a normal patient, whereas a liver-to-spleen
at-tenuation difference greater than 10 HU is highly
predic-tive of hepatic steatosis
(Figure 2).
46Enhanced CT has a limited role in the diagnosis of
ste-atosis because of the influence of the contrast injection
rate and the timing of the analysis of liver attenuation,
which can significantly influence the optimal
liver-mi-nus-spleen attenuation difference necessary for a
diagno-sis of fatty liver.
47,48It has been suggested that muscle,
rather than spleen, may be a better qualitative standard
reference for diagnosing fatty liver on contrast-enhanced
CT (the liver has a lower attenuation value than
mus-cle),
49although such a comparison can only be made
suc-cessfully if the degree of fatty infiltration is severe.
28From the assessment of hepatic steatosis in transplant
donors, it has been concluded that unenhanced CT
per-forms very well in diagnosing steatosis of 30% or more,
with 100% specificity and 82% sensitivity (similar
sensi-tivity is found with a liver/spleen attenuation ratio of 0.8
and a difference of 9 HU between the attenuations of the
liver and spleen).
50However, the best method for predicting the
patholog-ical fat content of the liver with CT is the simple
mea-surement of liver attenuation on unenhanced CT scans.
Therefore, the attenuation measurement of the spleen
does not contribute to the prediction of hepatic fat
con-tent.
44The use of these criteria can be helpful in avoiding
biopsies for moderately steatotic livers.
51Other considerations in the use of CT include
differ-ences in the attenuation values of CT scanners obtained
from different vendors. Even when using the same CT
scanner, the attenuation of fat varies with the patient’s
size and position, and with imaging artifacts, and can
ac-tually vary between images from a single patient.
52The
small (less than 1 cm diameter) regions of interests
(ROIs) used by some researchers could be changed to
ROIs with larger diameters (still within the hepatic
paren-chyma, avoiding vessels and bile ducts), and this might
be more accurate because, theoretically, a larger ROI
val-ue should give a more accurate result.
44,53It should be noted that up to 40% of patients with
NASH may have an increased iron content in the liver,
54which will alter the hepatic attenuation on CT. Many of
these patients also have increased levels of glycogen,
which is known to increase the attenuation of the liver,
further confounding attempts to quantify hepatic fat on
the basis of attenuation.
52A recent study concluded that
the diagnostic performance of unenhanced CT in the
quantitative assessment of macrovesicular steatosis is not
clinically acceptable.
50Moreover, CT scanning has the
drawback of exposing subjects to ionizing radiation.
These two factors limit its potential use in longitudinal
studies and in children.
Magnetic resonance imaging and proton
mag-netic resonance spectroscopy
The nuclear magnetic resonance (MR) phenomenon
was first reported by Bloch et al. in 1946.
28The clinical
im-E Roldan-Valadez.Imaging techniques for assessing hepatic fat content in nonalcoholic fatty liver disease
www.medigraphic.com
age, providing anatomical information (MRI), or a
fre-quency spectrum, providing biochemical information
(MRS).
55,56In-/Out-of-Phase Method
The sequence used for this purpose is a breathhold
T1-weighted gradient-echo in-/out-of-phase sequence.
57-59This technique has been used to evaluate patients before
living-related liver transplantation and has shown
prom-ise for the noninvasive evaluation of steatosis.
29,60This sequence can be obtained with all types of MR
scanners with different magnetic intensities including
0.5, 1, 1.5, and 3 T, but echo time (TE) values for the in
and out phases decrease according to the magnetic power
of the scanner. In the presence of steatosis, a signal drop
is observed on the out-of-phase images because of the
phase cancellation by fat and water
(Figure 3)
.
Quantitative measure of signal loss from in-phase to
op-posed-phase images can be obtained by measuring an ROI
in the left and right lobes (excluding vessels and areas of
motion artifacts, to minimize partial volume effects) and
cal-culating a ratio using the spleen as the internal reference.
The ratio can be calculated with the following formula:
op
S
ip
L
op
S
op
L
SDR
=
where SDR is the signal drop, Lop and Lip are the
liv-er out-of-phase and in-phase signals, respectively, and
Sop and Sip are the spleen out-of-phase and in-phase
nals, respectively. The lower the ratio, the greater the
sig-nal drop and thus the higher the fat content.
With this method, the reported sensitivity is 100%, the
specificity is 90.4%, the positive predictive value is
50%, the negative predictive value is 100%, and the
overall accuracy is 91.2%.
60Recently, this sequence has
been optimized for the quantitative measurement of the
fat fraction in the liver by applying dual flip angles (20
and 70 degrees) to resolve the ambiguity of the
domi-nant constituent.
61A
B
www.medigraphic.com
Proton MRS
Proton MRS allows the examination of the resonance
frequencies of all hydrogen nuclei (protons) within an
ROI.
28Although the absolute differences in resonance
frequencies in MRS are quite small, the concentration of
any given molecule in a sample is proportional to the
area under the specific resonance peak within the
spec-trum. The MR spectra are plotted on an axis of chemical
shift. Frequency separation, and hence spectral
resolu-tion, is determined by the strength of the main magnetic
field. The quantification of hepatic fat using proton MRS
requires the evaluation of the two dominant peaks within
the unsuppressed MR spectrum, water at 4.7 ppm and
lip-id at 1.0-1.5 ppm.
62Saggital, coronal, and axial slices
through the right lobe of the liver are acquired, and a
small voxel of 27 cm3 volume is used, avoiding major
blood vessels, intrahepatic bile ducts, and the lateral
mar-gins of the liver. After the system has been tuned and
shimmed, the spectra are collected.
4Several studies have
shown MRS to be a fast, safe, noninvasive method for the
quantification of hepatic fat content (63–65), and the
re-ported diagnostic precision is about 80%–85%, with 87–
100% sensitivity.
66In the presence of hepatic steatosis, MRS shows an
in-crease in the intensity of the lipid resonance peak
(Fig-ure 4)
. Because MRS allows the direct measurement of
the area under the lipid resonance peak, it can be used to
provide a quantitative assessment of fatty infiltration of
the liver.
Transient, real-time elastography and MR
elas-tography
Although these methods are used in the assessment of
liver fibrosis, they can also be used in conjunction with
the methods described above to further characterize
pa-thologies such as NASH, which may have a significant
fi-brosis component.
These new diagnostic modalities address the physical
properties of the liver.
67Ex vivo
and intraoperative
stud-ies have shown that liver elasticity correlates with the
de-gree of fibrosis found in biopsy specimens and with the
results of liver function tests.
68–72Ultrasonography-based
techniques have been proposed for the noninvasive
as-sessment of tissue elasticity,
73–76and
in vivo
measurement
of liver fibrosis has proved feasible with some of these
methods.
74,77,78The transient real-time elastography method is
per-formed with an ultrasound transducer probe mounted on
the axis of a vibrator.
79The vibration is transmitted
to-ward the liver, inducing an elastic shear wave that
propa-gates through the tissue. These propagations are
fol-lowed by pulse-echo sonographic acquisitions, and the
velocity of the propagation (directly related to tissue
stiffness) is measured. The harder the tissue, the faster the
shear wave propagates.
79–82MR elastography
MR elastography uses a modified phase-contrast MRI
sequence to visualize propagating shear waves in
tis-sue
83,84(Figure 5)
. For liver MRI, it uses a 90 Hz driving
frequency. This relatively short wavelength allows
sever-al waves to be imaged in the anterior portion of the
liv-er.
85Subcostal and transcostal approaches yield similar
estimations of normal liver stiffness (1.9 and 2.1 kPa,
re-spectively, for a 90 Hz driving frequency). However, the
optimum frequency is yet to be determined.
85Lower
fre-quencies are less attenuated and allow the estimation of
stiffness in deeper portions of the liver. If liver shear
stiff-ness is measured at several different frequencies, it
should be possible, in principle, to calculate the shear
viscosity of the liver tissue, which is potentially an
inde-pendent parameter for tissue characterization.
86This
tech-nique has also been applied to quantitatively assess the
viscoelastic properties of the breast, brain, and muscle in
humans.
87Steatosis from NAFLD could also, theoretically,
influ-ence liver stiffness measurements.
86However, a study by
Sandrini
77found no influence of steatosis on liver
elas-ticity. It is possible with MRI to estimate the degree of
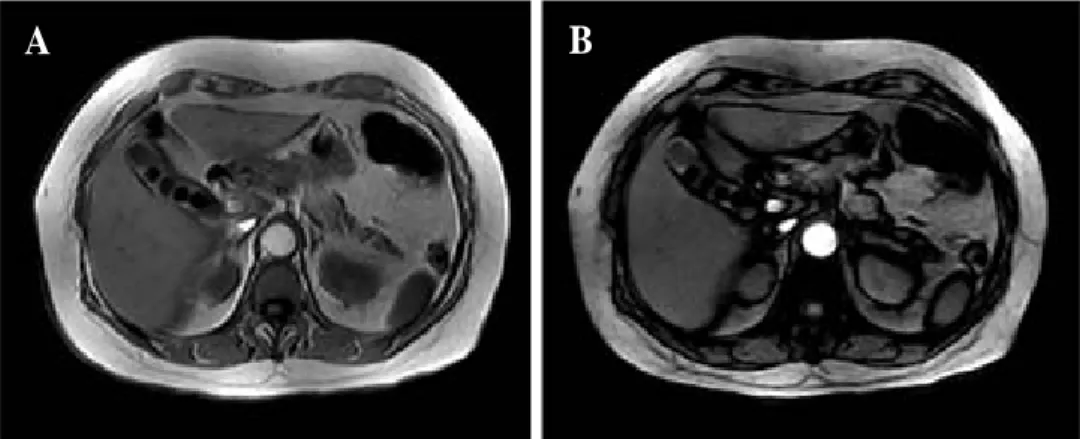
Figure 3. Magnetic resonance imaging of the liver, axial pla-ne. A–B, In- and out-of-phase gradient echo images, respec-tively. There is a subtle signal drop resulting from the phase cancellation of fat and water in this patient with grade I steatosis.
E Roldan-Valadez.Imaging techniques for assessing hepatic fat content in nonalcoholic fatty liver disease
www.medigraphic.com
steatosis by obtaining dual-echo gradient-echo images
88in the same plane as MR elastographic images. MR
elas-tography could be a convenient complement to MRS in
estimating noninvasively the degree of steatosis and the
level of liver stiffness. However, MR elastography
re-quires further study before it can be introduced into
clini-cal practice. Current research is oriented toward
discrimi-nating different stages of fibrosis in hepatitis and
cirrho-sis. Its combination with laboratory values (for example,
the aspartate transaminase-to-platelet ratio index, APRI
test)
79may further improve the specificity and sensitivity
of the noninvasive estimation of liver fibrosis.
67Conclusions
Current noninvasive methods for the diagnosis of
NAFLD offer reasonable sensitivity and specificity.
They can be used to complement biochemical markers
Real
water 8
6
4
2
0
Frequency (ppm) fat
8 6 4 2 0
Real
water 30
25
20
15
10
5
0
Frequency (ppm) fat
8 6 4 2 0
C
D
B
A
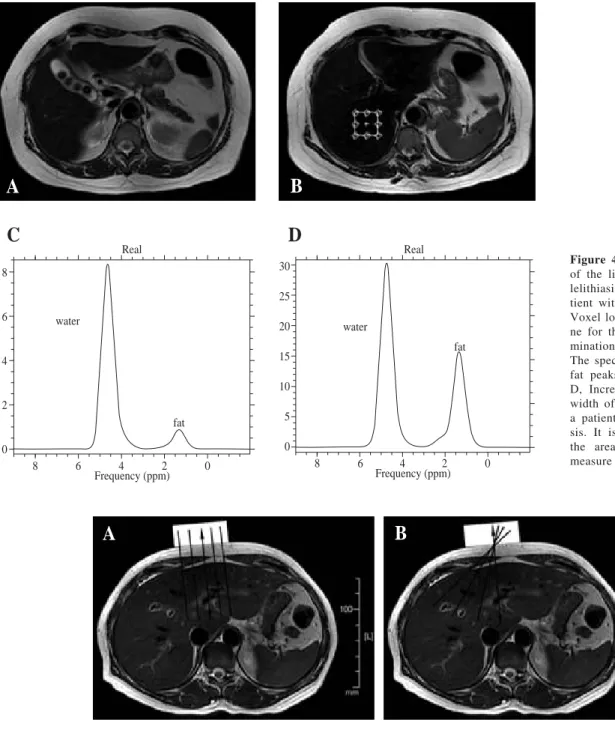
Figure 4. A, T2-weighted MR of the liver, axial plane. Cho-lelithiasis is apparent in a pa-tient with grade I steatosis. B, Voxel location in the axial pla-ne for the spectroscopic deter-mination of the fat fraction. C, The spectrum shows water and fat peaks in grade I steatosis. D, Increase in the height and width of the peak for lipids in a patient with grade II steato-sis. It is possible to calculate the area under the curve to measure the fat fraction.
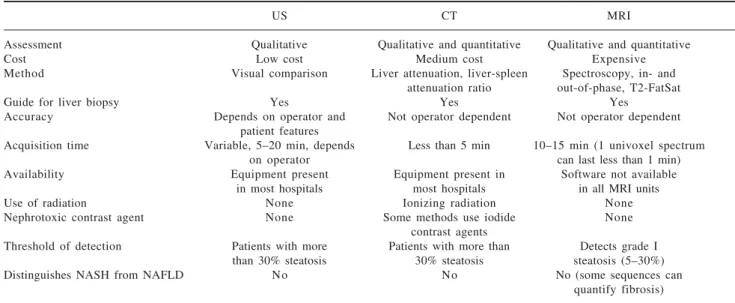
Figure 5. Schematic representation of image generation in MR elastography. The double-headed arrows indicate the vibrational motion of the driver in these axial MR images. The driver (rectangle) can be positioned below the ribs or against the anterior part of the rib cage. The shear waves reach only a limited part of the liver. The vibrational motion of the driver is perpendicular to its surface. A, Planes orthogonal to the surface of the driver. B, Oblique planes passing through the center of the driver.
www.medigraphic.com
in assessing the severity of steatosis.
15Table I
shows
the main advantages and disadvantages of these
imag-ing modalities.
The US examination continues to be the first option in
diagnosing NAFLD, because it is inexpensive and has no
adverse effects, but its accuracy depends on the
preva-lence of steatosis. CT is cost-effective and accurate in
as-sessing hepatic fat, requires only unenhanced CT, and
can detect focal lesions. However, the patient is exposed
to significant ionizing radiation. Both methods have a
threshold of more than 33% fat.
MRI, with its different sequences, is becoming the best
quantitative method of diagnosing steatosis because it
allows the detection of fat fractions of less than 33%. Its
disadvantages include its high cost and the limited
avail-ability in most hospitals of the software required for the
post processing of the data, even when an MRI scanner is
available.
No noninvasive technique can distinguish NASH and
other forms of NAFLD, a distinction that has important
prognostic implications.
89The patient’s particular
clini-cal history and perhaps a liver biopsy continue to be
re-quired for the appropriate management of some
particu-lar cases.
References
1. Lupsor M, Badea R. Imaging diagnosis and quantification of hepatic steatosis: is it an accepted alternative to needle biopsy? Rom J Gastroenterol 2005; 14: 419-425.
2. Victor RG, Haley RW, Willett DL, Peshock RM, Vaeth PC, Leonard D, Basit M, et al. The Dallas Heart Study: a population-based probability sample for the multidisciplinary study of ethnic dif-ferences in cardiovascular health. Am J Cardiol 2004; 93: 1473-1480.
3. Lizardi-Cervera J, Laparra DI, Chavez-Tapia NC, Ostos ME, Esquivel MU. Prevalence of NAFLD and metabolic syndrome in asymtomatics subjects. Rev Gastroenterol Mex 2006; 71: 453-459.
4. Browning JD, Szczepaniak LS, Dobbins R, Nuremberg P, Horton JD, Cohen JC, Grundy SM, et al. Prevalence of hepatic steatosis in an urban population in the United States: impact of ethnicity. Hepatology 2004; 40: 1387-1395.
5. Mendez-Sanchez N, Chavez-Tapia NC, Uribe M. An update on non-alcoholic fatty liver disease. Rev Invest Clin 2004; 56: 72-82. 6. Clark JM, Brancati FL, Diehl AM. The prevalence and etiology of elevated aminotransferase levels in the United States. Am J Gastroenterol 2003; 98: 960-967.
7. Mendez-Sanchez N, Arrese M, Zamora-Valdes D, Uribe M. Cur-rent concepts in the pathogenesis of nonalcoholic fatty liver dis-ease. Liver Int 2007; 27: 423-433.
8. Clark JM. The epidemiology of nonalcoholic fatty liver disease in adults. J Clin Gastroenterol 2006;40 Suppl 1: S5-10. 9. Mendez-Sanchez N, Villa AR, Chavez-Tapia NC,
Ponciano-Rodriguez G, Almeda-Valdes P, Gonzalez D, Uribe M. Trends in liver disease prevalence in Mexico from 2005 to 2050 through mortality data. Ann Hepatol 2005; 4: 52-55.
10. Saadeh S, Younossi ZM, Remer EM, Gramlich T, Ong JP, Hurley M, Mullen KD, et al. The utility of radiological imaging in nonal-coholic fatty liver disease. Gastroenterology 2002; 123: 745-750. 11. Mendez-Sanchez N, Motola-Kuba D, Bahena-Aponte J, Chavez-Tapia N, Pichardo-Bahena R, Uribe M. Hypertransaminasemia and severe hepatic steatosis without inflammation. A case report. Ann Hepatol 2003; 2: 183-185.
12. Mendez-Sanchez N, Chavez-Tapia NC, Villa AR, Sanchez-Lara K, Zamora-Valdes D, Ramos MH, Uribe M. Adiponectin as a protective factor in hepatic steatosis. World J Gastroenterol 2005; 11: 1737-1741.
13. Mendez-Sanchez N, Chavez-Tapia NC, Zamora-Valdes D, Medina-Santillan R, Uribe M. Hepatobiliary diseases and insulin resistance. Curr Med Chem 2007; 14: 1988-1999.
14. Mendez-Sanchez N, Chavez-Tapia NC, Zamora-Valdes D, Uribe M. Adiponectin, structure, function and pathophysiological im-plications in non-alcoholic fatty liver disease. Mini Rev Med Chem 2006; 6: 651-656.
15. Mendez-Sanchez N, Chavez-Tapia NC, Medina-Santillan R, Villa AR, Sanchez-Lara K, Ponciano-Rodriguez G, Ramos MH, et al. The efficacy of adipokines and indices of metabolic syndrome as predictors of severe obesity-related hepatic steatosis. Dig Dis Sci 2006; 51: 1716-1722.
16. Marchesini G, Brizi M, Morselli-Labate AM, Bianchi G, Bugianesi E, McCullough AJ, Forlani G, et al. Association of nonalcoholic fatty liver disease with insulin resistance. Am J Med 1999; 107: 450-455.
Table I. Advantages and disadvantages of current noninvasive methods of quantifying hepatic fat content.
US CT MRI
Assessment Qualitative Qualitative and quantitative Qualitative and quantitative
Cost Low cost Medium cost Expensive
Method Visual comparison Liver attenuation, liver-spleen Spectroscopy, in- and attenuation ratio out-of-phase, T2-FatSat
Guide for liver biopsy Yes Yes Yes
Accuracy Depends on operator and Not operator dependent Not operator dependent patient features
Acquisition time Variable, 5–20 min, depends Less than 5 min 10–15 min (1 univoxel spectrum
on operator can last less than 1 min)
Availability Equipment present Equipment present in Software not available in most hospitals most hospitals in all MRI units
Use of radiation None Ionizing radiation None
Nephrotoxic contrast agent None Some methods use iodide None
contrast agents
Threshold of detection Patients with more Patients with more than Detects grade I than 30% steatosis 30% steatosis steatosis (5–30%)
Distinguishes NASH from NAFLD No No No (some sequences can
E Roldan-Valadez.Imaging techniques for assessing hepatic fat content in nonalcoholic fatty liver disease
www.medigraphic.com
17. Marchesini G, Brizi M, Bianchi G, Tomassetti S, Bugianesi E,Lenzi M, McCullough AJ, et al. Nonalcoholic fatty liver disease: a feature of the metabolic syndrome. Diabetes 2001; 50: 1844-1850.
18. Seidell JC. Obesity, insulin resistance and diabetes—a worldwide epidemic. Br J Nutr 2000; 83 Suppl 1: S5-8.
19. Rojas R, Palma O, I. Q: Salud Adultos. In: Olaiz G, Rivera J, Shamah T, Rojas R, Villalpando S, Hernández M, J. S, eds. Encuesta Nacional de Salud y Nutrición 2006. Segunda, octubre de 2006 ed. Cuernavaca, Morelos, México: Instituto Nacional de Salud Pública, 2006: 75-82.
20. Hedley AA, Ogden CL, Johnson CL, Carroll MD, Curtin LR, Flegal KM. Prevalence of overweight and obesity among US children, adolescents, and adults, 1999-2002. JAMA 2004; 291: 2847-2850.
21. Ford ES, Giles WH, Dietz WH. Prevalence of the metabolic syn-drome among US adults: findings from the third National Health and Nutrition Examination Survey. JAMA 2002; 287: 356-359. 22. Tolman KG, Fonseca V, Tan MH, Dalpiaz A. Narrative review: hepatobiliary disease in type 2 diabetes mellitus. Ann Intern Med 2004; 141: 946-956.
23. Bugianesi E, Leone N, Vanni E, Marchesini G, Brunello F, Carucci P, Musso A, et al. Expanding the natural history of nonalcoholic steatohepatitis: from cryptogenic cirrhosis to hepatocellular car-cinoma. Gastroenterology 2002; 123: 134-140.
24. Marcos A, Fisher RA, Ham JM, Olzinski AT, Shiffman ML, Sanyal AJ, Luketic VA, et al. Selection and outcome of living donors for adult to adult right lobe transplantation. Transplanta-tion 2000; 69: 2410-2415.
25. Castera L, Negre I, Samii K, Buffet C. Pain experienced during percutaneous liver biopsy. Hepatology 1999; 30: 1529-1530. 26. Grant A, Neuberger J. Guidelines on the use of liver biopsy in
clinical practice. British Society of Gastroenterology. Gut 1999; 45 Suppl 4: IV1-IV11.
27. Ryan CK, Johnson LA, Germin BI, Marcos A. One hundred consecutive hepatic biopsies in the workup of living donors for right lobe liver transplantation. Liver Transpl 2002; 8: 1114-1122.
28. Mehta SR, Thomas EL, Bell JD, Johnston DG, Taylor-Robinson SD. Non-invasive means of measuring hepatic fat content. World J Gastroenterol 2008; 14: 3476-3483.
29. Rinella ME, McCarthy R, Thakrar K, Finn JP, Rao SM, Koffron AJ, Abecassis M, et al. Dual-echo, chemical shift gradient-echo magnetic resonance imaging to quantify hepatic steatosis: Impli-cations for living liver donation. Liver Transpl 2003; 9: 851-856. 30. Wenker JC, Baker MK, Ellis JH, Glant MD. Focal fatty infiltra-tion of the liver: demonstrainfiltra-tion by magnetic resonance imaging. AJR Am J Roentgenol 1984; 143: 573-574.
31. Valls C, Iannacconne R, Alba E, Murakami T, Hori M, Passariello R, Vilgrain V. Fat in the liver: diagnosis and characterization. Eur Radiol 2006; 16: 2292-2308.
32. Mottin CC, Moretto M, Padoin AV, Swarowsky AM, Toneto MG, Glock L, Repetto G. The role of ultrasound in the diagnosis of hepatic steatosis in morbidly obese patients. Obes Surg 2004; 14: 635-637.
33. Joy D, Thava VR, Scott BB. Diagnosis of fatty liver disease: is biopsy necessary? Eur J GastroenterolHepatol 2003; 15: 539-543. 34. Palmentieri B, de Sio I, La Mura V, Masarone M, Vecchione R,
Bruno S, Torella R, et al. The role of bright liver echo pattern on ultrasound B-mode examination in the diagnosis of liver steato-sis. Dig Liver Dis 2006; 38: 485-489.
35. Hepburn MJ, Vos JA, Fillman EP, Lawitz EJ. The accuracy of the report of hepatic steatosis on ultrasonography in patients infected with hepatitis C in a clinical setting: a retrospective observational study. BMC Gastroenterol 2005; 5: 14.
36. Mathiesen UL, Franzen LE, Aselius H, Resjo M, Jacobsson L, Foberg U, Fryden A, et al. Increased liver echogenicity at ultra-sound examination reflects degree of steatosis but not of fibrosis in asymptomatic patients with mild/moderate abnormalities of liver transaminases. Dig Liver Dis 2002; 34: 516-522.
37. Joseph AE, Saverymuttu SH, al-Sam S, Cook MG, Maxwell JD. Comparison of liver histology with ultrasonography in assessing diffuse parenchymal liver disease. Clin Radiol 1991; 43: 26-31. 38. Debongnie JC, Pauls C, Fievez M, Wibin E. Prospective evalua-tion of the diagnostic accuracy of liver ultrasonography. Gut 1981; 22: 130-135.
39. Saverymuttu SH, Joseph AE, Maxwell JD. Ultrasound scanning in the detection of hepatic fibrosis and steatosis. Br Med J (Clin Res Ed) 1986; 292: 13-15.
40. Iwasaki M, Takada Y, Hayashi M, Minamiguchi S, Haga H, Maetani Y, Fujii K, et al. Noninvasive evaluation of graft steato-sis in living donor liver transplantation. Transplantation 2004; 78: 1501-1505.
41. Ricci C, Longo R, Gioulis E, Bosco M, Pollesello P, Masutti F, Croce LS, et al. Noninvasive in vivo quantitative assessment of fat content in human liver. J Hepatol 1997; 27: 108-113. 42. Nishino M, Hayakawa K, Nakamura Y, Morimoto T, Mukaihara
S. Effects of tamoxifen on hepatic fat content and the develop-ment of hepatic steatosis in patients with breast cancer: high fre-quency of involvement and rapid reversal after completion of tamoxifen therapy. AJR Am J Roentgenol 2003; 180: 129-134. 43. Bydder GM, Chapman RW, Harry D, Bassan L, Sherlock S, Kreel L. Computed tomography attenuation values in fatty liver. J Comput Tomogr 1981; 5: 33-35.
44. Kodama Y, Ng CS, Wu TT, Ayers GD, Curley SA, Abdalla EK, Vauthey JN, et al. Comparison of CT methods for determining the fat content of the liver. AJR Am J Roentgenol 2007; 188: 1307-1312.
45. Ducommun JC, Goldberg HI, Korobkin M, Moss AA, Kressel HY. The relation of liver fat to computed tomography numbers: a preliminary experimental study in rabbits. Radiology 1979; 130: 511-513.
46. Piekarski J, Goldberg HI, Royal SA, Axel L, Moss AA. Differ-ence between liver and spleen CT numbers in the normal adult: its usefulness in predicting the presence of diffuse liver disease. Radiology 1980; 137: 727-729.
47. Johnston RJ, Stamm ER, Lewin JM, Hendrick RE, Archer PG. Diagnosis of fatty infiltration of the liver on contrast enhanced CT: limitations of liver-minus-spleen attenuation difference mea-surements. Abdom Imaging 1998; 23: 409-415.
48. Jacobs JE, Birnbaum BA, Shapiro MA, Langlotz CP, Slosman F, Rubesin SE, Horii SC. Diagnostic criteria for fatty infiltration of the liver on contrast-enhanced helical CT. AJR Am J Roentgenol 1998; 171: 659-664.
49. Panicek DM, Giess CS, Schwartz LH. Qualitative assessment of liver for fatty infiltration on contrast-enhanced CT: is muscle a better standard of reference than spleen? J Comput Assist Tomogr 1997; 21: 699-705.
50. Park SH, Kim PN, Kim KW, Lee SW, Yoon SE, Park SW, Ha HK, et al. Macrovesicular hepatic steatosis in living liver donors: use of CT for quantitative and qualitative assessment. Radiology 2006; 239: 105-112.
51. Brancatelli G. Science to practice: Should biopsy be performed in potential liver donors when unenhanced CT shows an unacceptable degree of steatosis for transplantation? Radiology 2006; 239: 1-2. 52. Reeder SB, Ranallo F, Taylor AJ. CT and MRI for determining
hepatic fat content. AJR Am J Roentgenol 2008; 190: W167; author reply W168.
53. Birnbaum BA, Hindman N, Lee J, Babb JS. Multi-detector row CT attenuation measurements: assessment of intra- and interscanner variability with an anthropomorphic body CT phan-tom. Radiology 2007; 242: 109-119.
54. George DK, Goldwurm S, MacDonald GA, Cowley LL, Walker NI, Ward PJ, Jazwinska EC, et al. Increased hepatic iron concen-tration in nonalcoholic steatohepatitis is associated with increased fibrosis. Gastroenterology 1998; 114: 311-318.
55. Taylor-Robinson SD. Applications of magnetic resonance spec-troscopy to chronic liver disease. Clin Med 2001; 1: 54-60. 56. Cox IJ. Development and applications of in vivo clinical magnetic
www.medigraphic.com
57. Danet IM, Semelka RC, Braga L. MR imaging of diffuse liverdisease. Radiol Clin North Am 2003; 41: 67-87.
58. Levenson H, Greensite F, Hoefs J, Friloux L, Applegate G, Silva E, Kanel G, et al. Fatty infiltration of the liver: quantification with phase-contrast MR imaging at 1.5 T vs biopsy. AJR Am J Roentgenol 1991; 156: 307-312.
59. Pilleul F, Chave G, Dumortier J, Scoazec JY, Valette PJ. Fatty infiltration of the liver. Detection and grading using dual T1 gradient echo sequences on clinical MR system. Gastroenterol Clin Biol 2005; 29: 1143-1147.
60. Kim SH, Lee JM, Han JK, Lee JY, Lee KH, Han CJ, Jo JY, et al. Hepatic macrosteatosis: predicting appropriateness of liver dona-tion by using MR imaging—correladona-tion with histopathologic find-ings. Radiology 2006; 240: 116-129.
61. Hussain HK, Chenevert TL, Londy FJ, Gulani V, Swanson SD, McKenna BJ, Appelman HD, et al. Hepatic fat fraction: MR im-aging for quantitative measurement and display—early experi-ence. Radiology 2005; 237: 1048-1055.
62. Siegelman ES, Rosen MA. Imaging of hepatic steatosis. Semin Liver Dis 2001; 21: 71-80.
63. Thomas EL, Hamilton G, Patel N, O’Dwyer R, Dore CJ, Goldin RD, Bell JD, et al. Hepatic triglyceride content and its relation to body adiposity: a magnetic resonance imaging and proton mag-netic resonance spectroscopy study. Gut 2005; 54: 122-127. 64. Kotronen A, Westerbacka J, Bergholm R, Pietilainen KH,
Yki-Jarvinen H. Liver fat in the metabolic syndrome. J Clin Endocrinol Metab 2007; 92: 3490-3497.
65. Seppala-Lindroos A, Vehkavaara S, Hakkinen AM, Goto T, Westerbacka J, Sovijarvi A, Halavaara J, et al. Fat accumulation in the liver is associated with defects in insulin suppression of glucose production and serum free fatty acids independent of obesity in normal men. J Clin Endocrinol Metab 2002; 87: 3023-3028.
66. Kim H, Taksali SE, Dufour S, Befroy D, Goodman TR, Petersen KF, Shulman GI, et al. Comparative MR study of hepatic fat quan-tification using single-voxel proton spectroscopy, two-point dixon and three-point IDEAL. Magn Reson Med 2008; 59: 521-527. 67. Gulizia R, Ferraioli G, Filice C. Open questions in the assessment
of liver fibrosis using real-time elastography. AJR Am J Roentgenol 2008; 190: W370-371; author reply W372-373. 68. Yamanaka N, Okamoto E, Toyosaka A, Ohashi S, Tanaka N.
Consistency of human liver. J Surg Res 1985; 39: 192-198. 69. Nishizaki T, Matsumata T, Kamakura T, Adachi E, Sugimachi K.
Significance of intraoperative measurement of liver consistency prior to hepatic resection. Hepatogastroenterology 1995; 42: 5-8. 70. Kusaka K, Harihara Y, Torzilli G, Kubota K, Takayama T, Makuuchi M, Mori M, et al. Objective evaluation of liver consis-tency to estimate hepatic fibrosis and functional reserve for hepa-tectomy. J Am Coll Surg 2000; 191: 47-53.
71. Carter FJ, Frank TG, Davies PJ, McLean D, Cuschieri A. Mea-surements and modelling of the compliance of human and por-cine organs. Med Image Anal 2001; 5: 231-236.
72. Yeh WC, Li PC, Jeng YM, Hsu HC, Kuo PL, Li ML, Yang PM, et al. Elastic modulus measurements of human liver and correlation with pathology. Ultrasound Med Biol 2002; 28: 467-474. 73. Ophir J, Cespedes I, Ponnekanti H, Yazdi Y, Li X. Elastography:
a quantitative method for imaging the elasticity of biological tissues. Ultrason Imaging 1991; 13: 111-134.
74. Sanada M, Ebara M, Fukuda H, Yoshikawa M, Sugiura N, Saisho H, Yamakoshi Y, et al. Clinical evaluation of sonoelasticity mea-surement in liver using ultrasonic imaging of internal forced low-frequency vibration. Ultrasound Med Biol 2000; 26: 1455-1460.
75. Sandrin L, Tanter M, Catheline S, Fink M. Shear modulus imag-ing with 2-D transient elastography. IEEE Trans Ultrason Ferroelectr Freq Control 2002; 49: 426-435.
76. Sandrin L, Tanter M, Gennisson JL, Catheline S, Fink M. Shear elasticity probe for soft tissues with 1-D transient elastography. IEEE Trans Ultrason Ferroelectr Freq Control 2002; 49: 436-446.
77. Sandrin L, Fourquet B, Hasquenoph JM, Yon S, Fournier C, Mal F, Christidis C, et al. Transient elastography: a new noninvasive method for assessment of hepatic fibrosis. Ultrasound Med Biol 2003; 29: 1705-1713.
78. Saito H, Tada S, Nakamoto N, Kitamura K, Horikawa H, Kurita S, Saito Y, et al. Efficacy of non-invasive elastometry on staging of hepatic fibrosis. Hepatol Res 2004; 29: 97-103.
79. Friedrich-Rust M, Ong MF, Herrmann E, Dries V, Samaras P, Zeuzem S, Sarrazin C. Real-time elastography for noninvasive assessment of liver fibrosis in chronic viral hepatitis. AJR Am J Roentgenol 2007; 188: 758-764.
80. Ziol M, Handra-Luca A, Kettaneh A, Christidis C, Mal F, Kazemi F, de Ledinghen V, et al. Noninvasive assessment of liver fibrosis by measurement of stiffness in patients with chronic hepatitis C. Hepatology 2005; 41: 48-54.
81. Castera L, Vergniol J, Foucher J, Le Bail B, Chanteloup E, Haaser M, Darriet M, et al. Prospective comparison of transient elastography, Fibrotest, APRI, and liver biopsy for the assess-ment of fibrosis in chronic hepatitis C. Gastroenterology 2005; 128: 343-350.
82. Saftoiu A, Gheonea DI, Ciurea T. Hue histogram analysis of real-time elastography images for noninvasive assessment of liver fibrosis. AJR Am J Roentgenol 2007; 189: W232-233. 83. Muthupillai R, Lomas DJ, Rossman PJ, Greenleaf JF, Manduca
A, Ehman RL. Magnetic resonance elastography by direct visu-alization of propagating acoustic strain waves. Science 1995; 269: 1854-1857.
84. Muthupillai R, Rossman PJ, Lomas DJ, Greenleaf JF, Riederer SJ, Ehman RL. Magnetic resonance imaging of transverse acoustic strain waves. Magn Reson Med 1996; 36: 266-274.
85. Rouviere O, Yin M, Dresner MA, Rossman PJ, Burgart LJ, Fidler JL, Ehman RL. MR elastography of the liver: preliminary results. Radiology 2006; 240: 440-448.
86. Kruse SA, Smith JA, Lawrence AJ, Dresner MA, Manduca A, Greenleaf JF, Ehman RL. Tissue characterization using magnetic resonance elastography: preliminary results. Phys Med Biol 2000; 45: 1579-1590.
87. Dresner MA, Rose GH, Rossman PJ, Muthupillai R, Manduca A, Ehman RL. Magnetic resonance elastography of skeletal muscle. J Magn Reson Imaging 2001; 13: 269-276.
88. Fishbein MH, Gardner KG, Potter CJ, Schmalbrock P, Smith MA. Introduction of fast MR imaging in the assessment of he-patic steatosis. Magn Reson Imaging 1997; 15: 287-293. 89. Dixon JB, Bhathal PS, O’Brien PE. Nonalcoholic fatty liver