arXiv:1202.1184v1 [astro-ph.HE] 6 Feb 2012
Correlated X-ray/Ultraviolet/Optical variability in the very low
mass AGN NGC 4395
D. T. Cameron,
1⋆I. M
cHardy,
1T. Dwelly,
1E. Breedt,
2P. Uttley,
1P. Lira,
3P. Arevalo,
41School of Physics and Astronomy, University of Southampton, Southampton, S017 1BJ. UK 2Department of Physics, University of Warwick, Coventry, CV4 7AL. UK
3Departmento de Astronom´ıa, Universidad de Chile, Camino del Observatorio 1515, Santiago, Chile 4Departmento de Ciencias Fisicas, Universidad Andres Bello, Av. Republica 252, Santiago, Chile
7th February 2012
ABSTRACT
We report the results of a one year Swift X-ray/UV/optical programme monitoring the dwarf Seyfert nucleus in NGC 4395 in 2008–2009. The UV/optical flux from the nucleus was found to vary dramatically over the monitoring period, with a similar pattern of variation in each of the observed UV/optical bands (spanning 1900 – 5500 ˚A). In particular, the luminosity of NGC 4395 in the 1900 ˚A band changed by more than a factor of eight over the monitor-ing period. The fractional variability was smaller in the UV/optical bands than that seen in the X-rays, with the X-ray/optical ratio increasing with increasing flux. Pseudo-instantaneous flux measurements in the X-ray and each UV/optical band were well correlated, with cross correlation coefficients of>0.7, significant at 99.9 per cent confidence. Archival Swift
obser-vations from 2006 sample the intra-day X-ray/optical variability on NGC 4395. These archival data show a very strong correlation between the X-ray andbbands, with a cross-correlation coefficient of 0.84 (significant at>99per cent confidence). The peak in the cross correlation
function is marginally resolved and asymmetric, suggesting that X-rays lead thebband, but by 61 hour. In response to recent (August 2011) very high X-ray flux levels from NGC 4395 we triggered Swift ToO observations, which sample the intra-hour X-ray/UV variability. These observations indicate, albeit with large uncertainties, a lag of the 1900 ˚A band behind the X-ray flux of∼400 s. The tight correlation between the X-ray and UV/optical lightcurves, together with the constraints we place on lag time-scale are consistent with the UV/optical variability of NGC 4395 being primarily due to reprocessing of X-ray photons by the accre-tion disc.
Key words: accretion, accretion discs – galaxies: NGC 4395 – galaxies: Seyfert
1 INTRODUCTION
Almost since their discovery, active galactic nuclei (AGN) have been noted to be variable objects, with flux variations seen on a wide range of time-scales and across the observable electro-magnetic spectrum. However, the origin of the ultraviolet (UV) and optical variability in AGN is still a matter of debate. Two mechanisms that have gained support are i) reprocessing of X-ray emission by the accretion disc (Krolik et al. 1991; Wanders et al. 1997; Collier et al. 1998; Sergeev et al. 2005; Breedt et al. 2009, 2010), and ii) intrinsic variations of the thermal disc emission (Ar´evalo et al. 2008; Lira et al. 2011). In scenario i) the X-ray fluc-tuations drive and lead the UV/optical variations, however in ii), the perturbations are produced in the disc itself, for example, by inwardly propagating accretion rate variations.
In the case of the X-ray reprocessing model, the optical/UV
⋆ E-mail: [email protected]
variations are expected to lag behind the X-ray variations, where the length of the lag is determined by the light travel time from the central compact X-ray emission region to the optical/UV emission region in the disc. Simply from conservation of energy, the absolute luminosity variation in the optical/UV should be smaller than the luminosity variation seen in the (driving) X-ray band. For AGN
having black hole masses in the range106–108
M⊙(as typically
seen in nearby Seyfert galaxies) the lag time-scales are expected to range from seconds to a few days (e.g. Breedt et al. 2009, 2010). The X-ray to UV/optical lag time-scales are expected to increase with observed wavelength (e.g. Cackett et al. 2007), because the longer wavelength emission is produced at larger radii in the disc.
accre-tion discs about black holes having masses106–108
M⊙(Czerny
2006).
Of course it is likely that both of these processes are occurring simultaneously within an AGN (e.g. Ar´evalo et al. 2008, 2009), but we can hope to test which of these processes is causing the
ma-jority of the UV/optical variation. The nearby Seyfert nucleus in
NGC 4395 is perhaps the ideal laboratory in which to test these competing hypotheses, because it is dramatically variable across the X-ray/UV/optical bands, and is thought to contain a relatively low mass black hole, meaning that the characteristic time-scales of variations are well matched to the typical durations of intensive
observing campaigns (i.e.61year).
NGC 4395 is a Seyfert 1.8/1.9 galaxy (Filippenko & Sargent 1989) with a black hole mass estimated from reverberation
map-ping, of(3.6±1.1)×105
M⊙ (Peterson et al. 2005). A
some-what smaller black hole mass is suggested by the apparent lack of a significant galactic bulge in NGC 4395, and also from the very short characteristic time-scale measured in the X-ray band (Vaughan et al. 2005). The absolute upper limit on the total mass within the central 3.9 pc, including any stellar contribution, is 6.6×10⁶
M⊙, derived from stellar velocity dispersion
measure-ments Filippenko & Ho (2003). These black hole mass estimates rank NGC 4395 as one of the very lowest mass AGN known. The distance to the galaxy, derived directly from observations of
Cepheid variables, is4.2±0.3Mpc (Thim et al. 2004). The
prox-imity of NGC 4395 means that although its luminosity is low in all wavebands, it is bright enough in the X-ray/UV/optical to be observed with short Swift snapshots. The very low Galactic
ex-tinction, E(B −V) = 0.017 mag, in the direction of NGC 4395
(Schlegel, Finkbeiner & Davis 1998) means that it is particularly well placed from the point of view of UV observations, which will not be heavily attenuated.
NGC 4395 has long been noted as a particularly variable AGN, exhibiting large amplitude variations on short time-scales, across many wavebands. For example, a continuous single orbit (113 ks) XMM-Newton observation was analysed by Vaughan et al. (2005). This observation showed the most extreme X-ray variabil-ity ever seen in an AGN with a fractional root-mean-squared (RMS)
amplitude (Fvar) of more than 100 per cent in the soft X-ray band
(0.2–0.7 keV). Simultaneous optical and near-infrared observations are reported by Minezaki et al. (2006) who estimate the distance to
the inner face of the torus in NGC 4395 as∼1 lightday providing an
upper limit to the size of the accretion disc. The broad line region
radius was determined by Peterson et al. (2005, 2006) to be∼0.04
pc.
Many of the recent dedicated monitoring campaigns for NGC 4395 have measured lightcurves from either a single, or just a few bands spaced closely in wavelength, and have typically not examined the correlated broadband variability behaviour. For in-stance, the Optical Monitor imaging data during the long
XMM-Newton observation are not well suited to a X-ray/UV/optical
vari-ability analysis. Older soft X-ray observations with ROSAT, to-gether with a variety of ground based optical and infrared obser-vations, were presented by Lira et al. (1999). They reported large X-ray flux changes between observations, e.g. by a factor of 2 in 15 days along with 20 per cent changes in optical flux from night to night. However these authors were unable to comment on the correlation between variations in the optical and X-ray bands due to the non-simultaneity of their data.
The best dataset previously available that probes the short time-scale relationship between the X-ray and UV/optical emis-sion in NGC 4395 has been carried out with coordinated Chandra,
Hubble Space Telescope (HST) and ground based optical observa-tions (e.g. O’Neill et al. 2006, Desroches et al. 2006), in which the
UV and X-ray datasets overlap by∼10 ks. After cross-correlating
the 1350 ˚A and 0.4–8 keV lightcurves, O’Neill et al. (2006) find
a UV lag consistent with zero with an uncertainty of about 25
minutes. Desroches et al. (2006) present ground based opticalB
andV band observations taken in parallel with these Chandra
ob-servations. The X-ray to optical correlation is rather weak, with a rather flat cross-correlation function (CCF) having a peak
cor-relation coefficient of∼0.2. Desroches et al. (2006) estimate that
the optical lightcurves lag the X-rays by44±13minutes. The
multi-wavelength results from the Chandra/HST UV/optical cam-paign are consistent with a scenario where the optical variations are primarily due to reprocessed X-ray emission. However, these lightcurves span only a few hours, so these observations clearly do not fully sample all of NGC 4395’s longterm behaviour. Also, it should be noted that during these observations NGC 4395 was rather faint in the X-ray, with an average flux less than half
of that during the previous ∼100 ks XMM-Newton observations
(Vaughan et al. 2005). The low flux levels and relatively weak vari-ability in the X-ray, UV and optical lightcurves reduces the vari-ability of the Chandra/HST/optical dataset to constrain the physical para-meters of the system.
In order to improve our understanding of the X-ray/UV/optical connection we have carried out a dedicated year-long cam-paign monitoring NGC 4395 using the NASA Swift observatory (Gehrels et al. 2004). We present the results of these observations which we have analysed together with previous archival Swift X-ray and optical monitoring which intensively samples the intra-day X-ray/optical variability. These data are by far the most extens-ive joint X-ray/UV/optical observations ever made of NGC 4395 and, indeed, of almost any AGN. The multi-band Swift data al-low us to study the correlations and lags between X-ray and UV/optical bands in unprecedented detail and on time-scales from a few hundred seconds up to one year. We note that the Swift X-ray lightcurve for NGC 4395 has previously been presented by Kaaret & Feng (2009). In this paper we concentrate on the cross correlation between the X-ray, UV and optical wavebands; a fuller analysis of the Swift X-ray dataset will be presented separately (Dwelly et al. in prep).
The details of the Swift observations are presented in Section 2 and the resulting lightcurves are presented in Section 3. In Section 4 we present the cross-correlation results and we discuss their im-plications. In Section 5 we compare the predictions of the standard accretion disc model to the observed behaviour. We summarise our results in Section 6 and present our conclusions.
2 SWIFT OBSERVATIONS
2.1 The 2008–2009 long term dataset
We monitored NGC 4395 with Swift with∼1 ks of exposure time
approximately every 2 days during the period 2008 April to 2009 March. There was a break from 2008 August 6th to 2008 October 21st when NGC 4395 was too close to the Sun, thus separating the observations into two well-sampled sections (referred to hereafter as sections 1 and 2). Useful data were collected by both the X-Ray Telescope (XRT, Burrows et al. 2005) and the Ultraviolet/Optical
Telescope (UVOT, Roming et al. 2005). Each ∼1 ks observation
was sub-divided into up to eight separate ‘visits’, with individual
were made. Within each visit, the UVOT observations were taken
through theuvw2,v,u, andbfilters, in that order, with exposure
time ratios of approximately 4:1:1:1 for theuvw2,v,uandb
fil-ters respectively. The majority of the UVOT data were obtained in ‘event’ mode where the time of arrival and location of each photon is recorded, meaning that we can post-process these data to make images/lightcurves in time bins of arbitrary length.
2.2 The 2006 intensive short time-scale dataset
We have also analysed a set of intensive Swift observations of NGC 4395 which were made from 2006 March 6th to 2006 March 10th, which we refer to hereafter as the ‘2006’ observations.
Throughout this 5 day monitoring period one Swift visit of∼1 ks
was made per orbit (i.e. once every∼96 minutes), totalling 61
vis-its. All of the UVOT observations of NGC 4395 during this period
were made through thebfilter in ‘image’ mode, in which a single
UVOT integration was obtained per visit.
2.3 The 2011 target of opportunity dataset
Very recently (August 2011) we have triggered a set of Swift ToO observations of NGC 4395 in response to a high X-ray flux state.
These data consist of 6 visits spanning ∼13 hours, and most
im-portantly, include two relatively long visits of length∼2500 s. The
UVOT was operated with theuvw2filter and in event mode during
these ToO observations.
2.4 Data Reduction Procedure
The UVOT raw data were cleaned, flat-fielded and corrected for mod-8 (fixed pattern noise due to sub-pixel centralisation) noise
using the standard Swift UVOT pipelines1. From an initial
examin-ation of the UVOT images, we noticed that a higher than expected fraction of the visits were affected by poor pointing stability caused by loss of guide star lock, probably due to the scarcity of bright stars at the high Galactic latitude of NGC 4395. Fortunately, the major-ity of the affected observations were made in ‘event mode’ allowing the spacecraft attitude information to be corrected on 10–20 second time-scales by tracking the apparent locations of bright stars within the UVOT field of view. For each Swift observation a series of short
snapshot images (10 seconds for UVOT observations in theu,b
andvfilters, and 20 seconds for theuvw2filter) were created from
the raw UVOT event lists. Each snapshot was searched for point-like sources, the apparent positions of which were cross-correlated
with a list of bright (u′
AB < 18) reference stars (obtained from
the SDSS catalogue server2). A linear offset (in RA and Dec) to
the nominal pointing of the snapshot was then calculated from the crossmatches. A new spacecraft attitude file was then created for each Swift observation by applying a filtered and interpolated ver-sion of the snapshot offsets to the original spacecraft attitude file. Our astrometric correction method was adapted from routines de-veloped by S. R. Oates for the Swift Gamma Ray Burst catalogue (Roming et al. 2009). This astrometric correction process was seen to improve the registration of UVOT images that were not affected by guide star lock, and so for completeness was applied uniformly to the entire UVOT dataset. For those visits where the UVOT data
1 http://swift.gsfc.nasa.gov/docs/swift/analysis/ 2 http://cas.sdss.org/astrodr7/en/
were obtained in ‘image’ mode, we calculated only a single point-ing correction possible per UVOT exposure. We discarded the data from the few visits where the UVOT was in image mode which also showed signs of star trailing.
The Swift-XRT data reduction procedure will be fully de-scribed in Dwelly et al. (in prep). A brief description of our method can be found in Section 2 of Fabian et al. (2011). We note that throughout this work we use X-ray lightcurves that have been cor-rected for background, vignetting, aperture losses and for the ef-fects of bad pixels.
3 ULTRAVIOLET AND OPTICAL VARIABILITY
Aperture photometry was performed using the Swift UVOT tool
UVOTSOURCE3, with a 3 arcsec radius aperture. The
back-ground region was chosen to be representative of the sky near the
galaxy. Previous HST-WFPC2 (F815W, ∼I band) observations
have revealed that in addition to the central point source, there is a significant galactic contribution within the innermost few arc-seconds of NGC 4395 (Filippenko & Ho 2003) which is expected to contaminate our UVOT aperture photometry of the nucleus. Note that the point spread function (PSF) of UVOT has a FWHM of
∼2.5 arcsec. We have therefore used archival HST observations in
the F330W filter (close to UVOTuband), the F439W filter (close to
UVOTbband) and the F555W filter (close to UVOTvband), in
or-der to estimate the constant contribution from non-nuclear light to our UVOT aperture fluxes. This is possible as the HST resolution is
∼50×better than UVOT. We downloaded processed images from
the HST Legacy Archive website4. We used the GALFIT software
(Peng et al. 2002, 2010) to fit a galaxy profile model to the cent-ral regions (an 18 arcsec by 15 arcsec rectangle) of NGC 4395, adopting the three profile model components of Filippenko & Ho (2003), namely a nuclear point source, a Sersic component repres-enting the nuclear stellar cluster, and an exponential disc. Bright irregular features and Galactic stars were masked out during the fitting process. The contribution from the nuclear point source com-ponent was subtracted from the image, which was then convolved with the appropriate UVOT PSF model taken from the calibtion database. Finally, the non-nuclear flux within the 3 arcsec ra-dius science aperture was calculated from the convolved image, converting to physical units using the standard HST zeropoints. We measure the following non-nuclear flux density contributions
within the UVOT science aperture:4.9×10⁻¹⁶erg cm−2s−1A˚−1
in theuband,4.9×10−16
erg cm−2s−1A˚−1 in thebband and
5.0×10⁻¹⁶
erg cm−2s−1A˚−1in thevband. No suitable high
res-olution UV images were available, so to estimate the non-nuclear
flux contamination in theuvw2band we normalised the Scd galaxy
template of Rowan-Robinson et al. (2008) to the non-nuclear
con-tribution in theb band, giving an expected non-nuclear flux of
4.8×10⁻¹⁶
erg cm−2s−1A˚−1 in the uvw2 band. We subtract
these non-nuclear flux estimates from the aperture fluxes calculated within UVOTSOURCE. We expect this procedure to be
accur-ate to around0.1×10−16
erg cm−2s−1A˚−1 based on the
differ-ence between results produced for subtractions using the 2 archived
HST images with the B-filter. Any systematic offset imprinted on
the UVOT data by this method will not effect the cross-correlation analysis performed in Section 4. However, any residual systematic
Table 1. Tests of the accuracy of our UVOT photometry as determined from
measurements of a star in the field of NGC 4395.Nis the number of sep-arate exposures considered for each filter,fis the mean flux of the star in each filter in units of10−15erg s−1cm−2A˚−1.|f
i−f|/σiis the mean
of the ratio of the measured photometric scatter to the nominal uncertain-ties reported by the UVOTSOURCE tool. Thecfare the mean aperture correction factors we measure for the star for a 3 arcsec radius aperture.
Filter uvw2 u b v
N 197 155 110 153
f 1.72 6.43 8.72 7.53
|fi−f|/σi 0.815 0.94 1.72 1.08
cf 1.17±0.03 1.10±0.01 1.10±0.01 1.10±0.01
flux offsets may effect the results of the accretion disc modelling discussed in Section 5.
In order to verify the stability of the UVOT photometry meas-ured by UVOTSOURCE and to refine the default aperture cor-rections, we have examined the lightcurves of a relatively isolated field star that has similar apparent magnitude to the nucleus of
NGC 4395. We extracteduvw2,u,bandvband lightcurves for this
star from the 2008–2009 UVOT dataset using 3 arcsecond apertures and an annular background region, ignored the few UVOT images where the star falls off the edge of the detector. We found that the UVOT photometry for this star is stable, with no obvious long-term drifts. We show a summary of the properties of the measured pho-tometry in Table 1. Note that the scatter of the measured fluxes in
each of theuvw2,uandvfilters are comparable to the the nominal
uncertainties estimated by the UVOTSOURCE tool. In thebfilter
the error estimates are on average 1.72 times smaller than the true photometric scatter, suggesting that the errors are underestimated for this filter. This additional error is included when the fluxes are corrected for the aperture size. We also measured the lightcurves of the star using the standard 5 arcsec radius aperture, for which the UVOT counts to flux density relation has been very accurately cal-ibrated (Poole et al. 2008; Breeveld et al. 2010). Using these values we measure aperture correction values for the 3 arcsec radius aper-ture. We find that the fraction of light in the 3 arcsec radius aperture
is marginally smaller for theuvw2filter than given by the
stand-ard Swift calibrated value (1.13, 1.10, 1.11, 1.09, in theuvw2,u,b
andvfilters respectively, Poole et al. 2008). However, we find that
the aperture corrections in theu,bandvfilters agree closely with
those given by the standard calibration. We use the aperture correc-tion values calculated for the test star to correct the 3 arcsec radius aperture photometry for NGC 4395.
The UVOT fluxes were corrected for the Galactic
redden-ing of E(B −V) = 0.017 mag, by applying the formulae from
Roming et al. (2009), to calculate the appropriate correction in each UVOT filter. The fully corrected UVOT lightcurves are presented in Fig. 1 together with the 2–10 keV XRT lightcurve.
3.1 Long-term variability
During the 2008–2009 observation period, NGC 4395 showed sig-nificant variability across all UVOT filters, Fig. 1. We calculated the
fractional root mean square amplitude (Fvar) separately for each of
the two contiguous sections of the lightcurve, and the results are shown in Table 2. The fractional variability for each filter and dur-ing both sections are consistent. This is expected for observations of similar lengths (Uttley & McHardy 2001). The peak-to-trough
Table 2. Central wavelength and fractional RMS variability for the
light-curves measured in each Swift UVOT filter.λis the central wavelength of the filter. Fvar1and Fvar2are the fractional root mean square variability for the 1st and 2nd sections of the 2008–2009 observations respectively.
Filter λ( ˚A) Fvar1 Fvar2
Figure 2. The UVOTbband, and XRT 2–10 keV light curves of NGC 4395 from the 2006 intensive monitoring data. One point is shown per Swift visit, which are typically separated by approximately 96 minutes. Note that the bband lightcurve is shown with a non-zero intercept (left hand scale) to emphasise the variations.
variation during section 1 is larger than in section 2, with theuvw2
band peak flux∼8×greater than the minimum flux. During
sec-tion 1 NGC 4395 reached a UV/optical flux approximately twice that of the typical peak fluxes of previous observations (Lira et al. 1999; O’Neill et al. 2006).
3.2 Short-term variability
We reduced the Swift UVOT and XRT data obtained during the in-tensive monitoring observations in 2006 in exactly the same way
as described in Section 3.1. Thebfilter and X-ray lightcurves are
shown in Fig. 2. The fractional RMS of thebband lightcurve
dur-ing this period was only0.122±0.006, which is less than a third
of variability observed during the 2008–2009 observations. This reduction is to be expected due to the red noise nature of AGN lightcurves, in which the largest amplitude of variability is found on the longest times-cales. However, significant variability with an amplitude greater than the measurement error is still seen on a time-scale of one or two orbits within the 2006 dataset.
3.3 Very short-term variability
For those UVOT data that were collected in ‘event’ mode we are able to generate lightcurves with arbitrary time binning. In prin-ciple, this permits us to investigate lags on time-scales shorter than
the length of a whole Swift visit (typically∼100–1000 s), but, due
0 1 2 3 4 5
UVOT Flux (10
-15
ergs cm
-2 s -1 A -1 )
00030373: 2006
00090053: April 2008 - March 2009 uvw2 bandu band b band v band
0 0.1 0.2 0.3 0.4
53800
XRT countrate (cts s
-1 )
54600 54650 54700 54750 54800 54850 54900
MJD (days)
Hard band (2-10 keV)
Figure 1. Top panel: Light curves of the nucleus of NGC 4395 for theuvw2,u,bandvUVOT bands. Bottom panel: Simultaneous 2–10 keV X-ray lightcurve
of NGC 4395, with countrates normalised to account for aperture losses, bad pixels and vignetting. A single datapoint is shown for each individual Swift visit.
one cannot usually sub-divide the Swift visits whilst retaining a high signal-to-noise lightcurve. However, during the brightest
out-bursts from NGC 4395 we measure countrates>0.5cts s−1in the
XRT, and so lightcurves with binning of 200 s are feasible. We first examined the short time-scale X-ray/UV/optical variability in the 2008–2009 dataset during the epochs when NGC 4395 was at its brightest. Unfortunately, because the exposure time in each Swift visit was spread between four UVOT filters the range of lag time-scales covered was small. It was not possible to derive a useful measure of the the lag between any single UVOT waveband and the X-ray band. There was a very small bump in the cross-correlation
hinting that the lag could be∼200s.
To improve on these tentative findings we instigated a new long term Swift monitoring programme, (starting April 2011 and scheduled to finish in March 2012) to search for (and respond to) occasions when NGC 4395 was sufficiently bright that X-ray/UV variability on 100–200 s time-scales could be detected with high confidence. Our monitoring revealed that NGC 4395 had again reached a high X-ray flux level in mid-August 2011 and so we
triggered a pre-approved ToO to obtain long (> 2ks) continuous
observations using just theuvw2filter. Unfortunately NGC 4395
was just about to enter the Swift Sun avoidance region, and so we
only obtained∼7ks of data. The resulting lightcurves are shown
in Fig. 3.
0 1 2 3
1000 1500
UVOT Flux (10
-15
ergs cm
-2 s -1 A -1)
5500 6000 6500 7000 7500
(MET - 334530000)/s
40000 40500 41000 41500 42000 0 0.25 0.5 0.75
XRT Count rate
uvw2 XRT (2-10 keV)
Figure 3. The UVOTuvw2band, and XRT 0.5–10 keV light curves of
NGC 4395 from the 2011 August ToO observations. One point is shown per 200s.
3.4 X-ray flux - UV/optical flux relation
We can see there is a tight correlation between the X-ray and UV/optical bands with very few outlying points.
In Fig. 4 we also show the X-ray versus b band
relation-ship measured during the 2006 intensive monitoring campaign. The 2006 data clearly follow a different track to the 2008–2009
measurements, with a much lowerb-band flux for a given X-ray
countrate, with an apparently flatter slope. As a first step in try-ing to understand the difference we parametrise the relationship
byFb = A+B FXC. HereA could be any constant component
in theb-band flux. The fitted value ofAis similar for both
data-sets (∼0.15±0.06mJy) and the exponents (C) are also similar
(∼0.6), but the slopes (B) differ (0.4±0.3mJy (ct s−1)−1for the
2006 data and1.2±0.15mJy (ct s−1)−1for the 2008–2009 data).
We note that due to the large spread in the data the fits are statist-ically poor and so we do not place too much significance on these values.
Although the exact shape of theb-band/X-ray relationship is
not well defined, the lowerb-band flux for a given X-ray countrate
in the 2006 observations is clear. This could be due to there being a reduced long-term average accretion rate during these observations relative to that in the 2008–2009 observations. This would reduce
the temperature of the accretion disc and thus the flux in theb-band
from the disc, even if the X-ray countrate is similar.
4 CROSS-CORRELATIONS
We have examined in detail the cross correlation between the X-ray and UV/optical lightcurves. We calculate the cross-correlation function (CCF) using the hard X-ray (2–10 keV) count rate as a proxy for the intrinsic X-ray luminosity. The hard band countrate is expected to be a better representation of the intrinsic luminosity because it is less sensitive to obscuration (Dwelly et al, in prep). We used the discrete cross-correlation method (DCF, Edelson & Krolik 1988) adopting 2 day binning for the 2008–2009 long-term mon-itoring data, and 96 minute binning (similar to the Swift orbital period) for the 2006 intensive monitoring data. We have examined
the range -40<lag<+40 days for the long term monitoring
data-set, and -1<lag<+1 day for the intensive monitoring. We have also
examined shorter time-scales by subdividing event mode data, see Section 4.3 below.
4.1 Long times-cales
4.1.1 X-ray - UV/optical cross correlation functions
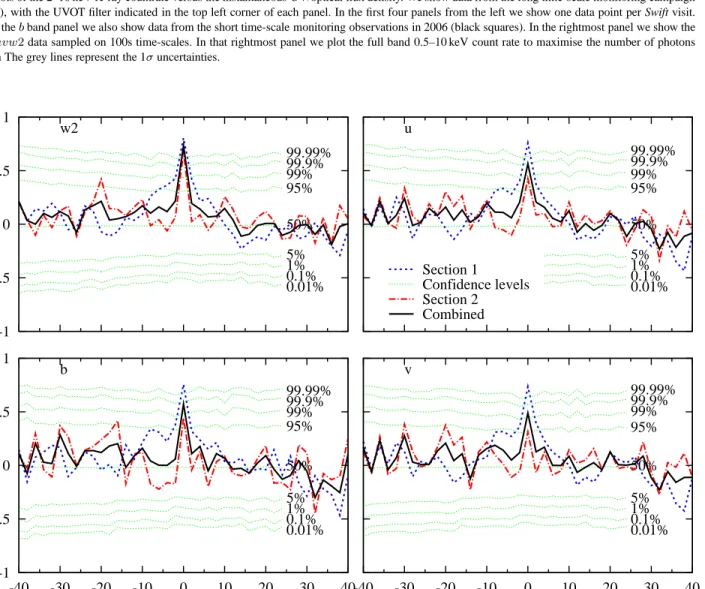
In Fig. 5 we show the cross correlation functions calculated by cor-relating the 2–10 keV X-ray 2008–2009 lightcurve with each of the
UVOT uvw2, u,band vband lightcurves. We have first
calcu-lated a separate CCF for each of the two contiguous sections of the 2008–2009 Swift dataset. The combined CCF for the entire 2008– 2009 dataset was determined by taking the average value of the CCFs for each of the two sections, weighted by the relative time spanned by each section.
We see that each of the CCFs (in each UVOT filter and for each subsection of the data) have a similar structure, and all show a very strong sharp peak at zero lag. The temporal resolution of our 2008–2009 Swift lightcurves is of order 2 days, so the peaks in the CCFs are constrained to be less than 2 days, i.e. consistent with zero lag. These small lags are consistent with a reprocessing scenario as long as the light travel time from the central X-ray source to the UV/optical emission region is less than 1 day.
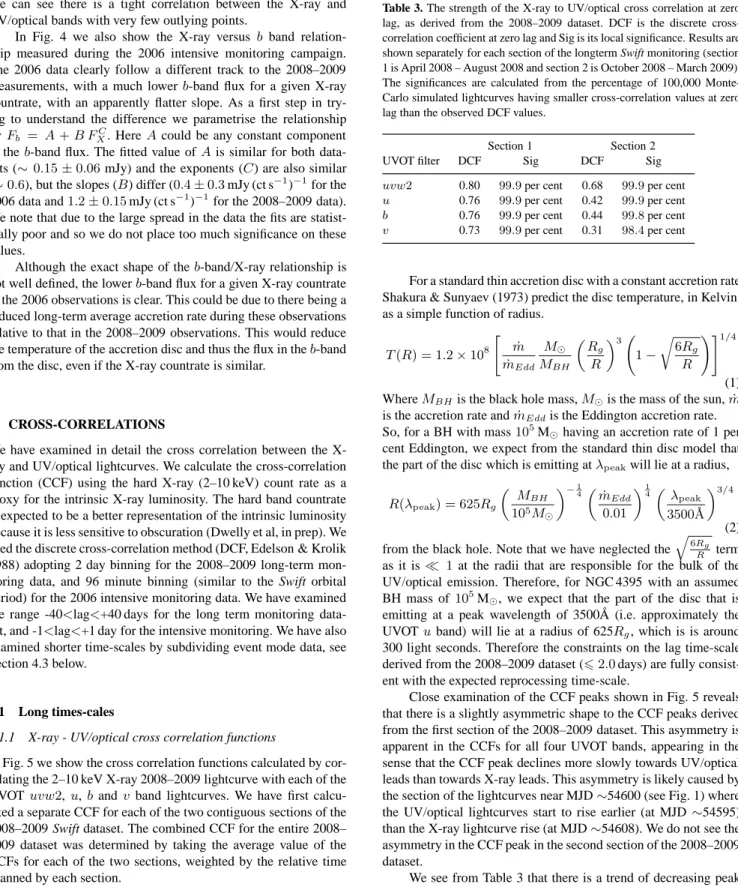
Table 3. The strength of the X-ray to UV/optical cross correlation at zero
lag, as derived from the 2008–2009 dataset. DCF is the discrete cross-correlation coefficient at zero lag and Sig is its local significance. Results are shown separately for each section of the longterm Swift monitoring (section 1 is April 2008 – August 2008 and section 2 is October 2008 – March 2009). The significances are calculated from the percentage of 100,000 Monte-Carlo simulated lightcurves having smaller cross-correlation values at zero lag than the observed DCF values.
Section 1 Section 2
UVOT filter DCF Sig DCF Sig
uvw2 0.80 99.9per cent 0.68 99.9per cent
u 0.76 99.9per cent 0.42 99.9per cent
b 0.76 99.9per cent 0.44 99.8per cent
v 0.73 99.9per cent 0.31 98.4per cent
For a standard thin accretion disc with a constant accretion rate Shakura & Sunyaev (1973) predict the disc temperature, in Kelvin, as a simple function of radius.
T(R) = 1.2×10⁸
is the accretion rate andm˙Eddis the Eddington accretion rate.
So, for a BH with mass105
M⊙having an accretion rate of 1 per
cent Eddington, we expect from the standard thin disc model that
the part of the disc which is emitting atλpeakwill lie at a radius,
R(λpeak) = 625Rg
from the black hole. Note that we have neglected the
q 6Rg
R term
as it is≪ 1 at the radii that are responsible for the bulk of the
UV/optical emission. Therefore, for NGC 4395 with an assumed
BH mass of105
M⊙, we expect that the part of the disc that is
emitting at a peak wavelength of 3500 ˚A (i.e. approximately the
UVOTuband) will lie at a radius of 625Rg, which is is around
300 light seconds. Therefore the constraints on the lag time-scale
derived from the 2008–2009 dataset (62.0days) are fully
consist-ent with the expected reprocessing time-scale.
Close examination of the CCF peaks shown in Fig. 5 reveals that there is a slightly asymmetric shape to the CCF peaks derived from the first section of the 2008–2009 dataset. This asymmetry is apparent in the CCFs for all four UVOT bands, appearing in the sense that the CCF peak declines more slowly towards UV/optical leads than towards X-ray leads. This asymmetry is likely caused by
the section of the lightcurves near MJD∼54600 (see Fig. 1) where
the UV/optical lightcurves start to rise earlier (at MJD∼54595)
than the X-ray lightcurve rise (at MJD∼54608). We do not see the
asymmetry in the CCF peak in the second section of the 2008–2009 dataset.
0.1 1
0.01 0.1 1
UVOT Flux density (mJy)
2-10 keV rate (ct s-1) v
0.01 0.1 1
2-10 keV rate (ct s-1) b
0.01 0.1 1
2-10 keV rate (ct s-1) u
0.01 0.1 1
2-10 keV rate (ct s-1) uvw2
0.01 0.1 1
0.5-10 keV rate (ct s-1) uvw2 - 100s
Figure 4. Plots of the 2–10 keV X-ray countrate versus the instantaneous UV/optical flux density. We show data from the long time-scale monitoring campaign
(2008–2009), with the UVOT filter indicated in the top left corner of each panel. In the first four panels from the left we show one data point per Swift visit. Note that in thebband panel we also show data from the short time-scale monitoring observations in 2006 (black squares). In the rightmost panel we show the X-ray anduvw2data sampled on 100s time-scales. In that rightmost panel we plot the full band 0.5–10 keV count rate to maximise the number of photons
per 100s bin The grey lines represent the 1σuncertainties.
-1 -0.5 0 0.5 1
50% 95%
5% 99%
1% 99.9%
0.1% 99.99%
0.01% w2
50% 95%
5% 99%
1% 99.9%
0.1% 99.99%
0.01% u
-1 -0.5 0 0.5 1
-40 -30 -20 -10 0 10 20 30 40
Cross-correlation coefficient
Lag of UVOT relative to X-ray (days) 50%
95%
5% 99%
1% 99.9%
0.1% 99.99%
0.01% b
Section 1
Confidence levels Section 2
Combined
-40 -30 -20 -10 0 10 20 30 40
50% 95%
5% 99%
1% 99.9%
0.1% 99.99%
0.01% v
Figure 5. The long-term cross-correlation functions between the 2–10 keV X-ray lightcurve and the lightcurves in theuvw2,u,bandvUVOT bands. The
a point source by a disc, lags are observed that are dependent on the increased travel time to the reprocessing material and also on the distance from the reprocessing material to the observer. For
ex-ample, the predicted lag for a disc inclined at an angleθ where
φ= 0is the most direct line to the observer is given by
∆t= √
H2
x+R2+Hxcosθ−Rsinθcosφ
c (3)
Where∆tis the increased travel time for the reprocessed emission
compared with the direct X-ray emission, Hxis the height above the
disc, R is the radius of the reprocessor,θis the inclination angle,
φis the azimuthal angle and cis the speed of light. The longer
wavelength emission arises from larger radii in the disc increasing the spread of light travel times for a disc with non-zero inclination. The optical emission region also spans a larger range of radii than the UV emission region. The combination of these factors results
in the transfer function relevant to the reprocessing of aδ-function
X-ray impulse into UV/optical emission being broader for longer wavelengths.
We have assessed the significances of the observed CCF peaks using Monte-Carlo simulations (see e.g. Breedt et al. 2010). We generate simulated X-ray lightcurves according to the method of Timmer & Koenig (1995), adopting the X-ray power spectral dens-ity parameters for NGC 4395 determined by Vaughan et al. (2005), scaled to the mean and RMS of the observed 2–10 keV Swift-XRT lightcurve, and taking account of the actual sampling pattern in the
Swift dataset. The simulated X-ray lightcurve was then cross
cor-related with each of the observed UVOT lightcurves to produce a simulated CCF, using the same CCF time axis binning as ad-opted for the actual science data. This process was repeated for a
large number (> 105) of simulated X-ray light curves. The
res-ultant ensemble of simulated CCFs, which by construction should contain no real correlated signal, allows us to calculate the prob-ability of finding a particular correlation coefficient at a given lag time by chance. A separate set of simulations is carried out for each of the sub-sections of the data (i.e. the two sections of the 2008– 2009 monitoring and the 2006 dataset are all treated separately). If we decide in advance which lag we are searching for, e.g. zero lag, then we can estimate the significance of the zero-lag peaks by determining the fraction of simulated lightcurves that have a CCF value (at zero lag) that exceeds the measured peak CCF value. The CCF strength, and the statistical significances of the observed zero-lag peaks are shown in Table 3. We find that for the first section of the 2008–2009 dataset, and for each UVOT filter, the detected CCF peaks at zero lag each have a significance of at least 99.9 per cent. During the second section of the 2008–2009 dataset the peak cross-correlation strength is somewhat reduced for all four UVOT filters (see Table 3). However, the peak at zero lag still has a
signi-ficance of at least 99 per cent for all but thevband, which itself is
significant at>98per cent confidence.
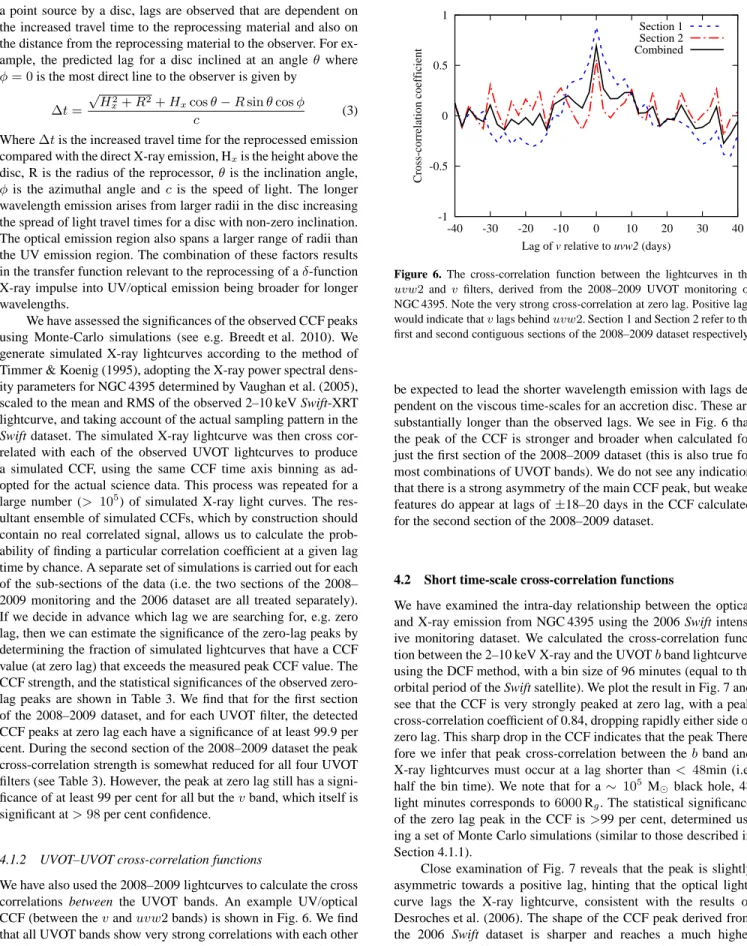
4.1.2 UVOT–UVOT cross-correlation functions
We have also used the 2008–2009 lightcurves to calculate the cross correlations between the UVOT bands. An example UV/optical
CCF (between thevanduvw2bands) is shown in Fig. 6. We find
that all UVOT bands show very strong correlations with each other and the CCFs calculated for any combination of UVOT bands show a peak with a lag of zero days, consistent with the hypothesis that the majority of the optical emission is produced by reprocessing of the X-ray emission. If the disc fluctuations were the dominant cause of the UV/optical variability the longer wavelength emission would
-1
Lag of v relative to uvw2 (days) Section 1 Section 2 Combined
Figure 6. The cross-correlation function between the lightcurves in the uvw2 andv filters, derived from the 2008–2009 UVOT monitoring of
NGC 4395. Note the very strong cross-correlation at zero lag. Positive lags would indicate thatvlags behinduvw2. Section 1 and Section 2 refer to the
first and second contiguous sections of the 2008–2009 dataset respectively.
be expected to lead the shorter wavelength emission with lags de-pendent on the viscous time-scales for an accretion disc. These are substantially longer than the observed lags. We see in Fig. 6 that the peak of the CCF is stronger and broader when calculated for just the first section of the 2008–2009 dataset (this is also true for most combinations of UVOT bands). We do not see any indication that there is a strong asymmetry of the main CCF peak, but weaker
features do appear at lags of±18–20 days in the CCF calculated
for the second section of the 2008–2009 dataset.
4.2 Short time-scale cross-correlation functions
We have examined the intra-day relationship between the optical and X-ray emission from NGC 4395 using the 2006 Swift intens-ive monitoring dataset. We calculated the cross-correlation
func-tion between the 2–10 keV X-ray and the UVOTbband lightcurves
using the DCF method, with a bin size of 96 minutes (equal to the orbital period of the Swift satellite). We plot the result in Fig. 7 and see that the CCF is very strongly peaked at zero lag, with a peak cross-correlation coefficient of 0.84, dropping rapidly either side of zero lag. This sharp drop in the CCF indicates that the peak
There-fore we infer that peak cross-correlation between thebband and
X-ray lightcurves must occur at a lag shorter than< 48min (i.e.
half the bin time). We note that for a∼ 105
M⊙ black hole, 48
light minutes corresponds to6000Rg. The statistical significance
of the zero lag peak in the CCF is>99 per cent, determined
us-ing a set of Monte Carlo simulations (similar to those described in Section 4.1.1).
Close examination of Fig. 7 reveals that the peak is slightly asymmetric towards a positive lag, hinting that the optical light-curve lags the X-ray lightlight-curve, consistent with the results of Desroches et al. (2006). The shape of the CCF peak derived from the 2006 Swift dataset is sharper and reaches a much higher correlation coefficient than the CCF presented in Fig. 13 of Desroches et al. (2006, who used X-ray and UV data from Chandra and HST respectively). The 2006 Swift CCF drops rapidly to near
zero for lags with|tlag|>2Swift orbits, and is well determined out
-1
Lag of b-band optical relative to X-ray (days) 50% 95%
5% 99%
1%
Figure 7. The short time-scale (< 1day) cross-correlation function
between the X-ray andbbands calculated for the 2006 intensive monitor-ing dataset (blue dot-dashed curve). Significance levels derived from Monte Carlo simulations are shown with (green) dotted lines. The CCF clearly shows a significant and very narrow peak at zero lag. The points are binned on 96 minute time-scales, which corresponds to approximately one Swift orbit.
the 2006 Swift dataset constrains very strongly the location of the reprocessing region relative to the central X-ray source.
The disc reprocessing transfer function relating the X-ray input to the UV/optical emission can be parametrised fairly ac-curately by a very sharp rise followed by an exponential decay (Breedt et al. 2009). To estimate the width of this function we convolved the hard (2–10 keV) X-ray lightcurve from 2006, with exponential functions with various decay time-scales and
cross-correlated the resulting lightcurves with the observedb-band
light-curve. We find that the peak value of the cross-correlation function rises rapidly as the transfer function decay time-scale is increased
from zero to∼1 hour. The largest peak cross correlation function
actually occurs with a decay time-scale of 1.7 orbits (2 hours 45 mins) but the value of the peak does not change greatly between
decay values of∼1 hour and a few hours.
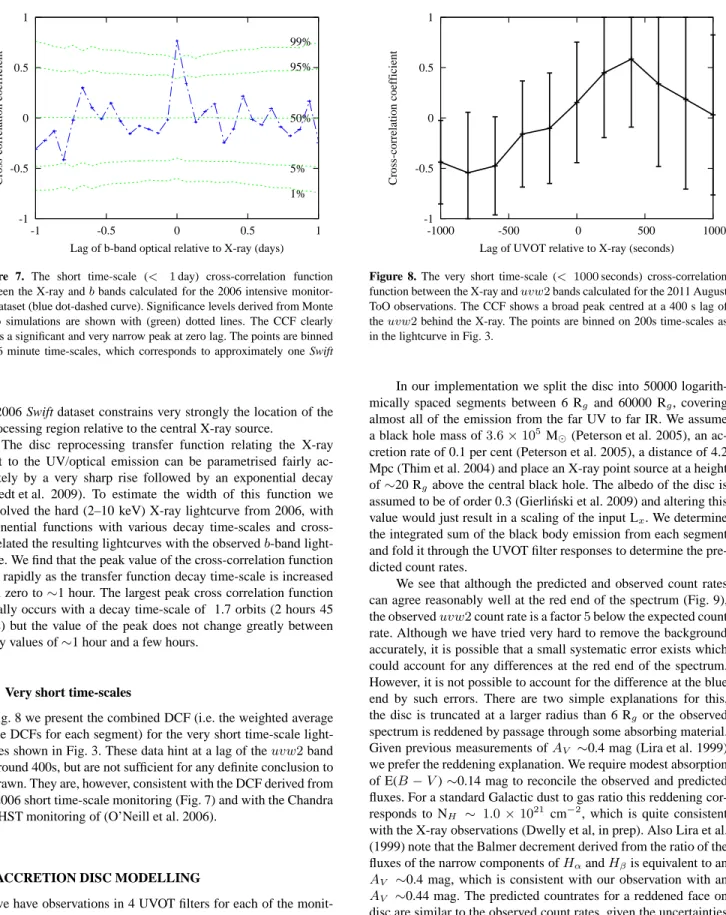
4.3 Very short time-scales
In Fig. 8 we present the combined DCF (i.e. the weighted average of the DCFs for each segment) for the very short time-scale
light-curves shown in Fig. 3. These data hint at a lag of theuvw2band
by around 400s, but are not sufficient for any definite conclusion to be drawn. They are, however, consistent with the DCF derived from the 2006 short time-scale monitoring (Fig. 7) and with the Chandra and HST monitoring of (O’Neill et al. 2006).
5 ACCRETION DISC MODELLING
As we have observations in 4 UVOT filters for each of the monit-oring observations in 2008/9 we are able to determine crude spec-tral energy distributions (SEDs) which we show in Fig. 9. Here we show both an SED from the average of all of the data and an SED representative of the highest flux levels. We can compare these SEDs with the prediction from a simple optically thick, geometric-ally thin, Shakura & Sunyaev (1973) accretion disc with constant accretion rate.
Lag of UVOT relative to X-ray (seconds)
Figure 8. The very short time-scale (< 1000seconds) cross-correlation
function between the X-ray anduvw2bands calculated for the 2011 August
ToO observations. The CCF shows a broad peak centred at a 400 s lag of theuvw2behind the X-ray. The points are binned on 200s time-scales as
in the lightcurve in Fig. 3.
In our implementation we split the disc into 50000
logarith-mically spaced segments between 6 Rg and 60000 Rg, covering
almost all of the emission from the far UV to far IR. We assume
a black hole mass of3.6×105 M
⊙(Peterson et al. 2005), an
ac-cretion rate of 0.1 per cent (Peterson et al. 2005), a distance of 4.2 Mpc (Thim et al. 2004) and place an X-ray point source at a height
of∼20 Rg above the central black hole. The albedo of the disc is
assumed to be of order 0.3 (Gierli´nski et al. 2009) and altering this
value would just result in a scaling of the input Lx. We determine
the integrated sum of the black body emission from each segment and fold it through the UVOT filter responses to determine the pre-dicted count rates.
We see that although the predicted and observed count rates can agree reasonably well at the red end of the spectrum (Fig. 9),
the observeduvw2count rate is a factor5below the expected count
rate. Although we have tried very hard to remove the background accurately, it is possible that a small systematic error exists which could account for any differences at the red end of the spectrum. However, it is not possible to account for the difference at the blue end by such errors. There are two simple explanations for this,
the disc is truncated at a larger radius than 6 Rg or the observed
spectrum is reddened by passage through some absorbing material.
Given previous measurements ofAV ∼0.4 mag (Lira et al. 1999)
we prefer the reddening explanation. We require modest absorption
of E(B−V)∼0.14 mag to reconcile the observed and predicted
fluxes. For a standard Galactic dust to gas ratio this reddening
cor-responds to NH ∼ 1.0×1021 cm−2, which is quite consistent
with the X-ray observations (Dwelly et al, in prep). Also Lira et al. (1999) note that the Balmer decrement derived from the ratio of the
fluxes of the narrow components ofHαandHβis equivalent to an
AV ∼0.4 mag, which is consistent with our observation with an
AV ∼0.44 mag. The predicted countrates for a reddened face on
disc are similar to the observed count rates, given the uncertainties in, eg, distance or disc inclination angle.
6 DISCUSSION
0 5 10 15 20
2000 2500 3000 3500 4000 4500 5000 5500
UVOT Count-rate / s
2000 2500 3000 3500 4000 4500 5000 5500
UVOT Count-rate / s
Wavelength / A
Peak count-rates by filter Complete sets mean
Figure 9. Spectral energy distributions: Top: The pure blackbody disc
mod-els plotted against the observed SEDs. Bottom: The reddened blackbody disc model plotted against the observed SEDs. Solid lines correspond to
˙
m = 10−3.0m˙Eddand the dashed lines tom = 10˙ −3.5m˙Edd. All
coun-trates within each plot are scaled by the same factor.
(i) During monitoring from April 2008 to March 2009 with
Swift, a large increase in flux was detected from NGC 4395 in the
X-ray, UV and optical wavebands. This high flux period lasted for over 60 days, reaching X-ray flux levels at least 5 times greater than the previous average levels, before returning to those previous levels.
(ii) There is a strong correlation between the UV/optical
vari-ations with peak CCF values of>0.9, and all show similar levels
of fractional variability.
(iii) The variations between the hard band X-rays (2–10 keV) and all UVOT bands are highly correlated with a lag consistent with zero days. The strength of these correlations decreases with increasing UV/optical wavelength.
(iv) NGC 4395 was also observed once per Swift orbit, every
orbit, for 5 days in 2006, using only thebUVOT filter. The lag
was again consistent with zero but the CCF was slightly
asymmet-ric in the sense of ab-band lag of less than half a Swift orbit (i.e.
<48mins).
(v) By splitting individual Swift TOO observations into 200s
bins, we find a weak correlation between theuvw2and the X-ray
lightcurves with a lag of∼400 s.
(vi) The UVOT colours are consistent with the expectation from a standard optically thick accretion disc model, but only with the addition of a small amount of reddening.
These Swift observations, together with previous less extens-ive observations involving Chandra (Desroches et al. 2006), all in-dicate that the UV/optical emission in NGC 4395 probably lags be-hind the X-ray emission by a very short time-scale, certainly less than 48 min and more likely closer to a few hundred seconds. There are no observations which suggest that the UV/optical emission as observed on short (i.e. hours-day) time-scales leads the X-ray emission. A UV/optical lag of a few hundred seconds is consistent with the light travel time to the UV/optical emission region in the accretion disc and thus strongly suggests that the short time-scale UV/optical variations arise from reprocessing of X-ray emission.
If the UV/optical variability is driven mainly by reprocessing of X-ray emission, it is necessary that the variable component of the luminosity in the X-ray band exceeds that in the UV/optical bands. It is hard to measure the relative luminosities precisely as
our observations do not cover all possible wavebands, but we can make an approximate calculation. For example in Fig. 1 we see that the UV/optical variability is greatest in the UVW2 band where the
range of fluxes is∼ 4×10⁻¹⁵
ergs cm−2 s−1 A˚−1. In order to
obtain the total variable UV/optical flux which might be driven by the X-rays we need to integrate over all UV/optical bands. If we
take a total bandwidth of 1000 ˚A, and a flat spectrum, we would
obtain a variable flux of∼4×10⁻¹²
ergs cm−2s−1. For the Swift
XRT a 2-10 keV flux of1×10−11
ergs cm−2s−1, assuming a
typ-ical NGC 4395 photon index of 1.6, corresponds to∼0.1counts
s−1. Thus the variable 2-10 keV flux is∼4×10⁻¹¹
ergs cm−2
s−1. Even allowing for the fact that probably less than half of the
observed X-ray luminosity impinges upon the disc, this crude es-timate indicates that there is probably sufficient luminosity in the X-ray variations to drive the UV/optical variability.
One might argue that simply extending the UVW2 variability
over 1000 ˚A underestimates the total variable UV/optical
lumin-osity. On the other hand the 2-10 keV flux is less, by factors of a few, than the total irradiating X-ray flux, which may compensate. Other methods of estimating the total variable luminosity in the rel-evant bands, eg by modelling of the accretion disc, reach broadly the same conclusion. We therefore conclude that although there is probably not a great deal of room to spare, the luminosity in the X-ray band is just about sufficient to drive the UV/optical variability.
We note also that our treatment is rather simplistic. In reality the enhanced UV/optical emission which is produced by X-ray ir-radiation will probably lead to an enhanced flux of seed photons into the X-ray emitting corona, and hence to further X-ray emis-sion. Thus variations in both bands may be prolonged in this feed-back process. However as long as the feedfeed-back is not too strong, the X-ray/UV-optical lag will remain as a valid indicator of the ap-proximate separation of the emission regions.
The reason for the large outburst in 2008 is not entirely clear. Janiuk & Czerny (2011) suggest that disc radiation pressure in-stabilities, which might produce outbursts not too different from that seen, might occur in AGN such as NGC 4395 with a few year time-scale. Janiuk & Czerny (2011) suggest that an accretion rate greater than 0.025 Eddington, which is probably just above that of NGC 4395, is required for the instability to be relevant in AGN. However given the uncertainties both in theoretical modelling and in estimating masses and accretion rates, this instability might still be relevant in NGC 4395. Alternatively the apparent outburst may just be part of the normal stochastic variability of the AGN. Al-though the X-ray flux in the 2011 monitoring observations did not reach the same level as in 2008, the mean 2011 flux level is a good deal higher than in the second part of the 2008–2009 mon-itoring observations and there are other similarities, e.g. softening of the spectrum with increasing flux (Dwelly et al, in prep). We discuss the detailed temporal variability in more detail elsewhere
(McHardy et al, in prep).
ACKNOWLEDGMENTS
References
Ar´evalo P., Uttley P., Kaspi S., Breedt E., Lira P., McHardy I. M., 2008, MNRAS, 389, 1479
Ar´evalo P., Uttley P., Lira P., Breedt E., McHardy I. M., Churazov E., 2009, MNRAS, 397, 2004
Breedt E., et al., 2009, MNRAS, 394, 427 —, 2010, MNRAS, 403, 605
Breeveld A. A., et al., 2010, MNRAS, 406, 1687 Burrows D. N., et al., 2005, SSR, 120, 165
Cackett E. M., Horne K., Winkler H., 2007, MNRAS, 380, 669 Collier S. J., et al., 1998, ApJ, 500, 162
Czerny B., 2006, in Astronomical Society of the Pacific Confer-ence Series, Vol. 360, Astronomical Society of the Pacific Con-ference Series, C. M. Gaskell, I. M. McHardy, B. M. Peterson, & S. G. Sergeev , ed., pp. 265–+
Desroches L.-B., et al., 2006, ApJ, 650, 88 Edelson R. A., Krolik J. H., 1988, ApJ, 333, 646 Fabian A. C., et al., 2011, ArXiv
Filippenko A. V., Ho L. C., 2003, ApJ, 588, L13 Filippenko A. V., Sargent W. L. W., 1989, ApJ, 342, L11 Gehrels N., et al., 2004, ApJ, 611, 1005
Gierli´nski M., Done C., Page K., 2009, MNRAS, 392, 1106 Janiuk A., Czerny B., 2011, MNRAS, 414, 2186
Kaaret P., Feng H., 2009, ApJ, 702, 1679
Krolik J. H., Horne K., Kallman T. R., Malkan M. A., Edelson R. A., Kriss G. A., 1991, ApJ, 371, 541
Lira P., Ar´evalo P., Uttley P., McHardy I., Breedt E., 2011, MNRAS, 415, 1290
Lira P., Lawrence A., O’Brien P., Johnson R. A., Terlevich R., Bannister N., 1999, MNRAS, 305, 109
Minezaki T., et al., 2006, ApJ, 643, L5 O’Neill P. M., et al., 2006, ApJ, 645, 160
Peng C. Y., Ho L. C., Impey C. D., Rix H.-W., 2002, AJ, 124, 266 —, 2010, AJ, 139, 2097
Peterson B. M., et al., 2005, ApJ, 632, 799 —, 2006, ApJ, 641, 638
Poole T. S., et al., 2008, MNRAS, 383, 627 Roming P. W. A., et al., 2005, SSR, 120, 95 —, 2009, ApJ, 690, 163
Rowan-Robinson M., et al., 2008, MNRAS, 386, 697
Schlegel D. J., Finkbeiner D. P., Davis M., 1998, ApJ, 500, 525 Sergeev S. G., Doroshenko V. T., Golubinskiy Y. V., Merkulova
N. I., Sergeeva E. A., 2005, ApJ, 622, 129 Shakura N. I., Sunyaev R. A., 1973, A&A, 24, 337
Thim F., Hoessel J. G., Saha A., Claver J., Dolphin A., Tammann G. A., 2004, AJ, 127, 2322
Timmer J., Koenig M., 1995, A&A, 300, 707 Uttley P., McHardy I. M., 2001, MNRAS, 323, L26
Vaughan S., Iwasawa K., Fabian A. C., Hayashida K., 2005, MNRAS, 356, 524