Predictive control for hydrogen production by
electrolysis in an offshore platform using
renewable energies
Alvaro Serna
a,b,*, Imene Yahyaoui
c, Julio E. Normey-Rico
b,
C
esar de Prada
a, Fernando Tadeo
aaDpto de Ingenierı´a de Sistemas y Automatica, Universidad de Valladolid, Valladolid, Spain b
Dpto de Automac¸~ao e Sistemas, Universidade Federal de Santa Catarina, Florianopolis, Brazil
cDpto de Engenharı´a Eletrica, Universidade Federal do Espı´rito Santo, Vitoria, Brazil
a r t i c l e i n f o
Article history: Received 23 May 2016 Received in revised form 2 November 2016
Accepted 10 November 2016 Available online 4 December 2016
Keywords: Electrolysis Predictive control Wave energy Wind energy
a b s t r a c t
An Energy Management System (EMS), based on Model Predictive Control (MPC) ideas, is proposed here to balance the consumption of power by a set of electrolysis units in an offshore platform. In order to produce renewable hydrogen, the power is locally generated by wind turbines and wave energy converters and fully used by the electrolyzers. The energy generated at the platform by wind and wave is balanced by regulating the operating point of each electrolysis unit and its connections or disconnections, using an MPC based on a Mixed-Integer-Quadratic-Programming algorithm. This Predictive Control algorithm makes it possible to take into account predictions of available power and power con-sumption, to improve the balance and reduce the number of connections and disconnec-tions of the devices. Two case studies are carried out on different installadisconnec-tions composed of wave and wind energies feeding a set of alkaline electrolyzers. Validation using measured data at the target location of the platforms shows the adequate operation of the proposed EMS.
©2016 Hydrogen Energy Publications LLC. Published by Elsevier Ltd. All rights reserved.
Introduction
Hydrogen produced from renewable energies offers signifi-cant advantages[1e3]. Some renewable energy sources stud-ied are wind[4e6], waves[7e10], and photovoltaic[11,12]. The usefulness of these energy sources has been verified, the principal problem being their variability[12e15]. In previous works, this problem was solved using hybrid sources (see Refs.
[16e18]and references therein). In this paper, we concentrate
on offshore co-located wind and wave power sources, as this combination of offshore sources reduces the variability with respect to onshore wind or to wave alone based systems thanks to the low temporal correlation of the resources[19].
Electrolysis is used here to produce H2, as it enables the
production of H2directly from electrical power, and current
electrolyzers available in the market can operate intermit-tently with high efficiency. Many technologies have been proposed, such as polymer electrolysis (PEMEC)[20], alkaline cells and solid oxide electrolysis (SOEC) (see Refs.[2,21,22]and
*Corresponding author. Universidad de Valladolid, Departamento de Ingenierı´a de Sistemas y Automatica, C/Doctor Mergelina s/n 47011, Valladolid, Spain.
E-mail addresses:[email protected](A. Serna), [email protected](I. Yahyaoui),[email protected](J.E. Normey-Rico),
[email protected](C. de Prada),[email protected](F. Tadeo).
Available online at
www.sciencedirect.com
ScienceDirect
journal hom epa ge: www.elsev ier.com/locate/he
http://dx.doi.org/10.1016/j.ijhydene.2016.11.077
references therein). The class considered in this work are high-pressure and temperature alkaline electrolyzers, as they generate H2 with a purity better than 99.97%, which is the
quality used in the automotive industry[23], and are already available at the power levels that make the technology cost-efficient (about MW; see Refs.[13,24e26]for details). This En-ergy Management System proposes that the enEn-ergy consumed is adapted to the available energy by switching on/off elec-trolysis units and regulating the performance of the devices that are connected, following a smart grid approach for the local micro grid [2]. In comparison with previous works
[2,18,27], this proposal focuses on using an advanced control system to optimize H2 production and reduce the
connec-tions/disconnections of the appliances[26]. In this work, the produced energy is totally consumed, but the results can be extrapolated to the majority of situations using only the excess energy from green sources[13,29e31]. The proposed EMS is based on Model Predictive Control ideas. Model Pre-dictive Control (MPC) originated in the late seventies and has developed considerably since then. The term MPC does not designate a specific control strategy, but a very ample range of control methods which make an explicit use of a model of the process to obtain the control signal by minimizing an objec-tive function[28].
A previous version of this work was presented in Refs.[18]
and[27]within the European project H2Ocean[32]and it is fully developed and improved here. Furthermore, a non-linear model with binary and continuous variables is developed in this paper, which is then transformed in such a way that an MIQP (Mixed-Integer Quadratic Programming) can be used to solve the MPC optimization at each step. Two different case studies are described here to illustrate the performance of the controller.
This work is organized in the following manner: Section
materials and methodspresents the process description and summarizes the modeling of the components and some MPC ideas. The proposed EMS is presented in Sectionproposed Energy Management System, fully developing the optimiza-tion algorithm. Secoptimiza-tion case studies presents the two case studies and the validation using measured data from a certain location. Finally, some conclusions are presented at the end of the paper.
Materials and methods
This work falls within the innovative idea that consists of H2
offshore production by a combination of renewable energies. Besides the models of the plant that were described in Ref.[2], here this paper focuses on the design of an advanced control algorithm of the platform previously considered.
Process description
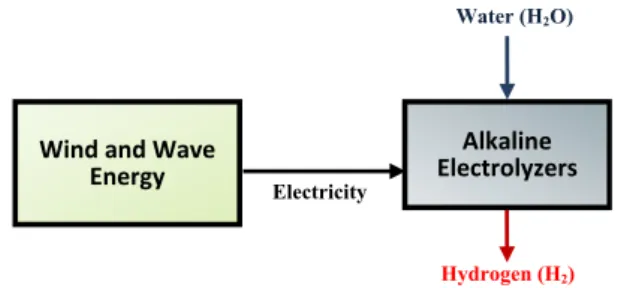
Fig. 1depicts the components of the proposed renewable H2
platform. Two renewable energy sources (wave and wind) supply electricity to the process. This electricity is generated in WECs (Wave Energy Converters) and VAWTs (Vertical Axes Wind Turbines), and is then used in the electrolysis as scheduled by the EMS described in the following sections. An
electrolyzer is a piece of electrochemical apparatus (some-thing that uses electricity and chemistry at the same time) designed to perform electrolysis: splitting a solution into the atoms from which it is made by passing electricity through it
[33]. The proposed EMS is aimed at adapting the production of H2 to the available energy using degrees of freedom of the advanced control system, so the H2produced is maximized
without degrading the electrolyzers.
Manipulated variables
The manipulated variables of the proposed EMS are the operating points for each electrolyzer. They are mathemati-cally denoted byaiðkÞ, where k represents the discrete time in samples (a sample time of 1 h is used) and the suffix i is used to identify each device. Moreover:
a)aiðkÞ ¼0if the electrolyzer i is disconnected at time k. b)aiðkÞis between ½ai ai if the electrolyzer is connected,
whereaiandaiare minimum and maximum values (be-tween 0 and 1) fixed by the manufacturer due to techno-logical limitations[28]).
In addition, binary variablesdiðkÞεf0;1gare used (see Refs.
[34,35]), where 0 corresponds to electrolyzer disconnection and 1 to electrolyzer connection.
Model and controlled variables
The model of the electrolyzers is represented by the following equations with parameters (a and b) that are obtained from the manufacturer's data and measurements from the plant:
b
HiðkÞ ¼baiðkÞ,bdiðkÞ
a,baiðkÞ þb
(1)
b
PiðkÞ ¼Pi,baiðkÞ,bdiðkÞ (2)
Equations (1) and (2) show the controlled variables of electrolyzer i: bPiðkÞand HbiðkÞ. On the one hand,HbiðkÞis the
predicted H2production of electrolyzer i at time k. On the
other hand,bPiðkÞis the predicted energy consumption of de-vice i and Piis its maximum power at the same sample time.
Parameters ai, biand Piare used to define the device
perfor-mance. This performance is called the relationship between consumed energy and H2production. Note that the model of
the electrolyzers is static because the time required for them
Electricity
Water (H2O)
Wind and Wave
Energy
Alkaline
Electrolyzers
Hydrogen (H2)
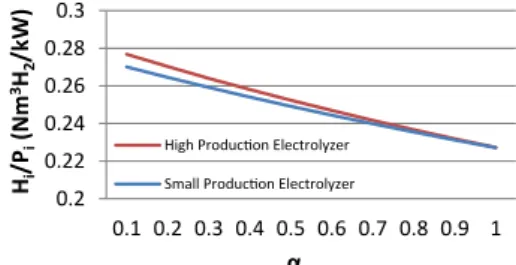
to varyafrom the minimum to the maximum value is less than a few minutes in the worst case, thus, these dynamics can be neglected as the sampling time for the EMS proposed here is one hour.Fig. 2shows the ratio Hi/Piin the production
of H2by electrolysis as a function of the operating point (a) for
the different types of electrolyzers, which will be explained in the two case studies of Sectioncase studies.
Model Predictive Control
Comparing with other methods of process control, MPC can be used to solve the most common problems in today's industrial processes, which need to be operated under tight performance specifications where many constraints need to be satisfied[36]. The principal elements in MPC are the objective function to be minimized, the model used to compute the predictions of the controlled variables, the definition of the process constraints and the method applied to solve the optimization problem[28].
Fig. 3depicts the MPC scheme; where the optimization block receives information from the model block, which is responsible for computing the predictions of the plant output in a defined horizon. A model is used to predict the future outputs, based on past and current values and on the proposed optimal future control actions. These actions are calculated by the optimizer taking into account the cost function (where the future tracking error is considered) as well as the constraints[28].
Proposed Energy Management System
In Section introduction, the fact that alkaline electrolyzers have been selected to operate in the offshore platform was mentioned. A set of alkaline electrolyzers that might have different characteristics are assumed in this work, to repro-duce installations that might have different electrolyzers, or
electrolyzers with changing parameters due to aging, main-tenance, etc, n being the number of devices.
Control objectives
The control algorithm designed in this work aims to maximize the H2produced by electrolysis considering different aspects,
such as the limitation in the available power and the opera-tional constraints. Three main objectives must be fulfilled:
Objective 1:To maximize the H2production, the difference
between the values of the prediction and its desired values for each electrolyzer is minimized for all the devices along the prediction horizon (N).
Objective 2:To maximize the operation of the devices, the discrete variables defining the connection/disconnection condition should be, whenever possible, equal to one (connection condition) along N.
Objective 3:Energy consumed by the devices should always be smaller than the energy supplied from the wind and waves but will try to be equal.
Cost function and optimization problem
Equation(3)shows the quadratic cost function considered in this work, which is minimized at each sample time to find the optimal control action.
This equation considers, in prediction and control horizons of N and Nusamples respectively, the error between the
pre-dictions of H2producedðHbiÞand the desired valuesðHiÞ, while
also penalizing the number of connections and disconnections. Besides, QHIand Qdiare the weighting factors for the error and
the control action, respectively. The first term of(3)is used for Objective 1, while the second term of this equation tries to achieve Objective 2 of Sectioncontrol objectives. To solve this problem, the future predictions of the H2 production are
expressed as a function of the future control actions and the past values of the input and outputs using the electrolyzer models(1) and (2). Thus, using equation(3)with all the system constraints and the electrolyzer models, it can be shown that the optimization problem to be solved at each sample time is(4).
min
High ProducƟon Electrolyzer
Small ProducƟon Electrolyzer
Fig. 2eHydrogen production of the electrolyzers.
Because of the non-linear model of the electrolyzer (see equation(1)) and the use of discrete (d) and real (a) decision variables, the problem to be solved by the MPC control algo-rithm is, at each k, an NLMIQP (Non-Linear Mixed Integer Quadratic Problem) that is very complicated to solve. Hence, a simple solution will be proposed in the next section.
Approximation to an MIQP
The main goal of this paper is to transform problem(4)into a Mixed-Integer Quadratic Problem with linear constraints (MIQP). To do so, each electrolyzer model is first modified using the following change of variable:
ziðkÞ ¼aiðkÞ,diðkÞ (5)
where ziis now a real variable: zi2ℝ. The model of the H2
production is now given by:
b
Note that the predictions of the H2produced do not depend
on past values because a static model for the electrolyzers was considered. It can be seen in equation(6)that Hi¼0 and zi¼0
ifdi¼0 while zi¼aiifdi¼1. Therefore equation(8)can be
rewritten to eliminate the dependence betweenaiand Hi:
b HiðkÞ ¼
b ziðkÞ
a,bziðkÞ þb (8)
Thereby, Hiis now a real function of the real variable zi. As
ziis in the [0,1] interval, a>0 and b>0, Hi(zi) is differentiable
and continuous in the interval [0,1]. In equation(8)Hi(zi) is a
nonlinear function, so the relationship betweenbzðkþjÞand b
HðkþjÞ will not be linear either. It is necessary to make another approximation in the predictions to modify the opti-mization problem into an MIQP which is less difficult to solve. To linearize future predictions of the H2 production, an
approximation using a first order truncation Taylor series can be done:
HiðziþDziÞ ¼HiðziÞ þv
Hi
vzi
ðziÞDzi (9)
Hence, simplifying the notation, and enforcing the same method for the N predictions of the H2production, gives:
Defining gi¼ bi
Predictions are given by the following vector for each i:
cHi¼
Hence, the relationship between the manipulated variables and the predictions can be rewritten by calculating the future control movements in the following vector:
Dui ¼
Equation(17)describes the H2produced by a certain device,
wherefiis the free response computed using the nonlinear
model written in(8)for Hi(k) andGi. Also,Duiis the linearized
forced response[28,37]. Now, taking into account the set of n devices: vector, it follows that:
H¼fþG,DU (21)
where:
Equation(21)relates, in a linear manner, the manipulated variables (vectorDU) and the controlled variables (vector H), thus the nonlinear problems in(4)are eliminated.
Constraints
In Sectionapproximation to an MIQP, a new decision variable z was defined to simplify the optimization problem that had to be solved as part of the Predictive Control strategy. Here, the constraints in (4) are modified into an MLD (Mixed Logical Dynamical System,[38,39]) to associate the performance of the platform with the discrete variabledand the continuous variable a, and to linearize the model. Thus, constraints
(23)e(28) show this idea for all the cases where the binary variable could be 0 or 1 and j¼1…N.
Besides constraints(23)e(28), the following constraint(29)
must be considered to fulfill Objective 3: At each sample (k), the total energy consumed should always be smaller than the predicted energy available from the wind and waves (bPavailable(k)). Considering MPC ideas, the vector of predictions
of available power,PbavailableðkÞ, is calculated over N using real meteorological data. Hence, the constraint in the consumed energy is:
Xn
i¼1
Pi,bziðkþjÞ bPavailableðkþjÞ j¼1;2;…;N (29)
Thus, the constraints defined in equations (23)e(29)are linear in the decision variables Dz,aandd, so the optimiza-tion problem can be solved using Mixed-Integer Quadratic Programming (MIQP).
Optimization
To summarize, the MPC problem of minimizing the cost function(4)subject to(23)e(29)can be transformed into the following MIQP:
Equation(30)can be solved at each sample time. MatricesA
andBdefine the constraints of the problem. Equation(31)can be obtained using equation(21)in the cost function:
J¼
Taking into account the relationship between bdand DU, equation(31)can be manipulated to give the cost function to be solved:
J:¼1
2DU
T,M,DUþlT,DU (32)
MatriceslandMare the linear and quadratic part of the quadratic optimization problem, respectively. They are given by equations(33) and (34):
l¼2fTQHG2H T
QHG (33)
M¼GTQ
HG (34)
All the constraints (23)e(29) can be rewritten in the compact form A,DUB. The dimensions of matrices
l;M;AandBdepend on the number of electrolyzers (n) and the control horizon Nu. These matrices have the following
dimensions: M2ℝð3nNu3nNuÞ, l2ℝ3nNu, B2ℝð6nNuþNuÞ and
A2ℝðð6nNuþNuÞ3nNuÞ.
Case studies
As detailed in Section process description, the platform is made up of two different parts: one is the energy source and the other consumes the energy to generate H2.
To produce the energy for the renewable H2plant, two sources
(wind and wave) have been considered in both case studies. Wind energy was chosen as it is a mature technology[40]and wave energy as it provides lower variability in the energy production
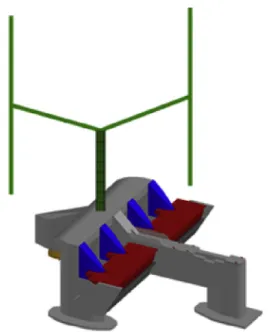
[41]. A co-located hybrid device of 1 vertical axis wind turbine (VAWT) of 5.0 MW peak power and 1 wave energy converter (WEC) of 1.6 MW peak power were chosen, according to the studies developed in the project H2Ocean[32]. This hybrid VAWT-WEC device (shown inFig. 4) is assumed to provide the energy: it consists of a platform with a hull (where the VAWT is located) and a cross bridge where four pitching wave energy converters are placed. The wave energy converters also reduce the motion of the platform and passively rotate it to face the waves.
To produce H2, different NEL A485 electrolyzers
(NEL-Hydrogen, 2014) were chosen. The main gas storage con-tainers are located on two other floating units, well separated from both the H2 production and each other. The alkaline
First case study
A simulation was carried out using one hybrid device of 6.6 MW (5.0þ1.6) for the energy production. Three electro-lyzers (two high production of 2.134 MW rated and one small production of 0.220 MW rated) were chosen for this first case study. The sections below detail the controller implementa-tion and a discussion of the results.
Controller implementation
A control horizon of 3 h and a prediction horizon of 3 h were selected. Thus, n¼3, Nu¼3 and N¼3. These are the
pa-rameters of the plant analyzed in this case study:
P¼ ½2134 2134 220T
a¼ ½0:875 0:875 0:778T
b¼ ½3:525 3:525 3:625T
H¼ ½485 485 485T
a¼ ½1 1 1T
a¼ ½0:2 0:2 0:1T
QH¼ ½1 1 50T
Qd¼ ½1 1 1
T
To optimize this problem, an MIQP solver in the Matlab® CPLEX was used to solve(30). A sampling time of 1 h was chosen to validate the EMS. In the two proposals analyzed here, the current available energy at each time k is different from the one predicted in the previous step. Bounds½aiandai
were selected using data from the electrolyzer manufacturers.
Results and discussion
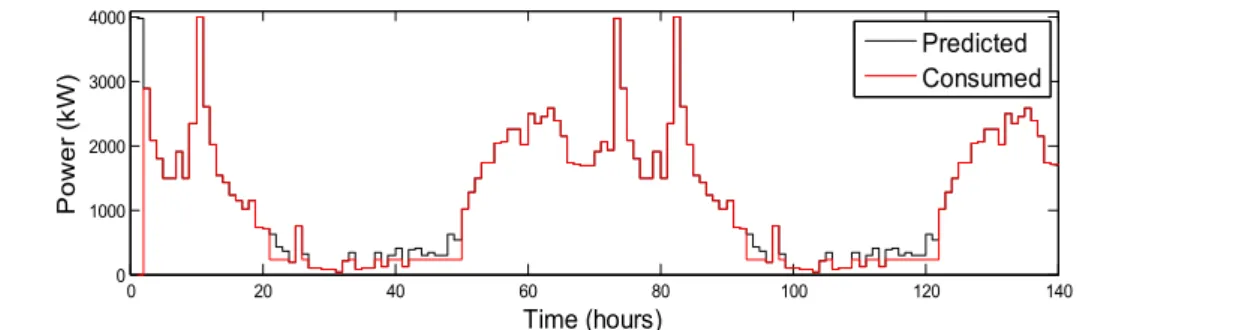
For this first case study, some results for 140 h of operation are shown inFigs. 5e9. These results confirm the correct opera-tion of the advanced control system designed in this paper for the parameters considered.Fig. 5shows the power provided by the renewable energy sources (black line) and the power consumed (red line) by the electrolyzers. As can be seen in the simulations, the controller tries to maintain the consumed power very near the available one. As a consequence of this, the H2produced is near the achievable maximum. This
hap-pens because in this first case study the parameters chosen for the electrolyzers suppose an ideal performance.
Fig. 6shows the performance of the electrolyzer i¼1 (high production). As expected, this device is not connected/ disconnected very often andais always betweenaanda. On the other hand,Fig. 7shows the performance of the second high production electrolyzer (i ¼ 2). This performance is different from the one before because here the operating point is almost always in the same value, which is the lower bound. As it is not disconnected frequently, it can be considered that the control algorithm is well designed and tuned.
Electrolyzer i ¼ 3 (Fig. 8) is more connected because its performance is bigger than the performance of the high pro-duction electrolyzers, therefore the operation of this device can also be considered correct. In all cases, the values of the computed manipulated variables are between the defined bounds. The last figure of this case study depicts the H2
pro-duced by the three devices. As expected, it proportionally depends on the power consumed, as shown inFig. 5.
Second case study
A different simulation was carried out using three hybrid de-vices of 6.6 MW each (total of 19.8 MW) for the energy pro-duction. Six electrolyzers (three high and three small production) were chosen for this second case study. The sec-tions below detail the controller implementation and a dis-cussion of the results.
Controller implementation
This second proposal is more realistic in comparison with the previous one. The rated power of the electrolyzers is not the maximum value, but a loss-of-performance factor was added for each device. These are the parameters of the platform in this second case study:
P¼ ½2066:7 2025:6 2014:6 201:2 208:5 200:6T
a¼ ½0:8706 0:8697 0:8670 0:8089 0:7882 0:7731T
b¼ ½3:5271 3:5301 3:6124 3:6809 3:6406 3:5101T
H¼ ½485 485 485 485 485 485T
a¼ ½1 1 1 1 1 1T
a ¼ ½0:2 0:2 0:2 0:1 0:1 0:1T
0 20 40 60 80 100 120 140 0
1000 2000 3000 4000
Time (hours)
Power
(
k
W
)
Predicted
Consumed
Fig. 5ePower available and consumed first case study.
Fig. 6ePerformance of electrolyzer number 1 for the first case study.
Fig. 7ePerformance of electrolyzer number 2 for the first case study.
QH¼ ½1 1 1 500 500 500 T
Qd¼ ½100 1000 10000 300 400 200T
The same optimization toolbox was used to carry out the simulation and optimization. A simulation has been done with a prediction and control horizon of 3 h (n¼6, N¼3 and Nu¼3) and taking a sample time of 1 h.
Results and discussion
For the second case study, some results for 140 h of operation are shown in Figs. 10e17. The results confirm the correct operation of the advanced control system for this case.Fig. 10
shows the power available for the electrolysis. Effectively, the available power is always slightly bigger than the power consumed by the electrolyzers. Unlike the previous case study, where the available power was almost equal to the
consumed power, in this second case study the difference is bigger because the electrolyzer parameters are not ideal.
Figs. 11e13show the performance of the three high pro-duction electrolyzers. As expected, they are not switched on/ off very frequently. In comparison with the previous case study, it can be seen that the power was shared between all the electrolyzers, so it is shown that the more electrolyzers installed, the fewer disturbances the system has becausea
tries to be in the nominal operating point.
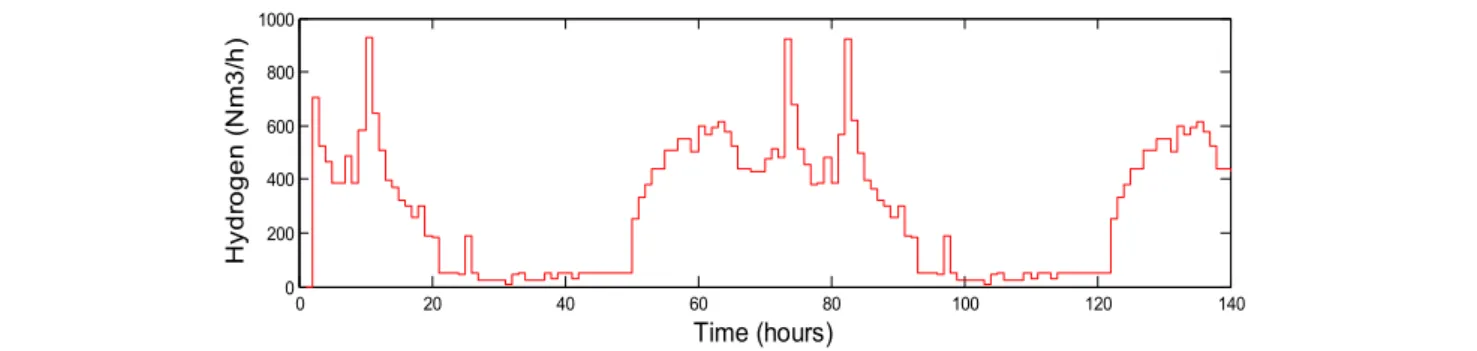
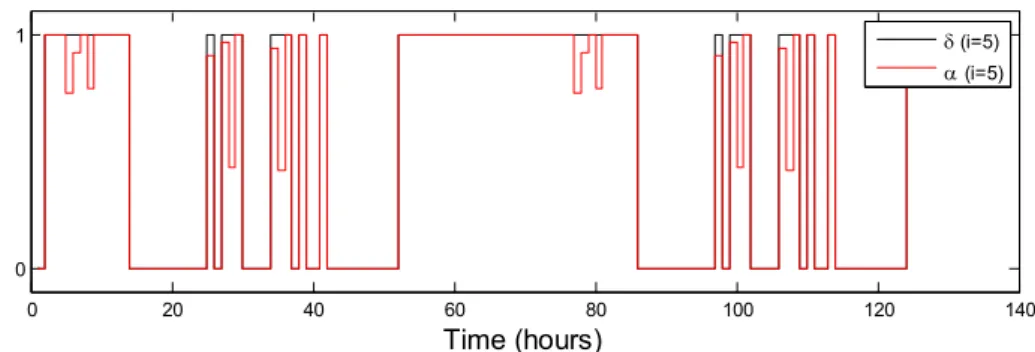
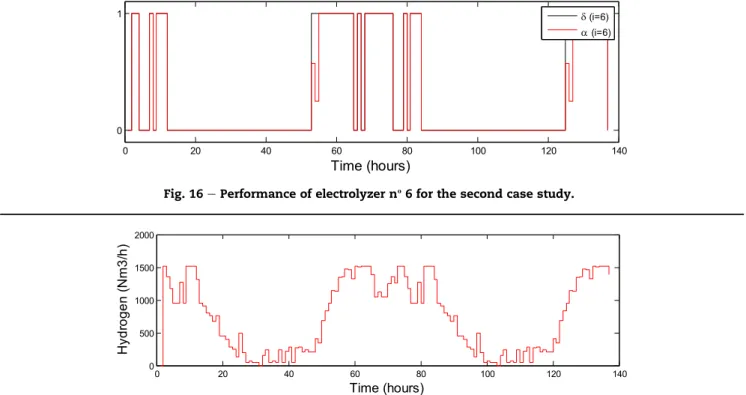
Figs. 14e16depict the results for the three small produc-tion electrolyzers. The performance of these electrolyzers can be considered correct because they operate between the constraints designed in this case study and they are also used more as they have better performance.
The last figure (Fig. 17) shows the production of hydrogen for all the 6 electrolyzers in this second scenario. The devices produce the maximum amount of hydrogen they can, so the design of the control algorithm can be considered efficient.
Fig. 9eHydrogen production for the first case study.
Fig. 10ePower available and consumed second case study.
Fig. 12ePerformance of electrolyzer nº2 for the second case study.
Fig. 13ePerformance of electrolyzer nº3 for the second case study.
Fig. 14ePerformance of electrolyzer nº4 for the second case study.
Finally, to summarize this second scenario, some perfor-mance indices and consumptions are presented inTable 1. These results confirm the high H2mean production obtained from the
available power and also the small number of ON/OFF cycles. If compared to the ideal scenario of case 1, the real perfor-mance of scenario 2 can be considered very good. Note that, only when the available power was very low, did the controller not find a proper solution and the consumed power was under the desired value. This result is expected because of the constraints imposed on the minimum values of the operating points. In terms of power distribution between electrolyzers and switch-ing ON/OFF of the equipment, both scenarios had expected re-sults, confirming the good performance of the control strategy.
Conclusions
An Energy Management System algorithm based on a Model Predictive Control is proposed and tested to optimize and balance the H2production for an offshore plant, which includes a set of
electrolysis units, following the power provided by variable renewable energy sources (wind and waves). Using the Smart Grid concept, the characteristics of each electrolyzer are considered to improve the state-of-health of the units. The proposed approach has been validated using real data measured from a certain location in the north Atlantic Ocean, which is used to verify the correct operation of the platform with the designed controller.
The main conclusions of this study are the following:
1- The Mixed-Integer-Quadratic-Programming for the MPC allows the operating point of each electrolysis unit and its connections or disconnections to be regulated.
2- In the two cases studies, the error between the predicted and desired power consumed by each electrolyzer is minimized for all the devices along the prediction horizon. 3- The operation of the electrolysis set is maximized, since the discrete variables defining the connection/disconnec-tion condiconnection/disconnec-tion of the electrolysis is acconnection/disconnec-tioned along the prediction horizon, as much as possible.
4- The MPC control strategy ensures the continuity of the H2
production, since the energy consumed by the electrolysis is almost equal to the energy supplied from the wind and waves during the prediction horizon.
5- The electrolyzers'state of health is ensured, thanks to the minimization of the switching between the connection/ disconnection states.
Acknowledgments
This work was supported by MICINN 2014-54530-R and the European Commission (7th Framework Programme, grant
Fig. 16ePerformance of electrolyzer nº6 for the second case study.
Fig. 17eHydrogen production for the second case study.
Table 1ePerformance indices and consumptions of the
simulation in scenario 2.
Power available
(kW per day)
Power consumed
(MWh per day)
H2produced
(Nm3/h)
27046.4 24249.8 (88.6%) 726.89
Electrolyzer 1st
(ON/OFF cycles per day)
Electrolyzer 2nd
(ON/OFF cycles per day)
Electrolyzer 3rd
(ON/OFF cycles per day)
2.91 0.85 2.91
Electrolyzer 4th
(ON/OFF cycles per day)
Electrolyzer 5th
(ON/OFF cycles per day)
Electrolyzer 6th
(ON/OFF cycles per day)
agreement 288145, Ocean of Tomorrow Joint Call 2011). A. Serna thanks the financial support given by Junta de Castilla y Leon EDU/1083/2013. Part of this work was carried out financed by a mobility grant given by the University of Val-ladolid (Call 2015). Prof. Normey-Rico thanks CNPq-Brazil for financial support under projects 305785/2015-0 and 401126/ 2014-5. Dr. Yahyaoui is funded by a grant and a project (FAPES 0838/2015) from the Fundac¸ao de Amparo~ a Pesquisa e Inovac¸~ao do Espirito Santo (FAPES), Brazil.
Nomenclature
n Number of electrolysis units N Prediction horizon
Nu Control horizon
i Subscript of each electrolysis unit (from 1 to n)
di(k) Binary variable: ON/OFF electrolysis unit i at instant
k b
di(k) Prediction of the binary variable: ON/OFF electrolysis unit i at instant k
ai(k) Operating point of electrolysis unit i at instant k
b
aiðkÞ Prediction of the operating point of electrolysis unit i at instant k
zi(k) Auxiliary variable of electrolysis unit i at instant k
Dzi(k) Increase of the auxiliary variable of electrolysis unit i
at instant k c
DziðkÞ Prediction of the increase of the auxiliary variable of electrolysis unit i at instant k
Hi(k) Hydrogen production of electrolysis unit i at instant
k, Nm3/h
ai Slope of power model of electrolysis unit i, kWh/Nm3
bi Offset of power model of electrolysis unit i, kWh/
Nm3
ai ai Minimum and maximum operating points of electrolysis unit i, %
Hi Maximum H2production (Nm3/h) of electrolysis unit
i
Pi(k) Power consumption of electrolysis unit i at instant k,
kW
Pi Rated power of electrolysis unit i, kW b
PavailableðkÞ Prediction of power available to electrolysis at instant k, kW
QH Weighting of the error
Qd Weighting of the control variable
J Quadratic cost function, Nm3/h
M Quadratic part of the cost function l Linear part of the cost function A, B Constraints matrices
f Free response
G Gain of the manipulated variable X Decision vector
k Time index
r e f e r e n c e s
[1] Larsson M, Mohseni F, Wallmark C, Gr€onkvist S, Alvfors P. Energy system analysis of the implications of hydrogen fuel
cell vehicles in the Swedish road transport system. Int J Hydrogen Energy 2015;40(35):11722e9.
[2] Serna A, Tadeo F. Offshore hydrogen production from wave energy. Int J Hydrogen Energy 2014;39(3):1549e57.
[3] Sarrias-Mena R, Fernandez-Ramı´rez LM, Garcı´a-V azquez CA, Jurado F. Electrolyzer models for hydrogen production from wind energy systems. Int J Hydrogen Energy
2015;40(7):2927e38.
[4] Andrews J, Shabani B. Re-envisioning the role of hydrogen in a sustainable energy economy. Int J Hydrogen Energy 2012;37(2):1184e203.
[5] Ribeiro AED, Arouca MC, Coelho DM. Electric energy generation from small-scale solar and wind power in Brazil: the influence of location, area and shape. Renew Energy 2016;85:554e63.
[6] Mostafaeipour A, Khayyami M, Sedaghat A, Mohammadi K, Shamshirband S, Sehati MA, et al. Evaluating the wind energy potential for hydrogen production: a case study. Int J Hydrogen Energy 2016;41(15):6200e10.
[7] Boscaino V, Cipriani G, Curto D, Di Dio V, Franzitta V, Trapanese M, et al. A small scale prototype of a wave energy conversion system for hydrogen production. In: IECON 2015e41st Annual Conference of the IEEE Industrial Electronics Society; 2015. Yokohama, Japan.
[8] Ghribi D, Khelifa A, Diaf S, Belhamel M. Study of hydrogen production system by using PV solar energy and PEM electrolyser in Algeria. Int J Hydrogen Energy 2013;38(20):8480e90.
[9] Serna A, Torrijos D, Tadeo F, Touati K. Evaluation of wave energy for a near-the-coast offshore desalination plant. In: World Congress on Desalination and Water Reuse (IDA); 2013. Tianjin, China.
[10] Bensmail S, Rekioua D, Azzi H. Study of hybrid photovoltaic/ fuel cell system for stand-alone applications. Int J Hydrogen Energy 2015;40(39):13820e6.
[11] Martı´nez M, Molina MG, Machado IR, Mercado PE, Watanabe EH. Modelling and simulation of wave energy hyperbaric converter (WEHC) for applications in distributed generation. Int J Hydrogen Energy 2012;37(19):14945e50. [12] Joshi AS, Dincer I, Reddy BV. Solar energy production: a
comparative performance assessment. Int J Hydrogen Energy 2011;36(17):11246e57.
[13] Valverde L, Pino FJ, Guerra J, Rosa F. Definition, analysis and experimental investigation of operation modes in hydrogen-renewable-based power plants incorporating hybrid energy storage. Energy Convers Manage 2016;113:290e311.
[14] Kalinci Y, Hepbasli A, Dincer I. Techno-economic analysis of a stand-alone hybrid renewable energy system with hydrogen production and storage options. Int J Hydrogen Energy 2015;40(24):7652e64.
[15] Serna A, Tadeo F. Offshore desalination using wave energy. Adv Mech Eng 2013;5:539857.
[16] Samrat NH, Ahmad N, Choudhury IA, Taha Z. An off-grid stand-alone wave energy supply system with maximum power extraction scheme for green energy utilization in Malaysian Island. Desalin Water Treat 2016;57(1):58e74. [17] Alwi SRW, Rozali NEM, Abdul-Manan Z, Klemes JJ. A process
integration targeting method for hybrid power systems. Energy 2012;44(1):6e10.
[18] Serna A, Normey-Rico JE, Tadeo F. Mixed-integer-quadratic-programming based predictive control for hydrogen production using renewable energy. In: 7th International Renewable Energy Congress (IREC); 2016. Hammamet, Tunisia.
[19] Stoutenburg ED, Jenkins N, Jacobson MZ. Power output variations of co-located offshore wind turbines and wave energy converters in California. Renew Energy
[20] Mo J, Dehoff RR, Peter WH, Toops TJ, Green JB, Zhang FY. Additive manufacturing of liquid/gas diffusion layers for low-cost and high-efficiency hydrogen production. Int J Hydrogen Energy 2016;41(4):3128e35.
[21] Ebbesen SD, Jensen SH, Hauch A, Mogensen MB. High temperature electrolysis in alkaline cells, solid proton conducting cells, and solid oxide cells. Chem Rev 2014;114(21):10697e734.
[22] Dumortier M, Marcano JS. Analytical evaluation of heat sources and electrical resistance of a cermet electrode for the production of hydrogen in a membrane reactor. Int J Hydrogen Energy 2015;40(8):3566e73.
[23] Petersen HN. Note on the targeted hydrogen quality produced from electrolyser units, Review of the Department of Energy Conversion and Storage. Technical University of Denmark; 2012.
[24] Rashid MM, Al Mesfer MK, Naseem H, Danish M. Hydrogen production by water electrolysis: a review of alkaline water electrolysis, PEM water electrolysis and high temperature water electrolysis. Int J Eng Adv Technol 2015;1(4):2249e8958. [25] Morgan ER, Manwell JF, McGowan JG. Opportunities for
economies of scale with alkaline electrolyzers. Int J Hydrogen Energy 2013;38(36):15903e9.
[26] Aranguren P, Astrain D, Santa Marı´a M, Rojo R.
Computational study on a thermoelectric system used to dry out the hydrogen produced in an alkaline electrolyzer. Appl Therm Eng 2015;75:984e93.
[27] Serna A, Normey-Rico JE, Tadeo F. Model predictive control of hydrogen production by renewable energy. In: Renewable Energy Congress (IREC), 2015 6th International. Sousse. Tunisia: IEEE; 2015. p. 1e6.
[28] Camacho EF, Bordons C. Model predictive control. Springer; 2013.
[29] Gutierrez-Martı´n F, Confente D, Guerra I. Management of variable electricity loads in windehydrogen systems: the case of a Spanish wind farm. Int J Hydrogen Energy 2010;35(14):7329e36.
[30] Torrico BC, Roca L, Normey-Rico JE, Guzman JL, Yebra L. Robust nonlinear predictive control applied to a solar collector field in a solar desalination plant. IEEE Trans Control Syst Technol 2010;18(6):1430e9.
[31] Scherer HF, Pasamontes M, Guzman JL, Alvarez JD, Camponogara E, Normey-Rico JE. Efficient building energy management using distributed model predictive control. J Process Control 2014;24(6):740e9.
[32] H2Ocean-project.eu.'H2ocean'. N.p., 2016. Web. 23 March 2016. Available at:http://www.h2ocean-project.eu/. [33] Khalid M, Savkin AV. A model predictive control
approach to the problem of wind power smoothing with controlled battery storage. Renew Energy
2010;35(7):1520e6.
[34] De Prada C, Sarabia D, Cristea S, Mazaeda R. Plant-wide control of a hybrid process. Int J Adapt Control 2008;22(2):124e41.
[35] Salazar J, Tadeo F, Valverde L. Predictive control of a renewable energy microgrid with operational cost optimization. In: Industrial Electronics Society, IECON 39th Annual Conference; 2013. Vienna, Austria.
[36] Wang M, Wang Z, Gong X, Guo Z. The intensification technologies to water electrolysis for hydrogen productione a review. Renew Sustain Energy Rev 2014;29:573e88. [37] Plucenio A, Pagano DJ, Bruciapaglia AH, Normey-Rico JE. A
practical approach to predictive control for nonlinear processes. In: NOLCOS 2007. Proceedings of the NOLCOS 2007; 2007. Pretoria, South Africa.
[38] Bemporad A, Morari M. Control of systems integrating logic, dynamics, and constraints. Automatica 1999;35(3):407e27. [39] da Costa Mendes PR, Normey-Rico JE, Bordons C. Economic
energy management of a microgrid including electric vehicles. In: Innovative Smart Grid Technologies Conference Latinoamerica ISGTL; 2015. Montevideo, Uruguay.
[40] Dietrich K, Latorre JM, Olmos L, Ramos A. Demand response in an isolated system with high wind integration. Power Syst 2012;27(1):20e9.
[41] Appendini CM, Urbano-Latorre CP, Figueroa B, Dagua-Paz CJ, Torres-Freyermuth A, Salles P. Wave energy potential assessment in the Caribbean Low Level Jet using wave hindcast information. Appl Energy 2015;137:375e84. [42] Borg M, Shires A, Collu M. Offshore floating vertical axis wind