A NETWORK APPROACH TO SERVICES INTERNATIONALISATION
STEFANO VISINTIN
FUNDACIÓN DE LAS CAJAS DE AHORROS DOCUMENTO DE TRABAJO
Nº 636/2011
De conformidad con la base quinta de la convocatoria del Programa de Estímulo a la Investigación, este trabajo ha sido sometido a eva- luación externa anónima de especialistas cualificados a fin de con- trastar su nivel técnico.
ISSN: 1988-8767
La serie DOCUMENTOS DE TRABAJO incluye avances y resultados de investigaciones dentro de los pro- gramas de la Fundación de las Cajas de Ahorros.
Las opiniones son responsabilidad de los autores.
A NETWORK APPROACH TO SERVICES INTERNATIONALISATION
Stefano Visintin1
Abstract
The complex set of international relations linking the services sectors of developed economies composes networks of countries whose structures are still an unexplored field. Indeed, most of the existing studies on this subject focus on bilateral relations and country characteristics, and fail to provide a picture of the complex set of interrelatedness. This article aims to fill this gap by studying the topology of the multinational networks of trade and foreign direct investment in tertiary activities. An exploratory network analysis is performed, by the means of Social Network Analysis techniques, in order to investigate the structure of these networks and the roles played by different countries within them. Two networks representing trade and foreign direct investment relations respectively are studied. The existence of a central group of countries as well as geographical clusters and less integrated economies, in both the trade and the FDI network, is confirmed by all the indicators employed.
Keywords
: Services, network analysis, international trade, FDI.JEL classification
: F02; F14; F21
1Departamento de Economía Aplicada, Universidad de Alcalá, Madrid, Spain. [email protected].
The author acknowledges Professors Luis Rubalcaba and Juan Ramón Cuadrado, Universidad de Alcalá; and the useful comments received by Benjamin Schön, University of Hohenheim.
1. Introduction
The globalisation of the service sector is a complex process involving all the developed economies. The main causes of complexity are the specific characteristics of services activities, such as their intangibility and simultaneity. Thus, their internationalisation process follows different strategies according to different modes of provision. The high relevance of tertiary activities within the process of globalisation is out of doubt. Indeed, while the international exchanges during the 1980s were dominated by industrial interchanges, the 1990s witnessed a surge in volume and importance of flows related to the service sector that continues today. This fact is particularly evident when the whole process of globalisation, and not only trade exchanges, is taken into account; in other words, when their complex internationalisation is considered. A huge and increasingly important part of this process is in fact happening through other modes that can be observed through foreign direct investment (FDI) data. Today, services account for the largest share of such investments in most of the developed economies.
In a globalised service economy such as today’s world economy, it is of great interest to improve our understanding of the mechanism governing the international relations in the tertiary sector. The particular structure of the process influences the way that globalisation proceeds and its outcomes. So far, only a few studies have investigated the international relations focusing on the structure it assumes at the world level, while the great majority of the existing literature focuses on the characteristics of the countries involved.
According to the definition proposed by the US National Research council (2005), network science is a research field focusing on network representations of physical, biological, and social phenomena leading to predictive models of these phenomena. The international relations concerning tertiary activities maintained by the countries at the centre of the globalisation process represent the kind of system studied by network science. Indeed the study of social (and therefore economic) networks is a branch of network science that found several applications and has grown into the field of Social Network Analysis (SNA). SNA has been applied in the literature to study trade relations between countries and has produced interesting outcomes regarding the role played by the different economies in the process.
As stated above, service internationalisation goes beyond trade flows. Its heterogeneity in international provision finds a framework in a four-mode classification (United Nations Statistical Division, 2002).2 We apply SNA to different sets of data as proxies for the exchanges taking place via these modes, in order to present an innovative picture of the whole process. The novelty of this approach consists of the perspective taken. While most empirical work in this field takes into consideration only first-degree (bilateral) relations between countries and combines them with country-specific characteristics (see for example Grunfeld and Moxnes, 2003; or Kimura and Lee, 2006 as an example), SNA allows capturing the effects induced by the whole
2 This classification is based on who, or what, crosses the national border: services crossing borders, Mode 1 of provision; clients crossing borders, Mode 2; investment crossing borders, Mode 3; temporary employment or self- employed crossing borders, Mode 4.
3
system of international interactions3. This method of analysis deals with sets of relational data (e.g. all the trade flows maintained by a group of countries in a certain period) and is capable of implementing a mathematical breakdown of the system, describing its patterns and characteristics. Thus SNA focuses the attention on the process of globalisation as a whole rather than on the characteristics of the global actors.
The aim of this paper is to map the topology of service internationalisation employing network-based measures to data on trade and FDI of services between a large sample of countries. Since this represents the first attempt, to our knowledge, to apply these techniques to the service internationalisation process, exploratory SNA tools will be implemented. Some economic explanation of the patterns observed is given, however providing a comprehensive justification of the phenomena goes beyond the intention of the present research. The whole analysis is implemented on service aggregate data, leaving the consideration on specific sectors open for further research developments. Few references on specific activities are made, nevertheless their intention is purely indicative and do not pretend to exhaustively investigate the role played by the services activities composing the aggregate.
The questions we aim to answer concern the macro-properties of the network of international relations in the tertiary sector are: does the process of internationalisation in the tertiary sector show a specific structure? In particular, is there a core–periphery structure with some countries playing a more central role and others being less integrated? Is it possible to identify and distinguish different clusters of countries? Are there differences between the trade and the FDI network?
The rest of the article is structured as follows. The first part of Section 2 consists of an overview of SNA, focusing on the potential advantages of its employment in the analysis of economic relation data. The second part of this section presents a survey of the literature applying this method to international relations figures. Section 3 presents the data studied in this article and describes the methodology of the empirical analysis. The results of this analysis are presented and discussed in Section 4. Finally Section 5 summarises the main outcomes of the research and proposes further areas of research.
2. A Survey
Social Network Analysis is a method of analysis developed to work with relational data (i.e. data referring to the relations maintained by actors such as persons, countries, companies, etc.). The focus of attention moves from the characteristics of the individual actor to the characteristics of the relations maintained by this actor with others and to the structure formed by all the relations maintained by the actors: the network. One of the most important features of SNA is that it is capable of mathematically investigating the structure of the network in order to highlight and interpret its characteristics.
3The full system of interactions between actors is captured by network analysis when complete database are analysed.
Empirical literature on international economic relations developed so far, including the present work, had to deal with data limitations circumscribing the extent of the analysis.
4
This analytic approach aims to produce different sorts of information through the identification of the kind of structure and the properties of the network. This means that the tools provided by SNA are capable of measuring persistent patterns, relations and forces acting on the networks agent. Once this information is produced we can apply a series of theories to interpret the complex outcomes provided and explain the present scenarios and potential future development. Examples of issues treated by SNA are the network position of each actor, the degree to which an individual is at the centre of many relationships, the characteristics of the relations or the access to relevant positions. Being able to extract and make sense of information of this kind represents a fundamental step in the understanding of several kinds of (social) structure. SNA is therefore applied in numerous fields of research such as sociology, biology, medicine, geography, information sciences and economics. Nowadays strong need for new fundamental understanding stressing the systemic complexity of economic networks was also underlined by the Science journal (Schweitzer et al., 2009). Within economics it is often a tool used in financial exchanges, international trade and globalisation studies.
The so-called globalisation process, intended here as the internationalisation of economies and the high growth of international economic relations, has experienced acceleration during the last decades. Services internationalisation is, jointly with the rise of huge exporters, an important phenomenon within this process (García et al., 2009) and deserves the attention of researchers. It is a phenomenon characterised by a growth of international bilateral relations in the tertiary sector between countries or regions. In the literature, these relations are empirically approached through the analysis of data such as international trade or FDI figures.
Traditionally international trade was the centre of attention, but the role of FDI has lately been recognised as fundamental to the understanding of the present dynamics (Mayer-Foulkes, 2009). If we approach globalisation considering countries as actors and the relations maintained by several countries as links and we consider the whole picture, we obtain a complex structure:
a network. Countries, being the actors in our network, represent nodes, and vertices and their economic relations are links. As in most networks, it appears clear that the structure of ties and its patterns has an inevitable influence on the possibilities of the actors involved. This situation raises the need for tools capable of interpreting a complex set of relations and making them clearer to the observer. Since SNA provides methods for the numerical assessment of these structures, its application to international relations, such as those maintained through trade and FDI in services, could help researchers to understand and interpret the process of globalisation.
Most of the analyses carried out in this field explain international relations on the basis of the individual characteristics of the countries involved. For example, trade and FDI bilateral flows are often seen as the outcome of country-specific characteristics such as factor endowments, GDP or productivity levels. Empirical international trade models of these kinds are able to explain a large amount of international relations. Nevertheless, it is reasonable to think that the flows between two countries do not exclusively depend on the characteristics of the countries, but that the environment in which they act, e.g. a globalised world, can influence
5
exchange volumes. The SNA approach is therefore a natural complement to the empirical analysis based on international trade models.
Indeed, SNA goes beyond what is usually studied by other methods. Most of the approaches to this subject concentrate the analysis on the first-step/bilateral relations exclusively, while SNA proposes tools to investigate the extent to which the structure of ties influences the whole group of relations. In a given period, this methodology can take into consideration the whole structure of the trade network, for example. From this point of view the international relevance of a country is no longer given exclusively by its particular characteristics, but also by its role in the network. This is in line with a more comprehensive interpretation of economic phenomena. In fact, in economics the centre of attention is seldom the value of a variable referring to an actor, e.g. the productivity of country A, but how this value relates to the value expressed by other actors, the productivity of country A face to face with the productivity of the rest of the countries competing on the same markets.
Consequently, network science proposes a new point of view on international relations.
According to Hafner-Burton et al. (2009), the value added of applying network analysis to these fields is triple: the precise description of international relations that it is able to provide, the possibility of distinguishing network-specific features’ effects within the globalisation phenomenon and the development of new sources of data. SNA can also represent a useful instrument in order to test international relation theories. Furthermore, better knowledge on network functioning gives the actors the possibility to increase their relative “power” by exploiting their network position.
The roots of the application of network analysis to international relations can be found in some inaugural work published during the 1940s. The League of Nations (1942) and Hilgerdt (1943) represent the pioneers of this perspective since they produced the first publications in which world trade is presented as a network and not only as a set of bilateral exchanges of goods and services. This point of view remained undeveloped for decades. It was only during the 1960s that further advances were made in this line of thought. During this and the following decade, a group of statisticians and sociologists, Savage and Deutsch (1960), Brams (1966;
1969) and Snyder and Kick (1979) among others, exploited network analysis in order to classify countries on the basis of their trade relations.
The evolution of network analysis techniques (among which SNA), jointly with the advances made in the field of international economics, prepared the ground for a new round of research founded on network science with the aim of describing the patterns of international trade relations. This research took place during the first ten years of the present century and consists of a series of papers elaborated within a new interdisciplinary scientific area that springs from the collaboration between researchers from an economic background and researchers in other sciences such as physics, mathematics, automation or informatics. This new interdisciplinary research field, where methodologies and theories from various scientific areas are applied to economics, was given the name econophysics.
6
The main aim of the very first network analysis applications elaborated within this research area was to test whether international trade can actually be seen as a network. The network structure of countries and international trade flows is usually named the international trade network (ITN) or world trade web (WTW). These studies also aim to determine whether the trade network is a complex type of network. In a few words this means employing network analysis to understand whether this system of relations follows certain (predictable) rules and whether it can be modelled according to these rules.
It is found (Xian et al., 2003) that the WTW is a complex network that ties countries. In accordance with this finding the role of the network in the world economic synchronisation is also tested. The particular influence of the WTW on world economics is of great interest when analysing the spreading of virtuous periods and crises. The ITN is also seen as a complex network by another contemporary work (Serrano and Boguña, 2003). Social and technological networks can actually be considered the paradigm of complex networks. The research by Garlaschelli and Loffredo (2004) represents another step in the investigation into the properties of the WTW as a network. The main relevance of the study lies in the empirical tests implemented that show how the topology (the structure of the connections) of the web is strongly determined by the economic dimensions of the actors.
More recent studies have followed this line of research and aimed to describe the main patterns of the ITN through the application of network analysis techniques. The main advance with respect to the papers cited so far is that the new research refers to the WTW as a weighted network. The former papers treated the links connecting countries as binary relations, which means that they were given the value of zero, where no link was present, and one, where a trade flow between the two countries existed. Most recent works weight each link by assigning it the value of the exports and/or imports between the countries studied. Taking into consideration this heterogeneity is essential when describing such a complex series of international relations.
The topological properties of the WTW are therefore seen from this perspective (Fagiolo et al., 2008). The weighted network analysis is capable of demonstrating how the majority of world trade links consist of low-volume trade and that countries holding more intense relationships are keener to trade with each other; this means that they form trade clusters.
Similar conclusions are achieved by Bhattacharya et al. (2008) in their analysis highlighting the scale invariance and other universality properties of the ITN. Following the same line, Fagiolo et al. (2009) study the topological properties of the WTW, focusing on its dynamics and its evolution over time. The complementarity of SNA with other techniques is proved by Fagiolo (2010), who first applies a gravity model in order to control several determinants of trade flows and then infer network characteristics through network analysis. All the cited works belong to the econophysics framework. Nevertheless their focus is more on physics than on economics.
In other words, they share a common “limit”; they do not aim to describe economic relations but emphasize research methods. Most of them address the demonstration of how trade relations form networks and the description of the topological properties of these networks, but they do not aim to investigate explanations or reasons at the bases of the observed relations.
7
Another research line centred on exploring, with the help of SNA, international economic relations has developed simultaneously and in cooperation with the research cited above.
During the last years we can observe the flourishing of a stream of research including several articles applying SNA to increase the knowledge on the economic relations behind trade relations.
It is worth citing, among others, the work of Serrano et al. (2007), who study the patterns of trade networks highlighting global and local heterogeneity. In particular the authors make use of SNA to evidence how geographical, political and historical relationships affect trade patterns.
In addition, they study the role of the international network as a substrate for the propagation of crisis, since trade is seen as a vehicle of the influence of one economy on the other. The economic interpretation of SNA applied to the WTN is the focus of other works such as the extensive paper by De Benedictis and Tajoli (2011). Another example of research aimed at mapping the topology of the WTW and giving it an economic explanation is the work produced by Kali and Reyes (2007). In the latest article the results of the network analysis are combined with a growth model so that the relation between the network position and the economic growth is highlighted.
Reyes et al. (2007) create new indicators based on weighted network analysis to substitute standard openness measures. They make use of these indicators in order to assess the international economic integration. In particular they study whether the implementation of different international economic policies in Asia and Latin America made a difference to growth and stability patterns. The authors are able to draw different images of how world trade is composed. At low levels of trade, the network seems decentralised and homogeneous, while when higher levels of trade are taken into consideration the WTN looks centralised and a core–
periphery structure can be discerned. The paper is another example of the complementarity of SNA with other techniques. An important outcome is that the authors include some indices elaborated by applying SNA to a growth model highlighting that the included variables are statistically significant and present the expected signs. On the same line Riccaboni and Schiavo (2009) apply SNA to a set of micro-data to describe the prominent role played by the extensive margins of trade in explaining a large amount of the exports of the most important economies.
Despite it does not apply SNA techniques, it is worth quoting the paper by Baskaran et al.
(2011) where it can be seen how network analysis can also be an instrument in testing economic theories. These authors test the prediction of the Heckscher-Ohlin model on factor endowment and trade relations making use of a network approach to international trade data of 28 product groups. SNA had been also applied in studies focusing specifically on the services sector but not taking into consideration the international dimension. In this field it is worth citing the recent article by Scott and Laws (2010) on the advances in services networks research.
8
3. Data and Methodology
The structure of the present section is threefold. In the first part we present the data studied and define the networks that are the object of the analysis. Following this, the methodology applied in our research approach is described, making a distinction between the measures quantifying country-specific characteristics and the techniques applied to the networks as a whole.
Data description
As explained in the previous sections, the objects of study of the empirical analysis are the relations maintained by countries at the world level in the service sector. The internationalisation of the tertiary sector is a complex process taking place through different channels of provision (see Rubalcaba and Cuadrado, 2002 or Visintin and Rubalcaba, 2010, among others). The four modes of provision classification are nowadays a widely accepted framework for its analysis. So far, data on the volumes of flows classified under these four modes are still not available. Therefore empirical studies rely on data describing trade and FDI volumes. It is straightforward from the modes’ definition that data on trade relations proxy for international provision taking place under Mode 1, Mode 2 (travel and tourism figures) and partially Mode 4 (WTO, 2006). The existing literature considers FDI data as proxies for exchanges under Mode 34 (see for example United Nations Statistical Division, 2002; Nordas and Kox, 2009; or Magdeleine and Maurer, 2008).
Following this distinction, two different kinds of network are identified. In both cases countries represent the actors (or vertices). In the first one the link between two vertices is defined as the value of bilateral trade between the two countries; in the second one the value of the stock of FDI invested by one country in another identifies their economic relation.
The data included in the international trade network (ITN) were supplied from OECD Stat.
We extracted the figures representing the exports between 26 countries5 referring to the year 2006. The sample can be considered as a good approximation of global service trade. Indeed the export flows taken into consideration represent more than 90% of the flows registered by the OECD database. According to the WTO data the countries included in our sample are responsible for more than 70% of the total world service trade in the considered year.
Furthermore it is worth noticing that they represent 26 out of the 35 countries with the highest service trade volumes. From a geographical perspective, even though the sample is decidedly Europe-oriented; all the continents but Africa are represented.
Networks are composed of bilateral relations data listed in matrices. In order to construct a full 26×26 matrix 650 export relations are needed (considering the fact that countries cannot
4FDI figures are often complemented by data on Foreign Affiliates Statistics.
5 Austria (at), Australia (au), Belgium (be), Canada (ca), the Czech Republic (cz), Germany (de), Denmark (dk), Spain (es), Finland (fi), France (fr), Greece (gr), Hong Kong (hk), Hungary (hu), Ireland (ie), Italy (it), Japan (jp), Luxembourg (lu), the Netherlands (nl), Norway (no), Poland (pl), Portugal (pt), Russia (ru), Sweden (se), Slovakia (sk), the United Kingdom (uk) and the United States (us).
9
export to themselves). However the data provided by the database were not complete. Two assumptions were made in order to impute values to the missing data. We made use of import data assuming that the exports from country i to country j correspond to the imports of country j from country i6, Xij Mji in 79 cases; and we made the assumption that Xij Xji in 5 further cases. The first assumption is straightforward. The second assumption is justified by the fact that international trade theories explain trade flows as (partially) determined by some economic dimensions of the countries involved (e.g. the countries’ GDP). Empirical models such as the gravity models support this view. Since most of these dimensions determining trade volumes are the same from both sides of the flows,7 it is reasonable to think that the volume of export from country i to country j will be similar to the volume of export from country j to country i.
The network of the FDI relations (FDIN) was created using data on the relations between 23 countries8 in 2006. In this case the source database was created by Eurostat. Due to data availability, only European countries and the USA are considered in this case. Consequently the FDIN does not aim to represent the world internationalisation network of direct investment, but the network of the majority of most developed countries. The data included in the analysis represent 98% of the total value of FDI registered by the Eurostat database for the year 2006.
According to the UNCTAD data9 the FDI considered represents approximately 42% of the total world stock of FDI in services for the reference year. Therefore and as a result of the relevance of the European and North American economies at the world level, the behaviour of the FDIN can be considered as an approximation of the conductions at the world level. Since the collection of data on FDI is constantly increasing its quality it is feasible that future research in this field will benefit from more complete data collection. Following the assumption explained above, of the 506 figures needed to construct the FDI relations matrix, 51 were obtained by assuming that outwardFDIij inwardFDIji
; 30 relations were estimated as
ji ij outwardFDI outwardFDI
.
Several network measures, which will be presented in the following section, are designed to analyse unweighted networks. This means that, when applied to a network, these measures take into consideration the presence of a link between two actors, but not the value of that link.
Since our database allows for the consideration of the magnitude of the economic relations we decided to follow Kali and Reyes (2007) and construct, in each case (IT and FDI), three
6Even though this symmetry seems obvious, the complex construction process of international trade databases often
produces statistics where Xij Mji
.
7Gravity models, for example, show how trade flows from country i to country j are proportional to the product of the two countries’ GDP divided by the distance between them. This relation is symmetrical.
8 Bulgaria (bg), Cyprus (cy), the Czech Republic (cz), Germany (de), Denmark (dk), Estonia (ee), Spain (es), Finland (fi), France (fr), Greece (gr), Hungary (hu), Ireland (ie), Italy (it), Lithuania (lt), Luxembourg (lu), Latvia (lv), the Netherlands (nl), Romania (ro), Sweden (se), Slovenia (si), Slovakia (sk), the United Kingdom (uk) and the United States (us).
9 See UCTAD World Investment Report 2007.
10
networks applying different thresholds. Beyond the networks composed by the full matrices expressing all the economic relations between the actors, we created two more matrices corresponding to the 1% and 5% thresholds. An export relation from country i to country j was registered only if it represented more than 1% (and 5%, respectively) of the total export flows of country i in the reference year. In this way we obtained three export matrices (all values; 1%
and 5% thresholds) and therefore three networks. The same process was applied to the FDI data. In this way we can apply measures designed to study unweighted networks to the three different networks and extract information on the relevance of the values of flows by comparing the outputs obtained. In practice, this procedure allows us to understand the sensitivity of the topological characteristics of the networks to different link magnitudes.
Since they are made by 26 and 23 countries, respectively, the networks considered in our analysis can be considered small. Even though the actors considered are the most representative economies of the service globalisation process, it implies that the measures produced, through the methodology explained in the following section, could be influenced if more actors are included.
Methodology
The analysis performed in this article can be considered as a first approach to the internationalisation of the service sector through the application of network techniques.
According to this premise we apply network methods capable of producing a bird’s-eye view of the phenomenon. We first move towards a better understanding of the role of different countries in the examined networks and successively take a closer look at the topological properties of the networks as a whole.
Therefore the first step in our approach is to propose an insight into the role of different countries within the networks. The position of a country within the internationalisation network is a valuable piece of information that can shed some light on the role played in this process.
Indeed some countries can occupy central and strategic positions within the system of relations.
Central and strategic positions within a net of economic relations carry significant meanings.
From a micro perspective, the information related to a business “travels through” a country at the centre of several relations. Operators of a particular sector working in a country at the centre of international economic relations are aware of new production processes, innovations or foreign regulation changes occurring at the world level, for example. According to Nooy et al.
(2005), actors positioned at the centre of the networks can yield power and profits since, due to their position, these actors can have better access to information and at the same time a better opportunity to spread it.
From a macro perspective, a country with a central position is keener to have greater negotiation power when international agreements take place. Economic relations can also be considered as channels for information flows, as well as channels for the synchronisation phenomenon of economic cycles (and crises). Therefore countries at the centre of the network
11
will supposedly be more involved in this phenomenon, while countries at the periphery will be less affected.
Therefore we begin the analysis by focusing our attention on measuring the centrality of the countries involved in the internationalisation networks. Since what is meant by the word central varies depending on the viewpoint, there are several measures of centrality. The first measure of centrality we propose deals with the number of links each country maintains. If a country presents several trade and investment partners, it becomes a reference point, has easier access to information and can spread it several times. The straightforward measure of this characteristic is the number of neighbours, also called the degree centrality of a vertex of the network. In order to allow for comparison we calculate the normalised degree centrality of the countries composing the networks.
If we consider a network as a series of links through which information flows, the distance between two vertices (the number of links to be passed through when moving from one node to another) gains relevance10. The shorter the path through two vertices, the faster the communications are. Consequently the shorter the distance between one actor and the rest, the easier is its access to information. For example we can affirm that if one country has direct commercial relations with all the network partners, its companies will easily be aware of the state of the art of the new production and commercialisation processes. This is a comparative advantage with respect to countries with few relations that do not have first-hand information on the evolution of these processes. This is the sort of advantage that could boost national competitiveness. Thereupon, the easier the connections between one country and the rest (i.e.
the more closely one country is connected to all the others in terms of trade or FDI flows), the greater is its comparative advantage. The measure assigning to each actor a value on the basis of its distance from all the other vertices is called closeness centrality. The normalised measure is based on the length of the average shortest path between a vertex and all the vertices and is described by the following formula:
1
' 1
1
nd C
N
j ij ci
where Ccii is the normalised closeness centrality of country i, dij is the distance between country i and country j and n is the number of countries composing the network.
A state through which the connection between two countries passes can be considered relevant to their relation. Consider the case of one firm maintaining commercial relations with two foreign partners that do not know each other. Since commercial relations imply an
10Note that in network analysis the concept of distance is indented in its virtual meaning, not physical.
12
exchange of information, it could happen that the knowledge owned by one of the foreign firms reaches the other by passing through their common partner. If this partner is the only potential connection of the two foreign firms, its “power” as an intermediary is high. From a network perspective, the more connections of otherwise unconnected actors (i.e. countries) pass through one actor (i.e. country), the more central is the latter’s position. The extent to which an actor is needed as a link is captured by the measure of betweenness centrality. It is defined by the portion of all geodesics between any pair of actors that includes the actor under consideration.11 Its normalised formula is as follows:
2 ) 2 )(
1
(
n n
g g C j k jk
i jk i
bi
where gikis the number of geodesics connecting countries j and k, gijkis the number of those geodesics passing through i and (n-1)(n-2)/2 is the number of pairs of vertices excluding vertex i.
The concepts of degree, closeness and betweeness centrality, which describe the vertices’ characteristics, can be extended to the analysis of the whole network. The extent to which a network has a centre is measured in SNA by centralisation indices. Three centralisation measures corresponding to the ones presented above are proposed. The mathematical underpinning of the three measures is based on the fact that when a network is highly centralised one of its vertices presents a high centrality and the rest of the vertices are characterised by low centrality values. This means that there is a high variance in the centrality of the vertices. Therefore, the higher the variance of the centrality of the vertices, the higher the centralisation of the network. In practice, centralisation indices are calculated as the variation in the centrality of vertices divided by the maximum variation possible in a network of the same size. In our case, high centralisation values correspond to internationalisation networks where one or a few countries play a fundamental role in the process and the rest of the countries can be considered peripheric. Low centralisation values mean that the internationalisation of the service sector is more equal and all the countries show the same relevance. Since we consider two different typologies of data, we are able to compare the centralisation of the ITNs and the FDINs.
SNA proposes more descriptive indices aimed at the presentation of the network structure other than centralisation measures. The density (defined as the number of links divided by the maximum number of potential links) and the average degree of vertices are two measures of the density of the links between countries, determining the intensity of the internationalisation process.
One of the most interesting features of SNA applied to international relations at the macro level is the possibility to investigate whether their interaction creates cohesive subgroups.
11 Ageodesic is the shortest path between two actors.
13
Beyond the observation of the “importance” of each single country through its centrality, it is very attractive to an economist to be able to understand whether these relations constitute structurally delineated subgroups defined by shared characteristics. Several techniques have been developed to this aim. We decided to present two of them here, leaving to further research the task of investigating cohesion through other tools.
First we aim to identify, within the studied networks, the existence of any sub-networks in which from each vertex it is possible to reach all the other vertices (of the sub-network) following the flow of the exports. This part of the complete network is called a strong component.
Identifying a (strong)12 component means determining the presence of a group of actors with a stronger internal cohesion than the rest of the network. In the case of service internationalisation it means identifying one or several groups of countries trading or investing more intensely with each other than with the rest of the network. The detection of components could be a first step in discovering whether the internationalisation of the service sector is composed of a core–periphery structure and whether clubs can be individuated.
Similarly, the last exploratory technique applied in the identification of cohesive subgroups concerns clusters of vertices that are firmly connected because each vertex has a minimum degree within the subgroup. This kind of subgroup, or core, is called k-core, where k stands for the minimum degree of the vertices in the subgroup. A 3-core, for example, is composed of vertices that maintain a bilateral relation with at least three other vertices of the group. Since k-cores are nested (e.g. all the vertices belonging to a 2-core also belong to a larger 1-core network), by removing low k-cores from the network we are able to individuate the core of the network or break it into cohesive subgroups. This is also a useful procedure for identifying the countries that are less integrated into the internationalisation process since they will be the first to be excluded by the k-cores identified.
4. Results
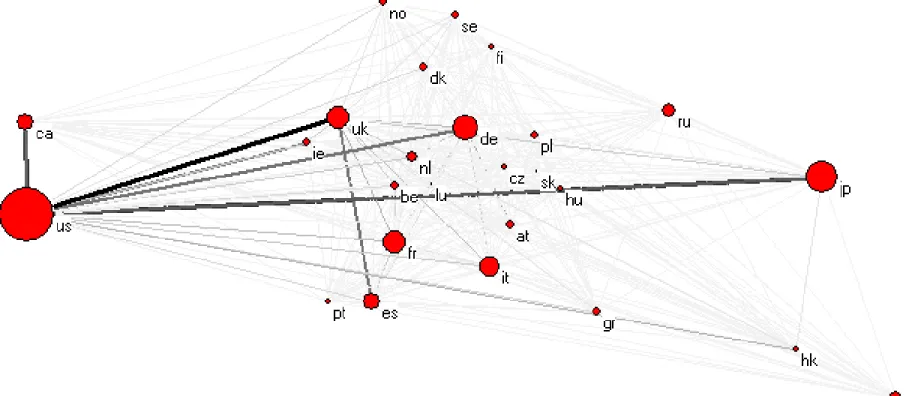
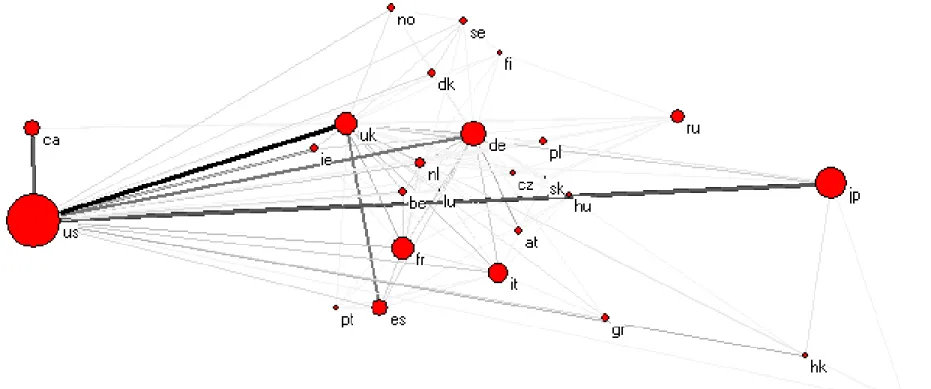
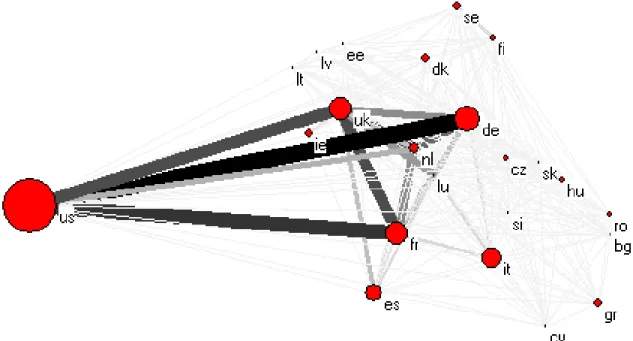
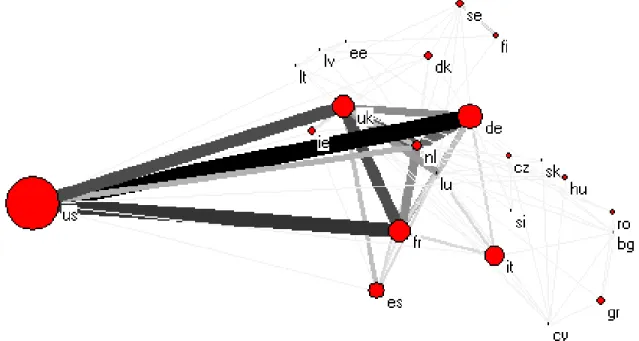
One of the main features of SNA is the wide range of graphical representation possibilities. In the first part of this section we will present different kinds of mapping of the ITN and FDIN. The first result that can be derived from the network graphical representation of the data described above concerns the differences between various thresholds. Figure 1 and Figure 2 show the representation of the complete ITN including all the trade relations and the ITN considering only the relations that represent more than 5% of the exports of each country, respectively.
In order to present visually the relation between economic importance and trade, the vertices are sized proportionally with the respective countries’ GDPs, while the width and colour of the ties indicate the volume of the service flow between the two countries. Using the same scale, Figures 3 and 4 present the graphs of two FDI networks.
12 A component in a directed network (where directed means that the links present a direction) is defined as strong if each vertex can reach all the other vertices following the direction of the links. If it is not possible to reach all the other vertices following the direction of the ties the component is defined as weak.
Figure 1. International trade network: all values
15
Figure 2. International trade network: 5% threshold
16
Figure 3. Foreign direct investment network: all values
17
Figure 4. Foreign direct investment network: 5% threshold
A visual analysis of these graphical representations permits a series of immediate insights. A first observation is the reconfirmation of the expected positive relation between the size of the economy as measured by GDP and the extent of internationalisation flows. The greatest interchanges occur between the most developed economies. A second observation, made on trade as well as FDI, concerns the introduction of the 1% and 5% thresholds. It turns out that almost 50% of the IT and FDI links do not exceed those boundaries. Of the 650 relations registered in the trade matrix and represented in Figure 1 only 392 links (60% of total) exceed 1% of the total country exports. If this threshold is moved to 5% (Figure 2) the number falls to 137 links (21% of total). Concerning the FDIN, the matrices considering all the FDI stocks and the ones constructed on the basis of the 1% and 5% thresholds are composed of 385, 203 and 113 links, respectively (100%, 52% and 29% respectively). These figures show that the great majority (around three quarters of links) of trade and investment relations in the service sector are of minor importance. Nevertheless, applying the 5% threshold, the considered links still represent, in volumes, 72% and 88% of the total trade and FDI, respectively. In other words, the internationalisation of the service sector is highly centralised:
few bilateral relations represent the large majority of total exchanges. Due to the high representativeness of the 5% threshold networks, most of the analyses performed in this paper are cantered on them.
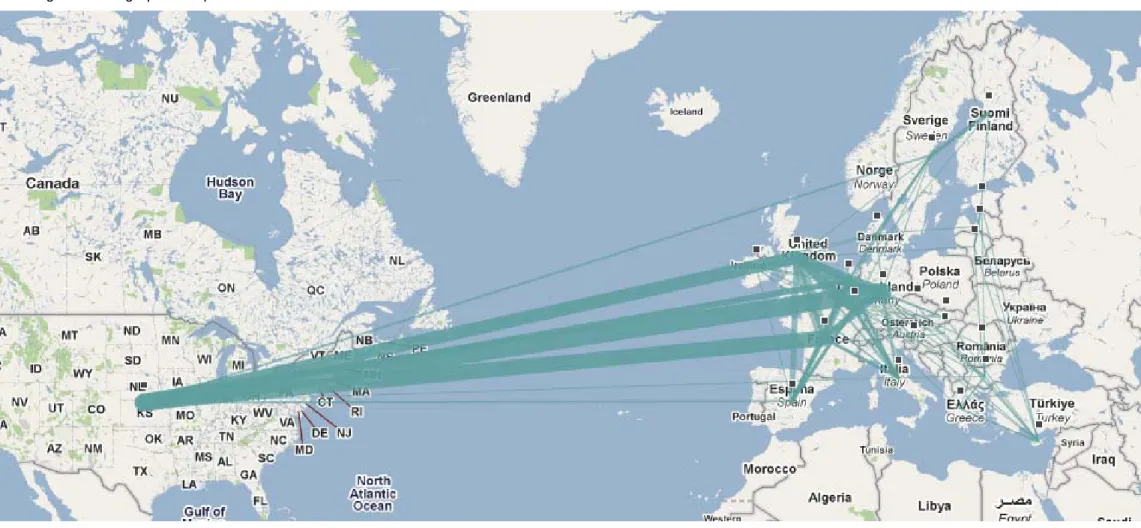
In the case of international economic relations, geographical maps provide us with a natural baseline of study. Several advances were made during the last years in the application of network relations and graph theories to geographical maps (Leydesdorff and Olle, 2010).
Making use of the latest software elaborated in this field we prepared a first overview of the services’ international networks. In order to present a clearer illustration of the IT and FDI relations, we include the maps of the 5% threshold only.13
From the graphic representation it becomes clear that the service internationalisation is mainly based on the interactions between the USA and the most relevant European economies (in terms of GDP).
13 An advantage of the recent software is the interaction that the researcher can have with the representation of the results. The combination of SNA software and geographic software, such as Google Maps and Google Earth, allow for zooming and partial representation of maps’ detail. Further applications made possible by these new techniques are to be explored. Nevertheless, since this paper represents a first approximation of the exploration of service internationalisation networks through SNA techniques, we limit our exposition to two maps realised through a combination of the following software: Pajek, Paj2KML and Google Maps.
Figure 5. Geographical representation of the services’ international trade network
Note: Constructed using the Paj2KML software (Leydesdorff and Olle, 2010) and Google Maps.
20
Figure 6. Geographical representation of the services’ FDI network
Note: Constructed using Paj2KML software (Leydesdorff and Olle, 2010) and Google Maps.
The conclusions that can intuitively be drawn from these graphical and geographical illustrations are confirmed by the values of the SNA indicators. The first step in this direction is the analysis of the role of the different countries within the networks. In order to restrict our analysis to the networks of the most relevant flows only, the centrality indices are calculated14. Tables 1 and 2 present the results of the actor degree centrality analysis. Several conclusions can be drawn from these results.
Concerning the trade relations, seven countries are listed within the ten most central countries (Germany, the United Kingdom, the United States, France, the Netherlands, Italy and Russia) each of the three times the indices are computed; three more countries (Sweden, Belgium and Spain) are present twice out of three times. Further distinctions can be made. The most central countries of the international service trade network are Germany, the United Kingdom and the United States. These are the three most central actors of the network, independently of the centrality measure. France, the Netherlands and Italy seem to belong to a second subgroup, since their degree and closeness centrality are also above the mean value.15 Russia, Sweden and Japan complete the group of countries that always perform above the median values.
Table 1. Node centrality indices of the international trade network
degree closeness betweenness
de 0.60 uk 1,00 de 0.11
uk 0.60 de 0.93 us 0.10
us 0.56 us 0.89 uk 0.05
fr 0.36 nl 0.68 fr 0.05
nl 0.34 fr 0.66 be 0.04
it 0.28 it 0.66 nl 0.04
ru 0.20 ru 0.61 se 0.02
se 0.20 es 0.58 fi 0.02
be 0.18 hu 0.58 ru 0.02
es 0.16 jp 0.58 it 0.01
fi 0.16 lu 0.58 jp 0.01
jp 0.16 se 0.58 at 0.00
lu 0.16 at 0.57 ie 0.00
at 0.14 be 0.57 es 0.00
cz 0.14 cz 0.57 cz 0.00
dk 0.14 fi 0.57 hk 0.00
hu 0.14 dk 0.56 sk 0.00
ie 0.14 hk 0.56 lu 0.00
no 0.14 ie 0.56 au 0.00
hk 0.12 no 0.56 ca 0.00
sk 0.12 pt 0.56 dk 0.00
au 0.10 sk 0.56 gr 0.00
pt 0.10 au 0.54 hu 0.00
ca 0.08 gr 0.54 no 0.00
gr 0.08 pl 0.54 pl 0.00
pl 0.08 ca 0.53 pt 0.00
mean 0.21 0.62 0.02
median 0,15 0.57 0.00
14On the 5% threshold networks only.
15 The betweenness centrality value of Italy is slightly below the mean value (0.007 and 0.018, respectively).
22
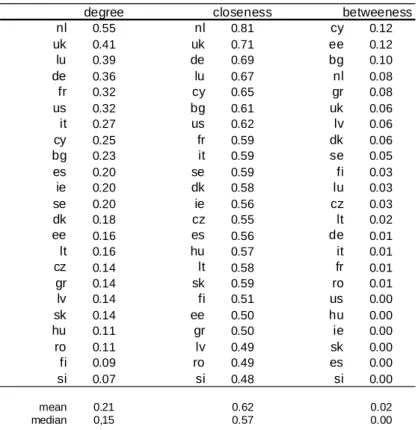
The analysis of the node centralisation of the FDIN presented in Table 2 leads to similar results. Observing the outputs it appears clear that the degree and closeness centrality indices show analogous outcomes while the betweenness centrality index has to be considered separately. As it was explained in the previous section, the centrality intended as the relevance of a certain actor within the network is represented by the degree and closeness centrality indices. In other words the first two columns of Table 2 show the countries with the highest and the closest investment relations. The Netherlands, the United Kingdom, Germany and Luxembourg are the countries with the highest number of FDI relations and with the easiest access to the rest of the economies. France, the United States, Italy, Cyprus and Bulgaria are the other countries presenting indices above the mean values. The presence of the latter two countries is surprising. As it can be observed in Figure 6, these economies do not maintain relevant relations in terms of volume; nevertheless they do maintain investment relations with several countries. This sort of relevance within the network is confirmed by the betweenness centrality indicator. In Section 3 we described the betweenness indicator as the one measuring the presence of bridges in the net. In our case a high betweenness score indicates that a country acts as a sort of connection between economies that do not maintain relevant relations.
Cyprus, Bulgaria and Estonia invest and receive (low-value) investment from countries that do not maintain relevant relations. They can be considered as a sort of bridge or connectors between eastern countries, Baltic countries and the most relevant western economies listed above.
Basic exploratory SNA such as the one performed so far opens the door to several research directions. Economic explanation of the reasons behind the observed performances is one of them. The first paragraphs of this section already underlined how economic size and centrality seems to be directly related. Centrality indexes confirm this point of view adding some exception such as the high centrality of a small economy such as the Dutch. Since a large proportion of services trade flows consist of transport, the high scores of the Netherlands in trace centrality indexes are justified.
The comparison of the different roles maintained by the countries within the two networks is another of such opened doors. For example, it can be observed how the Netherlands and Luxembourg are far more central in the FDI network than in the trade network. The Netherlands performs as the fourth, fifth and sixth most central country in the trade network, while it is twice the first and once the fourth country in the FDI network. Luxembourg appears as the thirteenth, eleventh and eighteenth country in the trade centrality index classification and as the third, fourth and eleventh country in the FDI analysis. A new line of research spinning off from SNA could consist of determining whether this situation is due to the role of these two countries as (or connection with) tax havens.16
16 Weyzig and Van Dijk (2008) show that even though the Netherlands is not itself a “pure” tax haven, it works as a
“conduit” country for international corporations channelling funds to tax havens.
23
Table 2. Node centrality indices of the foreign direct investment network
degree closeness betweeness
nl 0.55 nl 0.81 cy 0.12
uk 0.41 uk 0.71 ee 0.12
lu 0.39 de 0.69 bg 0.10
de 0.36 lu 0.67 nl 0.08
fr 0.32 cy 0.65 gr 0.08
us 0.32 bg 0.61 uk 0.06
it 0.27 us 0.62 lv 0.06
cy 0.25 fr 0.59 dk 0.06
bg 0.23 it 0.59 se 0.05
es 0.20 se 0.59 fi 0.03
ie 0.20 dk 0.58 lu 0.03
se 0.20 ie 0.56 cz 0.03
dk 0.18 cz 0.55 lt 0.02
ee 0.16 es 0.56 de 0.01
lt 0.16 hu 0.57 it 0.01
cz 0.14 lt 0.58 fr 0.01
gr 0.14 sk 0.59 ro 0.01
lv 0.14 fi 0.51 us 0.00
sk 0.14 ee 0.50 hu 0.00
hu 0.11 gr 0.50 ie 0.00
ro 0.11 lv 0.49 sk 0.00
fi 0.09 ro 0.49 es 0.00
si 0.07 si 0.48 si 0.00
mean 0.21 0.62 0.02
median 0,15 0.57 0.00
The results presented so far clearly show that some countries play a very central role in the internationalisation of the tertiary sector, while others seem to participate to a lesser extent.
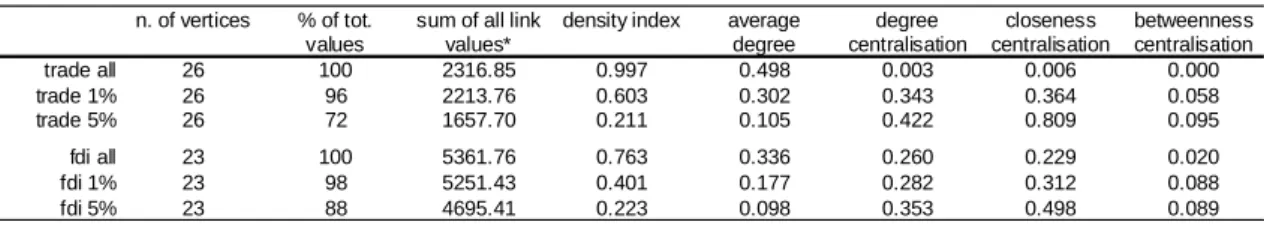
Thus, the internationalisation process is governed by a group of central countries. This hypothesis can be confirmed by the analysis carried out on all the six networks. Table 3 summarises the result of this analysis.
Table 3. Network statistics of service internationalisation
n. of vertices % of tot.
values
sum of all link values*
density index average degree
degree centralisation
closeness centralisation
betweenness centralisation
trade all 26 100 2316.85 0.997 0.498 0.003 0.006 0.000
trade 1% 26 96 2213.76 0.603 0.302 0.343 0.364 0.058
trade 5% 26 72 1657.70 0.211 0.105 0.422 0.809 0.095
fdi all 23 100 5361.76 0.763 0.336 0.260 0.229 0.020
fdi 1% 23 98 5251.43 0.401 0.177 0.282 0.312 0.088
fdi 5% 23 88 4695.41 0.223 0.098 0.353 0.498 0.089
*=billions of euros
It is interesting to compare the results of the networks of different thresholds and the IT and FDI networks. As it was observed above, when applying the 5% threshold to the trade and FDI networks, which means eliminating 513 (78% of the total) and 272 (70%) links, respectively, the value of the exchanges composing the network still represents 72% and 88% of the original figures. As a result it can be stated that the process of internationalisation is centred on around
24
20–30% of the trade and FDI relations, which account for 70–90% of the transaction values.
The centralisation measures show very low values when considering the complete network of international trade and FDI. Nonetheless, when the analysis is restricted to the high-level trade and investments relations (the 5% threshold), both networks become more centralised. Once again, at first sight the internationalisation seems a very complex and not centralised process, but it is actually dominated by a few actors and their respective relations. However the networks are rather non-hierarchical. This means that, even though some countries play a more central role, they are not essential to the existence of the network as such. This result is confirmed by the presence of relatively high values of degree and closeness centralisation but low values of betweenness centralisation. These results confirm the hypothesis that a large part of the international trade and FDI flows takes place between the central actors themselves. The last conclusion to be drawn from Table 3 concerns the similarities between the IT and the FDI network. According to the values for network density, the average degree centralisation and the average betweenness centralisation, the trade and FDI networks built on the 5% threshold are similar. The trade and FDI networks seem to have a similar structure.
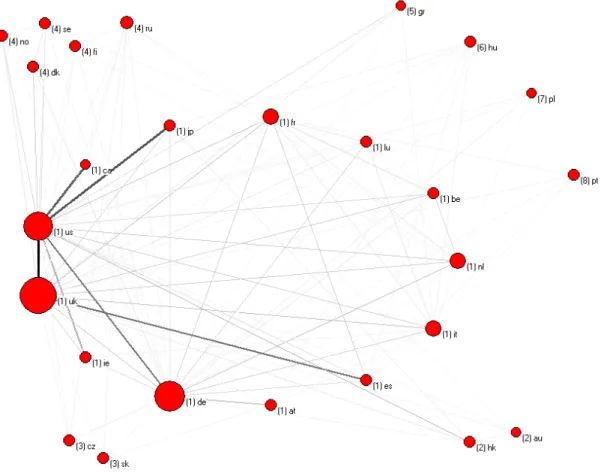
All the results presented so far suggest the presence of a group of central countries within the networks; to test this hypothesis further we apply a technique designed to identify the presence of cohesive subgroups. To this aim we recognize strong components among the IT and FDI 5% networks (see Figure 7 and Figure 8). Each vertex has been labelled with the corresponding country acronym and the component to which it belongs. In order to present a clearer visualisation, countries belonging to the same component were grouped together. In addition, the size of the vertices was set according to their closeness centrality values.
Figure 7. Components of the international trade network
Note: vertices’ sizes proportional to closeness centrality; arcs’ sizes proportional to the volume of bilateral trade
26
Figure 8. Components of the foreign direct investment network
Note: vertices’ sizes proportional to closeness centrality; arcs’ sizes proportional to the volume of bilateral investments
It turns out that a group of 13 countries forms the main component of the trade network.17 Due to the centrality indices presented above and the value of the relations maintained within the group it can be identified as the core group of the international trade in services. Other strong components, a group of countries in which each pair is directly or indirectly connected, are identified. Hong Kong and Australia as well as the Czech Republic and Slovakia form two subgroups due to their geographical position and for historical reasons. It is also interesting to note that the Scandinavian countries (Sweden, Norway, Finland and Denmark) and Russia form a cohesive subgroup. Four countries, however, do not belong to any component: Greece, Hungary, Poland and Portugal. These economies seem to be the least integrated into the service trade internationalisation.
The component analysis performed on the FDIN shows similar results. Two main components are identified. The first is formed by the more centralised countries, of which there are nine in this case. It is within this group that the majority of the FDI in the tertiary sector takes place. The second component comprehends the Scandinavian countries, the Baltic countries, Greece, Cyprus, Romania and Bulgaria. The Czech Republic and Slovakia form an isolated subgroup again. Slovenia and Hungary do not belong to any component within the FDIN. From both analyses it appears clear that the internationalisation networks present a core–periphery structure.
The last part of this analysis focuses on the identification of subgroups through the detection of cores within the networks. A core is defined as a group of countries with a minimum degree between them. As it was explained in the previous section, the cores of a network are nested: the countries belonging to a 3-core will all take part in a 2-core that probably includes countries that did not appear in the 3-core. This means that, on the one hand, we are able to investigate whether a central core exists and, on the other hand, we can spot rather isolated countries that only belong to low-level cores. In other words, besides identifying the central actors, we are also able to identify those actors that only play a minor role in the internationalisation of services. Following this procedure the service trade core group is composed of eight countries. They are mainly the ones identified earlier: the United States, the United Kingdom, the Netherlands, Luxemburg, Italy, France, Germany and Belgium compose a cluster in which every country exports to or imports from at least six of the others.18 The less integrated actors are Australia, Canada, Hong Kong, Greece and Poland. The geographical position of the first three could be an explanation for their low level of integration. Concerning Greece and Poland the reasons can probably be seen in their relatively low level of tertiarisation. The core of the FDIN is larger and comprehends the United States, the United Kingdom, Sweden, the Netherlands, Luxemburg, Italy, Ireland, France, Spain, Denmark and
17 This is the case of the United States, the United Kingdom, Ireland, Germany, Austria, Spain, Italy, the Netherlands, Belgium, Luxembourg, France, Japan and California.
18 The core analysis was performed on undirected networks, which means that the link between two economies is given by the sum of the two export flows and no significance is given to the direction of the flow.
28
Germany (6-core). The countries that are less involved are Finland and Slovenia, which belong to a 3-core only. The full outcome of the k-core analysis is presented in Annex 1.
Finally Table 4 summarises the outcomes of the different SNA techniques and presents the distinction between countries belonging to the core and the periphery of the networks.
Table 4. The core–periphery structure of the internationalisation of the service sector
Core Periphery
Centrality indexes*
Germany, United Kingdom, United States, France, Netherlands, Italy, Russia, Sweden, Belgium and Spain.
Poland, Greece, Canada and Portugal
Components analysis
United Kingdom, United States, Germany, Netherlands, Italy, France, Austria, Canada, Japan, Luxemburg, Belgium, Spain and Ireland
Greece, Hungary, Poland and Portugal
K-cores analysis
Unites States, United Kingdom, Netherlands, Luxemburg, Italy, France, Germany and Belgium
Australia, Canada, Honk Kong, Greece and Poland
Centrality indexes*
Netherlands, United Kingdom, Germany, Luxemburg, France, United States, Italy and Cyprus
Slovenia and Romania
Components analysis
United Kingdom, United States, Germany, Netherlands, Luxemburg, France, Ireland, Spain and Italy
Slovenia and Hungary
K-cores analysis
United States, United Kingdom, Sweden, Netherlands, Luxemburg, Italy, Ireland, France, Spain, Denmark and Germany
Slovenia and Finland International
trade network
Foreign direct investment network
*=no mathematical threshold was applied; countries were chosen on the basis of the average scores of the three centrality indices applied.
We can draw some further conclusions on the core–periphery structure from Table 4. As far as the international trade of services is concerned we can identify a core group of countries composed of the USA, the United Kingdom, Germany, France, the Netherlands, Italy and Belgium. Another group of relevant economies, playing a minor role but still at the centre of the network, consists of Luxembourg, Spain, Japan and Ireland. A Nordic cluster can be identified consisting of Sweden, Russia, Norway, Denmark and Finland. Probably because of their geographical position Hong Kong and Australia are peripheric to the process. Eastern European countries together with Greece and Portugal are economies less integrated into the trade network as well. Similar results arise from observing the FDIN outcomes. Here the central group is composed of the United Kingdom, the USA, the Netherlands, Germany, Luxemburg, France and Italy. Spain, Ireland, Cyprus and Denmark compose the second-order group. The Nordic cluster can also be observed in the FDIN while Slovenia seems to be the least integrated economy.
5. Conclusions
Service internationalisation is a complex process requiring complex analysis tools. SNA is a method of analysis that can rise to this challenge. The particular features of this method allow the study of the relations between different actors and at the same time allow a perspective of the whole set of relations to be maintained: the network. The basis of this kind of analysis is the