AN ANALYSIS OF THE COST OF DISABILITY ACROSS EUROPE USING THE STANDARD OF LIVING APPROACH
JOSÉ-IGNACIO ANTÓN FRANCISCO-JAVIER BRAÑA RAFAEL MUÑOZ DE BUSTILLO
FUNDACIÓN DE LAS CAJAS DE AHORROS DOCUMENTO DE TRABAJO
Nº 645/2011
De conformidad con la base quinta de la convocatoria del Programa de Estímulo a la Investigación, este trabajo ha sido sometido a eva- luación externa anónima de especialistas cualificados a fin de con- trastar su nivel técnico.
ISSN: 1988-8767
La serie DOCUMENTOS DE TRABAJO incluye avances y resultados de investigaciones dentro de los pro- gramas de la Fundación de las Cajas de Ahorros.
Las opiniones son responsabilidad de los autores.
A N ANALYSIS OF THE COST OF DISABILITY ACROSS E UROPE USING THE STANDARD OF LIVING APPROACH
J
OSÉ-I
GNACIOA
NTÓN1F
RANCISCO-J
AVIERB
RAÑA 2R
AFAELM
UÑOZ DEB
USTILLO 3ABSTRACT
This article presents for the first time a comparative study of the cost of disability for 26 European countries. Using the European Union Statistics on Income and Living Conditions 2008 and two alternative methodologies, one based on how easy or difficult it is for households to make ends meet and the other related to access of households to a set of services and assets, we present estimates of the extra costs of disability for households. Also discussed are the possible explanatory reasons for the pattern of costs found in the analysis.
KEYWORDS: disability, cost, standard of living, income, welfare.
JEL CLASSIFICATION: I10, I30.
1 ,2 , 3
([email protected]). ([email protected]([email protected]), ([email protected]), Departamento de Economía Aplicada Universidad de Salamanca.
1. I
NTRODUCTIONDisability can be understood as a functional limitation, resulting not only from a medical condition of the body or the whole person, but also from the relation of a person with the environment, which involves dysfunction at one or more of three levels:
impairments, activity limitations and participation restrictions.
1The resulting loss of autonomy, physical or mental, prevents performance of some of the Activities of Daily Living (ADL).
Disability is far from being a marginal phenomenon in developed countries.
2According to Eurostat, 30.8% of European Union (EU) citizens suffered from a long- standing illness or health problem in 2008, whereas 8.1% reported experiencing severe and Development (OECD) and in the EU there is strong concern about the issue and a mandate to try and attain the full economic and social participation of people with disabilities.
3As a reflection of this concern, in the OECD and in the EU there is a variety of disability benefit systems, regulations and coverage. Some of these policies address the re-integration of disabled people into the labor market while others aim to compensate individuals with disabilities.
4Public social spending in this area reached a sizable 2% of GDP in the EU27 in 2008, fluctuating from 0.7% in Cyprus to 4.4% in Denmark.
The aim of this paper is to offer an estimate of the extra costs of severe disability using a large sample of European countries. As far as we know, this is the first attempt to offer such an estimation using homogeneous data and the same methodology for all the EU member countries (with the exceptions of Finland, France and Malta) plus
1 We understand disability within the so-called “bio-psycho-social model”, according to which disability is the result of the interaction of the functional status of a person with his/her environment, taking into account the social aspects of disability and not seeing disability only as a 'medical' or 'biological' dysfunction. This is the approach adopted by the International Classification of Functioning, Disability and Health, endorsed by the 54th World Health Assembly on May 22, 2001(resolution WHA 54.21). For a discussion of the definition and the measuring of disability see OECD (2010).
2 For a more global picture, with different insights on the situation of disabled people in developing countries, see WHO (2011).
3 The OECD has a research field on disability, starting with a first report in 2003, opening a specific project of which the last outcome is a new report published in 2010, reviewing the policies of thirteen countries. The European Commission has published a European Disability Strategy 2010-2020 (European Commission, 2010). Nevertheless, in both cases the aim is restricted to the labor market outcomes of people with disability, particularly eliminating barriers to their labor market integration and fostering higher participation rates among workers with disability.
4 For a review, see OECD (2003).
Norway and Iceland. In addition, we try to outline several plausible explanations for the differences in estimated costs across countries.
Our approach to the cost of disability draws from the work of Amartya Sen (2004), who makes a distinction between two types of handicaps that tend to be associated with disability (Sen, 2004): on the one hand, a disabled person may find it harder to get a job or to keep it, and may receive a lower wage, and disability can even affect the acquisition or accumulation of human capital;
5on the other hand, because persons with disabilities have special needs, they face more difficulties than able people in achieving well-being from their resources or may need more income for the same activity. Sen calls the first one an “earning handicap” and the second one, a “conversion handicap”. The latter handicap is recognized in social protection systems in many countries, which provide benefits, be they direct expenditure or tax expenditures, to offset the higher consumer costs associated with disability.
The starting point of our work is Sen’s (1985, 1987) concept of distributive justice, based on equalizing people's basic capabilities. For this author, the ultimate reference in redistributive policy is the standard of living, not the utility or the mere possession of goods. The issue is to establish an objective minimum standard that represents a good approximation to the real income level, considering that the standard of living is primarily an issue concerning lifestyle, rather than the means for its development. For Sen, the standard of living is a matter of functionings and capabilities.
As is well known, Sen’s point of departure is the modern theory of the consumer (Lancaster, 1966), according to which goods are not relevant in themselves, but only in that they incorporate features and properties that make them desirable. What matters is the use that each person can get from these characteristics, which depends on his or her capability to perform the functions to take advantage of the characteristics of each good.
Therefore, given a set of goods, each individual, according to his/her capabilities, can
convert its characteristics into different combinations of functionings, from which
he/she obtains a certain level of welfare. The standard of living approach aims to
determine the extra cost of disability by comparing households with disabled and non-
disabled members with the same level of welfare and allowing the difference in income
Researchers have not devoted much attention to the study of the costs of disabilities and almost all the literature focuses on Anglo-Saxon countries. This body of research is also based on very different methodologies (discussed in the third section) and it relies exclusively on national studies, so the comparability of the different results found in the literature is far from ideal. Apart from the surveys of Indecon (2004), Tibble (2005) and Stapleton, Protik and Stone (2008), one should highlight the works of Martin and White (1988), Matthews and Truscott (1990), Jones and O’Donnell (1995), Zaidi and Burchardt (2005), Kuklys (2005) and Wood and Grant (2010) for the United Kingdom, Indecon (2004) and Cullinan, Gannon and Lyons (2011) for Ireland, Saunders (2007) for Australia, She and Livermore (2007), Mitra, Findley and
Sambamoorthi (2009) and Anderson et al. (2010) for the United States, Wilkinson-Meyers et al. (2010) for New Zealand and Braña and Antón (2011) for Spain. In addition, Braithwaite and Mont (2009) estimate the cost of disability for two non- developed countries, like Bosnia and Herzegovina and Vietnam. Although most of the studies are based on the standard of living approach, the overall results of this literature are extremely difficult to summarize: the authors rely on different definitions of disability and uses different variables and econometric specifications to estimate the extra cost of disability, making their outcomes hardly comparable. The absence of comparative studies might also cast some additional doubts on the methodology followed, as cross-country studies using a common methodology can contribute to test the appropriateness of the standard of living approach by arriving at results that make sense and could be explained according to economic theory. In this respect, the present work also aims to contribute to fill this gap.
The current study estimates the extra cost of disability –understood as suffering
a chronic health condition and a severe limitation of daily activities- for 26 European
countries using two different strategies, one based on a subjective question on a
household’s ability to make ends meet and another related to the ownership of several
assets. The main finding of the article is that such a cost varies widely across countries,
from around 20% to more than 100% of household income depending on the country. In
general, Nordic countries and the Netherlands place at the top of the ranking, with
Mediterranean and Eastern European states at the bottom. We suggest that this pattern is
related to the model of caring for people with disabilities: in the former case, Welfare
States allow many disabled individuals to live by themselves, while in the latter care for people with disabilities is mainly a family responsibility.
The article unfolds in five additional sections as follows. In section 2, we describe the database used to estimate the cost of disability, pointing out its strengths and shortcomings. The third section presents and discusses the methodology followed in the estimation of the cost of disability. In section 4, the results obtained in terms of the cost of disability in the 26 European countries of the sample are presented, while section 5 discusses them. Finally, section 6 summarizes the main conclusions obtained in the paper and outlines further lines of research.
2. D
ATAThe database used in this research is the European Union Statistics on Income and
Living Conditions 2008 (EU-SILC 2008).
6Our original aim was to study the cost of
disability in the 27 member states of the EU plus Norway and Iceland, countries of the
European Economic Area that are also included in the database. However, it was
impossible to include Finland, France and Malta in the analysis. Finland was excluded
because only the household head is interviewed about his/her disability condition,
whereas the other two countries refused our request and did not authorize micro-data
dissemination. Therefore, the study focuses on the cost of disability in 26 European
countries. The main advantage of this database is that it provides detailed information
on household income and living conditions that is comparable across countries.
7Sample sizes are considerably large: they range from more than 3,300 households in
Cyprus to roughly 20,000 in Italy. Nevertheless, the EU-SILC also has several
shortcomings. First, some information is not available for all countries, so the
comparative analysis has to necessarily be restricted to those variables that are present
in all member states.
8Second, and importantly, information in the database on disability
is not as exhaustive and detailed as desirable. In particular, there are only two questions
that address this issue. The first asks the interviewee if he or she has a chronic illness or
health problem, while the second inquires as to whether the household member has been limited in his or her daily activity during the previous 6 months. Although other studies in the literature, such as Zaidi and Burchardt (2000) –in some of their specifications- and Cullinan, Gannon and Lyons (2011), use similar questions to characterize the disability condition, the limitations of the survey in this sense preclude us from having detailed information on the type of disability suffered by household members. Such information would have greatly contributed to better characterize the disability. In the third place, information on disability is not available for people 16 years old or under, an important limitation of this study that one should bear in mind.
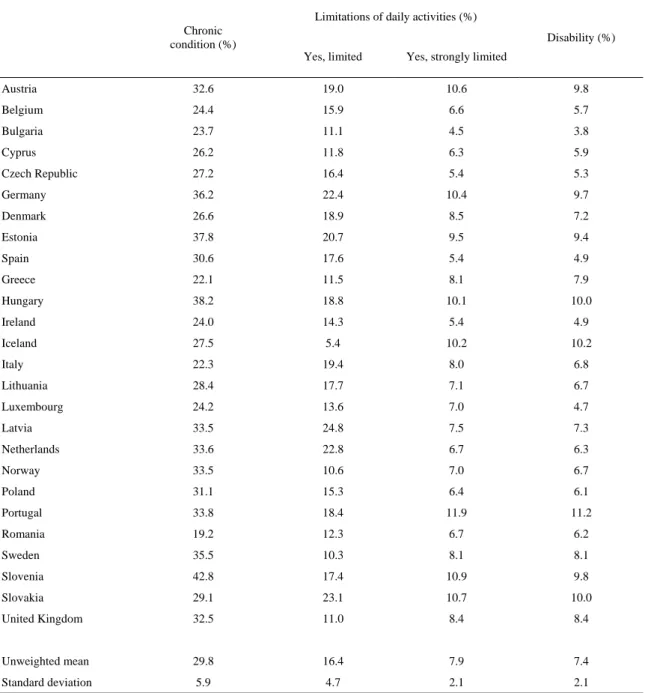
In order to operationalize the concept of disability, we apply a quite demanding definition: a person is considered as disabled if he or she simultaneously reports suffering from a chronic illness or condition and having been intensely limited during the last 6 months. The exigency of the chosen concept of disability can be seen clearly in the data shown in Table 1. Focusing on the average of the 26 countries of the sample, of the 30% of population with a chronic condition and the 16.4% of population with a condition that limits their activity, only 7.4% is considered to have a strong disability. A by-product of the definition of disability used in this study is the remarkably low dispersion of the percentage of population considered to be suffering from a strong disability among the countries of the sample, roughly half of the dispersion of those with a chronic condition or with limitations of activity.
In order to check the
verisimilitude of theresults obtained in terms of prevalence
of disability according to the proposed concept, we compared these results with those
obtained using two alternative sources and definitions: the 2002 Labour Force Survey
(LFS) ad-hoc module on employment of disabled persons, and the 2004 European
Health Interview Survey (EHIS). For the 12 countries for which the three data sources
offer information, the EU-SILC shows the lowest variability among countries (the
coefficient of variation is 0.237 in the EU-SILC compared to 0.471 in the LFS and 1.46
in the EHIS), which may suggest that the database we use better captures the disability
condition.
Table 1. Population over 16 years old with a chronic condition, limitations of daily activities and disability condition in Europe (2008)
Chronic condition (%)
Limitations of daily activities (%)
Disability (%) Yes, limited Yes, strongly limited
Austria 32.6 19.0 10.6 9.8
Belgium 24.4 15.9 6.6 5.7
Bulgaria 23.7 11.1 4.5 3.8
Cyprus 26.2 11.8 6.3 5.9
Czech Republic 27.2 16.4 5.4 5.3
Germany 36.2 22.4 10.4 9.7
Denmark 26.6 18.9 8.5 7.2
Estonia 37.8 20.7 9.5 9.4
Spain 30.6 17.6 5.4 4.9
Greece 22.1 11.5 8.1 7.9
Hungary 38.2 18.8 10.1 10.0
Ireland 24.0 14.3 5.4 4.9
Iceland 27.5 5.4 10.2 10.2
Italy 22.3 19.4 8.0 6.8
Lithuania 28.4 17.7 7.1 6.7 Luxembourg 24.2 13.6 7.0 4.7
Latvia 33.5 24.8 7.5 7.3
Netherlands 33.6 22.8 6.7 6.3
Norway 33.5 10.6 7.0 6.7
Poland 31.1 15.3 6.4 6.1
Portugal 33.8 18.4 11.9 11.2
Romania 19.2 12.3 6.7 6.2
Sweden 35.5 10.3 8.1 8.1
Slovenia 42.8 17.4 10.9 9.8 Slovakia 29.1 23.1 10.7 10.0 United Kingdom 32.5 11.0 8.4 8.4
Unweighted mean 29.8 16.4 7.9 7.4 Standard deviation 5.9 4.7 2.1 2.1 Source: Authors’ analysis from EU-SILC 2008.
3. M
ETHODOLOGYThe extra cost that disability imposes on households has been studied from different
perspectives, which are associated with different research strategies.
9The subjective-
direct approach, the most straightforward procedure, consists in asking disabled people (or experts) what the costs of having a disability are. The main limitation of this method is that the respondents can hardly make an accurate estimation of how much they would spend on common goods everyone purchases if they were not disabled (Zaidi and Burchardt, 2000). Some studies using this approach are Martin and White (1988) and Wood and Grant (2010) for the UK and the report of Indecon (2004) for Ireland, which offers a set of estimates for specific types of disability according to several assumptions and another one based on a detailed survey on disabled people (whose response rate was less than 20% and whose size was less than 300).
The second possible strategy relies on the study of the consumption patterns of both the disabled and the non-disabled population, identifying those items disabled people spend more on controlling by income. This approach has usually been applied to evaluate the extra costs associated with certain items, as Matthews and Truscott (1990) and Jones and O’Donnell (1995) do for the British case and Mitra, Findley and
Sambamoorthi (2009) and Anderson et al. (2010) for medical expenses in the United States. Although this method overcomes several limitations of the subjective-directapproach, it presents a serious shortcoming: the estimated cost of disability is constrained by the income of disabled people; in other words, they only report how much they actually spend, so it is not possible to measure the potential cost of disability.
The third and last approach is the so-called standard of living approach. This method is based on comparing the income levels of households with and without disabled members with the same level of welfare. The extra income required by households with disabled members for achieving such level of welfare represents the extra cost of disability. This method has usually received good reviews because of the robustness of the results obtained (Indecon, 2004, Tibble, 2005).
Furthermore, it is worth mentioning that, some authors (Wilkinson-Meyers et al., 2010) have recently proposed to benefit from the strengths of each method, in a process that would involve looking at the specific needs of disabled population with the advice of a panel of experts, confronting such estimation of the costs with a focus group of disabled individuals and, finally, validating the model using wide surveys.
In this article, we follow the third methodology, the standard of living approach,
(from now on subjective-indirect), which has been the most popular one in an otherwise
spare literature (Zaidi and Burchardt, 2000, Indecon, 2004, She and Livermore, 2007, Saunders, 2007, Braithwaite and Mont, 2009, Cullinan, Gannon and Lyons, 2011). This method consists in estimating the effect of income and disability on welfare in order to determine how much income is needed to compensate for the existence of members with disability in the household, given a level of welfare. In practice, the method can be operationalized estimating a model such as:
i i i i i
W Y D X [1]
where W
iis a variable that denotes the welfare level or standard of living of household i, D
iis a dummy variable indicating whether or not there are disabled members in the household, and X
iis a vector that includes an intercept and a set of variables capturing socio-demographic characteristics of households (head sex, head age –using several dummies-, head marital status, head migrant status, head pensioner condition, household size, number of children of 0-4, 5-10 and 10-13 years old and housing tenure status).
10In the equation presented above, the relationship between welfare, income and disability is linear, which implies that the cost of disability in terms of income is given by a fixed monetary amount represented by –β/α. Obviously, such a relationship can be modeled in alternative ways, including income in logs, squared or even interactions between both variables. A specification including income logs, for instance, assumes not only decreasing returns to income in terms of welfare but also that the cost of disability is a constant proportion of income. Although in the process of research we tried several alternative specifications, we finally opted for a specification where income was modeled in logs, which proved to be the one that best fitted data according to several statistical criteria described below.
One of the main issues of concern in the standard of living approach is how to
determine households’ welfare disregarding income data. Following the spirit of Zaidi
and Burchardt (2005), we proceed in two ways. Firstly, we consider as welfare indicator
the response given by household heads to the question regarding the ability of the
households to make ends meet with their current income. The possibilities for
answering this question were: “with great difficulty”, “with difficulty”, “with some
difficulty”, “fairly easily”, “easily” and “very easily”. In order to fit the model, we use
an ordered logit, which assumes the existence of an underlying and unobservable variable (welfare), which is codified into intervals that determine categories that are fully observed by the researcher. As is well-known, this type of model is estimated using maximum likelihood methods. In order to choose between different specifications of the model, we use the Akaike and Bayesian Information Criteria, which suggest that including income in logs is the most appropriate strategy. The phrasing of the question used to construct the welfare indicator is similar to the questions used in comparable studies for other countries.
11Secondly, we construct an indicator aiming to capture welfare using information on assets of households. One possibility is to simply count the number of assets and fit a negative binomial regression model. However, this method reveals problems of convergence for some countries, hindering the comparability of the analysis. Another option is grouping the assets and considering that a certain number of them determine a given level of welfare. For example, 4 items can be interpreted in terms of a low level of welfare, and 15 items a large level. This strategy, used by Zaidi and Burchardt (2005), Braithwaite and Mont (2009) and Cullinan, Gannon and Lyons (2011), give rise to problems of convergence similar to those found in the negative binomial regression. We therefore used a third and quite pragmatic approach: we carried out a principal component analysis (PCA) of 15 different items/assets or dimensions of the households in the sample. The first principal component obtained by this procedure, which accounts for as much of the variability of the data as possible and can be considered as a good way of estimating household welfare (Filmer and Pritchett, 2001), is taken as the dependent variable of the equation [1], which is thus estimated by OLS with robust standard errors. For comparability purposes with the first approach, we also estimate the model including income in logs. The following items, those on which there is available information in the SILC, were selected for carrying out the analysis:
- Capacity to afford paying for one week annual holiday away from home.
- Capacity to afford a meal with meat, chicken, fish or vegetarian equivalent every second day.
11 The question is quite similar to the question included in the European Community Household Panel used by Cullinan, Gannon, and Lyons (2011). Zaidi and Burchardt (2005) use as well a very similar question taken from the British Household Panel Survey, along with another one asking whether the interviewed household can save. Sea and Livermore (2007) and Saunders (2007) test several questions in the same spirit (food insecurity or ability to pay bills, meet expenses, pay rent or mortgage and get medical care, among others).
- Capacity to meet unexpected financial expenses.
- To have a telephone.
- To have a colour television set.
- To have a computer.
- To have a washing machine.
- To have a car.
- Not to have any natural light problems at home.
- Not to have any noise problems at home.
- Not to have any pollution or environmental problems.
- No crime or violence in the area.
- Not to have a leaking roof, damp walls, floors or foundation or rot in window frames and floor.
- To be able to keep home adequately warm.
- Not to be in a crowded household (defined as that with two or more people per room).
The use of two different methodologies –a choice also made by Zaidi and Burchardt (2005)- aims to assess how robust the findings are to the approach chosen to measure household welfare. In the first case, the question is of a more “subjective nature” (since the household self-reports its ability to meet ends), while the second one can be considered as a more “objective” approach, since it only relies on a household’s assets and services. Nevertheless, even in the latter option, the welfare variable can be contaminated by differences in preferences.
4. R
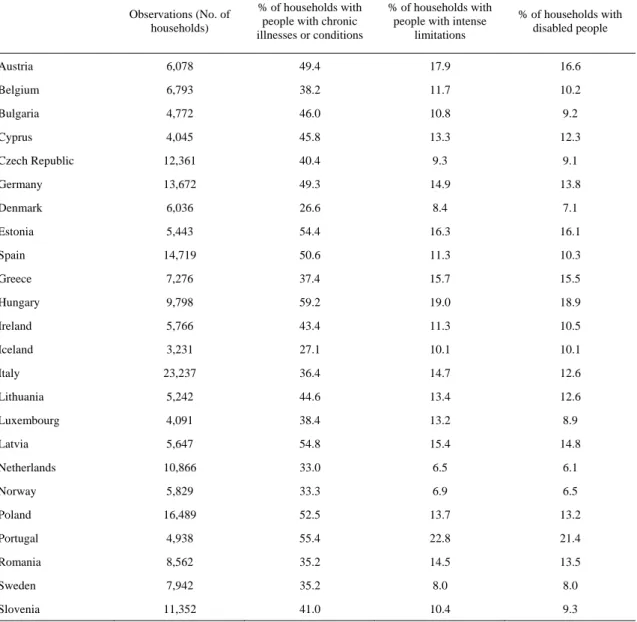
ESULTSBefore presenting the results of the empirical analysis, it is advisable to look at the main descriptive statistics of the sample, namely, the proportion of households with people with any chronic condition, the proportion of households with people with intense limitations of their daily activity and, finally, the percentage of households with disabled members (according to the definition presented above) (Table 2).
The estimated cost of disability (with their corresponding 95% confidence
In the first place, it should be mentioned that, overall, the magnitude of the costs is quite similar in both models, between 21% and 99% of household income in the first approach and between 20% and 132% according to the second one. Nevertheless, there are very important differences for particular countries, such as the Netherlands, Denmark, Romania or Spain, among others. In the second place, although it is not easy to extrapolate a clear pattern from the results, several facts can be highlighted. For example, in both estimations Scandinavian countries, headed by Norway, lead the ranking of the costs of disability, while at the bottom, in general, are Eastern European countries and Luxembourg. The next section tries to outline several explanations for these patterns.
Table 2. Main descriptive statistics of the database
Observations (No. of households)
% of households with people with chronic illnesses or conditions
% of households with people with intense
limitations
% of households with disabled people
Austria 6,078 49.4 17.9 16.6 Belgium 6,793 38.2 11.7 10.2 Bulgaria 4,772 46.0 10.8 9.2 Cyprus 4,045 45.8 13.3 12.3 Czech Republic 12,361 40.4 9.3 9.1
Germany 13,672 49.3 14.9 13.8 Denmark 6,036 26.6 8.4 7.1 Estonia 5,443 54.4 16.3 16.1 Spain 14,719 50.6 11.3 10.3 Greece 7,276 37.4 15.7 15.5 Hungary 9,798 59.2 19.0 18.9 Ireland 5,766 43.4 11.3 10.5 Iceland 3,231 27.1 10.1 10.1 Italy 23,237 36.4 14.7 12.6 Lithuania 5,242 44.6 13.4 12.6 Luxembourg 4,091 38.4 13.2 8.9 Latvia 5,647 54.8 15.4 14.8 Netherlands 10,866 33.0 6.5 6.1 Norway 5,829 33.3 6.9 6.5 Poland 16,489 52.5 13.7 13.2 Portugal 4,938 55.4 22.8 21.4 Romania 8,562 35.2 14.5 13.5 Sweden 7,942 35.2 8.0 8.0 Slovenia 11,352 41.0 10.4 9.3
Source: Authors’ analysis from EU-SILC 2008.
Figure1. The estimated cost of disability across the European Union (welfare based on reported ability to make ends meet)
Note: Interval confidences calculated at the 95% confidence level.
Source: Authors’ analysis from EU-SILC 2008.
21 25
29 30 31 31 33 34 36 36 38 41 43 48
53 53 54 55 55
62 65 66 72 74
79 99
0 20 40 60 80 100 120 140
LU PL EE CZ BE CY SI HU IT SK DE ES GR UK BG DK IE NL AT PT RO LT LV IS SE NO
% of income
Figure 2. The estimated cost of disability across the European Union (welfare based on PCA of households’ assets)
Note: Interval confidences calculated at the 95% confidence level.
Source: Authors’ analysis from EU-SILC 2008.
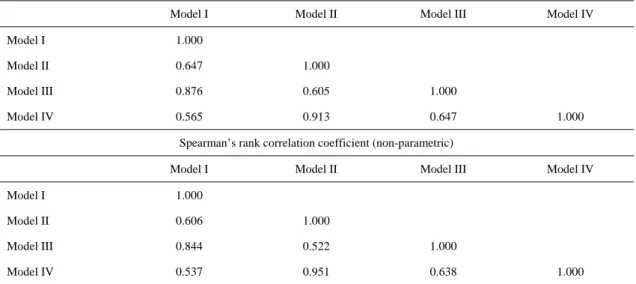
In order to check the robustness of our findings, we repeat the analysis changing the definition of disability, making it less demanding, and performing again the calculations using both sorts of strategies (the question about how people make ends meet and the welfare indicator based on households’ items). The alternative definition of disability includes those individuals who report suffering a chronic illness and being limited to a certain degree or intensively. This broader concept obviously increases the percentage of households with disabled members. The results obtained using this alternative definition are available upon request and are very similar to the ones reported above. In this respect, the correlation (displayed in Table 3) between the results obtained using the method based on the question regarding the ability to make ends
20 23 24 26 29 31
37 38 39 40 40 41
46 49 50 52 52 56 61 62
72 77
87 89 132 132
-20 0 20 40 60 80 100 120 140 160
PL BG LU HU LT SK CY RO BE CZ SI GR DE EE IT AT LV PT IE ES DK UK SE IS NL NO
% of income
meet and the one that relies on households’ assets is around 0.5 in the case of intense limitations of daily activity (model I versus model II) and more than 0.6 when people with intense or mild limitations or daily activity are considered as disabled (model III versus model IV). In the second place, there is barely any difference when we compare the results by definition of disability, that is, the correlation between the models based on the question on the ability to make ends meet (model I versus model III) and those based on households’ assets (model II versus model IV) is remarkably high, around 0.9.
Nevertheless, it is worth mentioning that the differences according to the way welfare is measured are larger than those reported by Zaidi and Burchardt (2005) for the UK, who obtain similar findings both for the subjective question on ability to make ends meet and the approach based on households’ items.
Table 3. Parametric and non-parametric correlation among outcomes of the different models
Pearson’s correlation coefficient (parametric)
Model I Model II Model III Model IV
Model I 1.000
Model II 0.647 1.000
Model III 0.876 0.605 1.000
Model IV 0.565 0.913 0.647 1.000 Spearman’s rank correlation coefficient (non-parametric)
Model I Model II Model III Model IV
Model I 1.000
Model II 0.606 1.000
Model III 0.844 0.522 1.000
Model IV 0.537 0.951 0.638 1.000 Notes:
- Model I is based on intense limitations of daily activity and the question about ability to make ends meet; model II is based on intense limitations of daily activity and households’ assets; model III is based on mild or intense limitations of daily activity and the question about ability to make ends meet; definition 4 is based on mild or intense limitations of daily activity and
households’ assets.
- All the correlation coefficients are significantly different from zero at the 1% level.
Source: Authors’ analysis from EU-SILC 2008.
5. D
ISCUSSIONThe results presented in the previous section show the existence of important variations in the extra cost of disability across the European countries of the sample. There are alternative explanations behind such differences that we discuss below.
In first place, part of the differences might be related to measurement problems related to the subjective nature of the disability data used in the analysis. As can be inferred from Table 1, some countries, notably Hungary, Estonia, Portugal or Slovakia, Austria and Germany declare much higher strong disability rates, around 10% or higher, than countries such as Denmark, the Netherlands or Slovenia, with strong disability rates around 5%. It could be argued that some of the differences respond to the different concept of disability applied by the respondent when filling in the survey questionnaire. If that were the case, those countries with high “statistical” disability rates would show a lower cost of disability, as part of the population considered disabled is not really so, showing therefore zero or very low extra cost and bringing down the estimated average cost of disability. We have tested whether there is a negative correlation between the strong disability rate and the cost of disability and, although such a relation holds for specific countries such as Germany (high disability rate and low disability cost, or Denmark, the opposite), it does not hold for the full sample.
The second possible explanation considered is related to one of the
methodologies used, the so called subjective-indirect. As was explained in section 3,
this methodology compares the ease or difficulty that different households have in
making ends meet with their current income, interpreting the differences in the ability of
otherwise identical households but for the presence of one of more members with
disabilities in terms of the cost of the disability. It can be argued that the ability to make
ends meet will be affected by the expectations of the households of what they are
entitled to do (what they want to do). If that is so, then societies with a strong feeling of
equal rights for disabled people and a strong culture of equality might breed higher
expectations and demands in households with disabled members and correspondingly
higher disability cost. This could explain the high cost of disability in countries with a
strong social-democratic tradition of equal opportunities such as Denmark, Sweden or
Norway. This argument seems sound, but in order to serve as a reasonable explanation
of the observed differences in disability costs, such differences should only be present
in the subjective-indirect method, and not in the second objective method. As that is not
the case, we must also reject this second explanation as a prime hypothesis for the results found.
The last explanation considered is the different living arrangements of individuals with disabilities and patterns of caring for disabled people across Europe.
Particularly, there are very important differences among the characteristics of households with disabled members in the countries of the sample. It can be argued that when people with disabilities live with parents or children who care for them, an important share of the extra cost of disability is covered by them through non-market–
and non-publicly financed- care. In contrast, if people with disabilities live on their own
in single households, then they will be more dependent on services brought from
outside the household and, hence, such costs will be more visible to our estimation
method. In order to test this hypothesis, we present several plots using cross-country
data that support it. Such figures are based on model II (the approach based on model I
yields similar but somewhat weaker correlations). Firstly, as shown by Figure 3, there
exists a negative correlation between the percentage of households with disabled
members where disabled people share residency with parents or descendants and the
estimated cost of disability. Figure 4 complements the information of the previous graph
by pointing out a positive correlation between the proportion of households with
disabled members where a disabled member lives alone and the cost of disability. Both
figures show that, on average, those countries with a higher estimated cost of disability
are also countries where disabled people tend to live more on their own. This evidence
could be explained by the fact that part of the cost of disability would be higher for
people who live alone because they need extra monetary resources to cover for their
disabilities in terms of mobility, household duties, etc. that otherwise could be taken
care of by other members of the household (outside of the market).
Figure 3. Percentage of households with disabled members where disabled people share residency with their parents or descendants and estimated disability cost
Source: Authors’ analysis from EU-SILC 2008.
Figure 4. Percentage of single-member households where the member has a disability
Source: Authors’ analysis from EU-SILC 2008.
AT BE
CY BG CZ DE
DK
EE
ES GR
HU
IE IS
IT LT
LU
LV NL
NO
PL PT
RO SE
SI
SK UK
R² = 0,480
0 20 40 60 80 100 120 140
0 10 20 30 40 50 60
Estimated cost of disability based on households' assets (% of household income)
% of households with disabled people where parents or descendants of a disabled member live
AT
BE BG
CY CZ
DE
DK
EE ES
GR
HU IE
IS
IT
LU LT LV
NL NO
PL PT
RO
SE
SI SK
UK
R² = 0,521
0 20 40 60 80 100 120 140
0 10 20 30 40 50 60 70
Estimated cost of disability based on households' assets (% of household income)
% of single-member households where the member has a disability
In other words, it becomes clear that in countries where disabled people live alone and do not share a household with their relatives (the potential and actual care givers for the disabled population and children in many European countries) and therefore do not profit from non-market services provided by the family, the cost of disability is higher. Not by chance, those countries where households with disabled members seem to support the heaviest load are also countries that have established more generous disability social protection systems. As depicted in Figure 5, there is a positive correlation between the “generosity” of disability protection programs of the different countries and the cost faced by a household with handicapped people and the median income (the R
2rises up to 0.64 if one removes Luxembourg, a clear outlier).
12One interpretation of such a relation is that social protection systems try to respond to different needs. An alternative interpretation might be that it is precisely the existence of such generous systems what allows people with disabilities to live on their own and not to be forced to be dependent on family care. A more eclectic view simply assumes that both issues (the cost of disability and disability benefits) are likely to be jointly determined, partly because living arrangements and the Welfare State are embedded in institutional and social frameworks. In this respect, it is worth making a reflection on the types of magnitudes we are dealing with. Throughout this article we have been referring to a purely monetary concept of welfare. It is plausible to assume that people with disabilities who are able to live on their own in places such as the Netherlands or the Nordic countries enjoy some non-pecuniary but valuable compensation through a higher autonomy and a greater freedom of choice, as they are not forced to depend exclusively on their relatives’ care. Some of these rewards could also be shared by their families, who would thus enjoy a greater degree of freedom when deciding whether to act as their caregivers or not.
A last remark to be made in this section refers to Luxembourg and its position at
the bottom of the rankings. The low cost in the Grand Duchy can be interpreted as a
result of an extremely high per capita income, closely related to the well-known
particularities of the country, which makes the cost of disability a lighter load for
national households.
Figure 5. Percentage of single-member households where the member has a disability
Source: Authors’ analysis from EU-SILC 2008.
6. C
ONCLUSIONThe aim of this paper has been to present for the first time a comparative analysis of the cost of disability in Europe using the EU-SILC 2008. Because of its comparative ambition, the work has also served to test the usefulness and appropriateness of the standard of living method itself in that it has provided results reasonably consistent with economic theory. The study was based on the so-called standard of living approach, using two different methodologies (one based on self-reported ability to make ends meet and the other associated with access to several items, assets and services). The first important finding of the study is that there is a significant diversity in the cost of disability as it varies across European countries. The overall pattern show Scandinavian countries at the top of the ranking and Eastern European states at the bottom. The second contribution of the article is related to the discussion of these explanatory patterns. After rejecting other hypotheses that could help to interpret the results found, such as the different expectations of people with disabilities in different countries, or
AT BE
BG
CY CZ
DE
DK
EE ES GR
HU
IE
IS
IT LT
LU
LV
NL NO
PL
PT
RO
SE
SI SK
UK
R² = 0,368
0 200 400 600 800 1.000 1.200 1.400 1.600 1.800 2.000
0 5.000 10.000 15.000 20.000 25.000 30.000 35.000 40.000 45.000
Social spending on disability (Euros in PPS)
Estimated cost of disability based on households' assets for a household with median household income (Euros in PPS)
problems related to mis-measurement of disability rates, our analysis suggests that the cost of disability is related to the living arrangements of handicapped people, that is, those who live with their relatives can enjoy some services and goods for free, while disabled people living on their own have to face higher costs and do not profit to the same extent from free care provided by the family.
Nevertheless, there is a long way to go in the study of the cost of disability in
both developed and developing countries. Disability is a quite common phenomenon in
Europe and is likely to be a more and more important problem in the coming decades
because of the ageing population. In this sense, several further research lines can be
suggested. Firstly, the findings could be reinforced by the use of databases that, apart
from income, contain more detailed and objective information on the health conditions
of individuals (even if self-reported), information which was not available when writing
this paper. In the second place, research into the extra costs of disabilities could profit
from the joint use of alternative methods of estimation (without being restricted to the
use of a single approach), combining quantitative and qualitative methods. Third, the
EU-SILC database itself offers the possibility of studying the impact of disability on
living conditions from a longitudinal perspective. In this respect, it seems particularly
relevant to explore the links between poverty and disability across Europe.
R
EFERENCESAnderson, Wayne L., Armour, Brian S., Finkelstein, Eric A. and Wiener, Joshua M.
(2010): “Estimates of State-Level Health-Care Expenditures Associated with Disability”, Public Health Reports, Vol. 125, No. 1, pp. 44-51.
Braithwaite, Jeanine and Mont, Daniel (2009): “Disability and poverty: A survey of World Bank Poverty Assessments and implications”, ALTER, European Journal of Disability, Vol. 3, No. 3, pp. 219-232.
Braña, Francisco-Javier and Antón, José-Ignacio (2011): “Pobreza, discapacidad y dependencia en España”, Papeles de Economía Española, forthcoming.
Cullinan, John, Gannon, Brenda and Lyons, Séan (2011): “Estimating the extra cost of living for people with disabilities”, Health Economics, Vol. 20, No. 5, pp. 582- 599.
European Commission (2010): Communication from the Commission to the European Parliament, the Council, the European Economic and Social Committee and the Committee of the Regions. European Disability Strategy 2010-2020: A Renewed Commitment to a Barrier-Free Europe, COM(2010) 216 final.
Indecon (2004): Cost of Disability Research Project, Dublin: National Disability Authority. Available at
http://www.nda.ie/cntmgmtnew.nsf/0/EF734FD9D0C04B3880256E690055CFF B/$File/DisabilityCost.pdf [last accessed 28
thFebruary 2011].
Jones, Andrew and O’Donnell, Owen (1995): “Equivalence scales and the costs of disability”, Journal of Public Economics, Vol. 56, No. 2, pp. 273-289.
Kuklys, Wiebke (2005): Amartya Sen’s Capability Approach. Theoretical Insights and
Empirical Applications, Heidelberg: Springer Verlag.
Lancaster, Kelvin J. (1966): “A New Approach to Consumer Theory”, Journal of Political Economy, Vol. 74, No. 2, pp. 132-157.
Martin, Jean and White, Amanda (1988): Office of Population Censuses and Surveys Report 2, the financial circumstances of disabled adults living in private households, London: Her Majesty’s Stationary Office.
Matthews, Alison and Truscott, Philip (1990): “Disability, household income and expenditure: A follow-up survey of disabled adults in the Family Expenditure Survey”, Research Report No. 2, Department of Social Security.
Mitra, Sophie, Findley, Patricia A. and Sambamoorthi, Usha (2009): “Health Care
Expenditures of Living With a Disability: Total Expenditures, Out-of-Pocket Expenses, and Burden, 1996 to 2004”, Archives of Physical Medicine andRehabilitation, Vol. 90, No. 9, pp. 1532-1540.
OECD (2003): Transforming Disability into Ability. Policies to Promote Work and Income Security for Disabled People, Paris: OECD.
OECD (2010): Sickness, Disability and Work. Breaking the Barriers, Paris: OECD.
Pascual, Marta and and Cantarero, David (2007): “Socio-demographic determinants of disabled people: An empirical approach based on the European Community Household Panel”, Journal of Socio-Economics, Vol. 36, No. 2, pp. 275-287.
Saunders, Peter (2007): “The Costs of Disability and the Incidence of Poverty”, Australian Journal of Social Issues, Vol. 42, No. 4, pp. 461-480.
Sen, Amartya (1985): Commodities and capabilities, Amsterdam: North Holland.
Sen, Amartya (1987): On Ethics and Economics, Oxford: Basil Blackwell.
Sen, Amartya (2004): “Disability and justice”, lecture delivered at the Disability and
Inclusive Development Conference, the World Bank, Washington, D.C., 1
sthttp://siteresources.worldbank.org/DISABILITY/214576-
1092421729901/20291152/Amartya_Sen_Speech.doc [last accessed 17
thMarch 2011].
She, Peiyun and Livermore, Gina A. (2007): “Material Hardship, Poverty, and Disability Among Working-Age Adults”, Social Science Quarterly, Vol. 88, No.
4, pp. 970-989.
She, Peiyun and Livermore, Gina A. (2009): “Long-Term Poverty and Disability Among Working-Age Adults”, Journal of Disability Policy Studies, Vol. 19, No.
4, pp. 244-256.
Stapleton, D., Protik, A. and Stone, Christal (2008): “Review of international evidence of the cost of disability”, Working Paper No. 542, Department for Work and Pensions.
Tibble, Mike (2005): “Review of existing research on the extra costs of disability”, Working Paper No. 21, Department for Work and Pensions.
Wilkinson-Meyers, Laura, Brown, Paul, McNeill, Robert, Patston, Philip, Dylan, Sacha and Baker, Ronelle (2010): “Estimating the additional cost of disability: Beyond budget standards”, Social Science and Medicine, Vol. 71, No. 10, pp. 1882- 1889.
Wood, Claudia and Grant, Eugene (2010): Counting the cost, London: Demos.
World Health Organization (WHO) (2011): World Report on Disability, Geneva: World Health Organization.
Zaidi, Asghar and Burchardt, Tania (2005): “Comparing Incomes When Needs Differ:
Equivalization For The Extra Costs Of Disability In The U.K.”, Review of
Income and Wealth, Vol. 51, No. 1, pp. 89-114.
F
UNDACIÓN DE LASC
AJAS DEA
HORROS DOCUMENTOS DE TRABAJOÚltimos números publicados
159/2000 Participación privada en la construcción y explotación de carreteras de peaje Ginés de Rus, Manuel Romero y Lourdes Trujillo
160/2000 Errores y posibles soluciones en la aplicación del Value at Risk Mariano González Sánchez
161/2000 Tax neutrality on saving assets. The spahish case before and after the tax reform Cristina Ruza y de Paz-Curbera
162/2000 Private rates of return to human capital in Spain: new evidence F. Barceinas, J. Oliver-Alonso, J.L. Raymond y J.L. Roig-Sabaté 163/2000 El control interno del riesgo. Una propuesta de sistema de límites
riesgo neutral
Mariano González Sánchez
164/2001 La evolución de las políticas de gasto de las Administraciones Públicas en los años 90 Alfonso Utrilla de la Hoz y Carmen Pérez Esparrells
165/2001 Bank cost efficiency and output specification Emili Tortosa-Ausina
166/2001 Recent trends in Spanish income distribution: A robust picture of falling income inequality Josep Oliver-Alonso, Xavier Ramos y José Luis Raymond-Bara
167/2001 Efectos redistributivos y sobre el bienestar social del tratamiento de las cargas familiares en el nuevo IRPF
Nuria Badenes Plá, Julio López Laborda, Jorge Onrubia Fernández
168/2001 The Effects of Bank Debt on Financial Structure of Small and Medium Firms in some Euro- pean Countries
Mónica Melle-Hernández
169/2001 La política de cohesión de la UE ampliada: la perspectiva de España Ismael Sanz Labrador
170/2002 Riesgo de liquidez de Mercado Mariano González Sánchez
171/2002 Los costes de administración para el afiliado en los sistemas de pensiones basados en cuentas de capitalización individual: medida y comparación internacional.
José Enrique Devesa Carpio, Rosa Rodríguez Barrera, Carlos Vidal Meliá
172/2002 La encuesta continua de presupuestos familiares (1985-1996): descripción, representatividad y propuestas de metodología para la explotación de la información de los ingresos y el gasto.
174/2002 Mercado único, comercio intra-industrial y costes de ajuste en las manufacturas españolas.
José Vicente Blanes Cristóbal
175/2003 La Administración tributaria en España. Un análisis de la gestión a través de los ingresos y de los gastos.
Juan de Dios Jiménez Aguilera, Pedro Enrique Barrilao González 176/2003 The Falling Share of Cash Payments in Spain.
Santiago Carbó Valverde, Rafael López del Paso, David B. Humphrey Publicado en “Moneda y Crédito” nº 217, pags. 167-189.
177/2003 Effects of ATMs and Electronic Payments on Banking Costs: The Spanish Case.
Santiago Carbó Valverde, Rafael López del Paso, David B. Humphrey
178/2003 Factors explaining the interest margin in the banking sectors of the European Union.
Joaquín Maudos y Juan Fernández Guevara
179/2003 Los planes de stock options para directivos y consejeros y su valoración por el mercado de valores en España.
Mónica Melle Hernández
180/2003 Ownership and Performance in Europe and US Banking – A comparison of Commercial, Co- operative & Savings Banks.
Yener Altunbas, Santiago Carbó y Phil Molyneux
181/2003 The Euro effect on the integration of the European stock markets.
Mónica Melle Hernández
182/2004 In search of complementarity in the innovation strategy: international R&D and external knowledge acquisition.
Bruno Cassiman, Reinhilde Veugelers
183/2004 Fijación de precios en el sector público: una aplicación para el servicio municipal de sumi- nistro de agua.
Mª Ángeles García Valiñas
184/2004 Estimación de la economía sumergida es España: un modelo estructural de variables latentes.
Ángel Alañón Pardo, Miguel Gómez de Antonio
185/2004 Causas políticas y consecuencias sociales de la corrupción.
Joan Oriol Prats Cabrera
186/2004 Loan bankers’ decisions and sensitivity to the audit report using the belief revision model.
Andrés Guiral Contreras and José A. Gonzalo Angulo
187/2004 El modelo de Black, Derman y Toy en la práctica. Aplicación al mercado español.
Marta Tolentino García-Abadillo y Antonio Díaz Pérez 188/2004 Does market competition make banks perform well?.
Mónica Melle
189/2004 Efficiency differences among banks: external, technical, internal, and managerial Santiago Carbó Valverde, David B. Humphrey y Rafael López del Paso
190/2004 Una aproximación al análisis de los costes de la esquizofrenia en españa: los modelos jerár- quicos bayesianos
F. J. Vázquez-Polo, M. A. Negrín, J. M. Cavasés, E. Sánchez y grupo RIRAG 191/2004 Environmental proactivity and business performance: an empirical analysis
Javier González-Benito y Óscar González-Benito
192/2004 Economic risk to beneficiaries in notional defined contribution accounts (NDCs) Carlos Vidal-Meliá, Inmaculada Domínguez-Fabian y José Enrique Devesa-Carpio
193/2004 Sources of efficiency gains in port reform: non parametric malmquist decomposition tfp in- dex for Mexico
Antonio Estache, Beatriz Tovar de la Fé y Lourdes Trujillo 194/2004 Persistencia de resultados en los fondos de inversión españoles
Alfredo Ciriaco Fernández y Rafael Santamaría Aquilué
195/2005 El modelo de revisión de creencias como aproximación psicológica a la formación del juicio del auditor sobre la gestión continuada
Andrés Guiral Contreras y Francisco Esteso Sánchez
196/2005 La nueva financiación sanitaria en España: descentralización y prospectiva David Cantarero Prieto
197/2005 A cointegration analysis of the Long-Run supply response of Spanish agriculture to the common agricultural policy
José A. Mendez, Ricardo Mora y Carlos San Juan
198/2005 ¿Refleja la estructura temporal de los tipos de interés del mercado español preferencia por la li- quidez?
Magdalena Massot Perelló y Juan M. Nave
199/2005 Análisis de impacto de los Fondos Estructurales Europeos recibidos por una economía regional:
Un enfoque a través de Matrices de Contabilidad Social M. Carmen Lima y M. Alejandro Cardenete
200/2005 Does the development of non-cash payments affect monetary policy transmission?
Santiago Carbó Valverde y Rafael López del Paso
201/2005 Firm and time varying technical and allocative efficiency: an application for port cargo han- dling firms
Ana Rodríguez-Álvarez, Beatriz Tovar de la Fe y Lourdes Trujillo 202/2005 Contractual complexity in strategic alliances
Jeffrey J. Reuer y Africa Ariño
203/2005 Factores determinantes de la evolución del empleo en las empresas adquiridas por opa Nuria Alcalde Fradejas y Inés Pérez-Soba Aguilar
204/2005 Nonlinear Forecasting in Economics: a comparison between Comprehension Approach versus
205/2005 Precio de la tierra con presión urbana: un modelo para España Esther Decimavilla, Carlos San Juan y Stefan Sperlich
206/2005 Interregional migration in Spain: a semiparametric analysis Adolfo Maza y José Villaverde
207/2005 Productivity growth in European banking
Carmen Murillo-Melchor, José Manuel Pastor y Emili Tortosa-Ausina
208/2005 Explaining Bank Cost Efficiency in Europe: Environmental and Productivity Influences.
Santiago Carbó Valverde, David B. Humphrey y Rafael López del Paso
209/2005 La elasticidad de sustitución intertemporal con preferencias no separables intratemporalmente: los casos de Alemania, España y Francia.
Elena Márquez de la Cruz, Ana R. Martínez Cañete y Inés Pérez-Soba Aguilar
210/2005 Contribución de los efectos tamaño, book-to-market y momentum a la valoración de activos: el caso español.
Begoña Font-Belaire y Alfredo Juan Grau-Grau
211/2005 Permanent income, convergence and inequality among countries José M. Pastor and Lorenzo Serrano
212/2005 The Latin Model of Welfare: Do ‘Insertion Contracts’ Reduce Long-Term Dependence?
Luis Ayala and Magdalena Rodríguez
213/2005 The effect of geographic expansion on the productivity of Spanish savings banks Manuel Illueca, José M. Pastor and Emili Tortosa-Ausina
214/2005 Dynamic network interconnection under consumer switching costs Ángel Luis López Rodríguez
215/2005 La influencia del entorno socioeconómico en la realización de estudios universitarios: una apro- ximación al caso español en la década de los noventa
Marta Rahona López
216/2005 The valuation of spanish ipos: efficiency analysis Susana Álvarez Otero
217/2005 On the generation of a regular multi-input multi-output technology using parametric output dis- tance functions
Sergio Perelman and Daniel Santin
218/2005 La gobernanza de los procesos parlamentarios: la organización industrial del congreso de los diputados en España
Gonzalo Caballero Miguez
219/2005 Determinants of bank market structure: Efficiency and political economy variables Francisco González
220/2005 Agresividad de las órdenes introducidas en el mercado español: estrategias, determinantes y me- didas de performance
David Abad Díaz
221/2005 Tendencia post-anuncio de resultados contables: evidencia para el mercado español Carlos Forner Rodríguez, Joaquín Marhuenda Fructuoso y Sonia Sanabria García 222/2005 Human capital accumulation and geography: empirical evidence in the European Union
Jesús López-Rodríguez, J. Andrés Faíña y Jose Lopez Rodríguez
223/2005 Auditors' Forecasting in Going Concern Decisions: Framing, Confidence and Information Pro- cessing
Waymond Rodgers and Andrés Guiral
224/2005 The effect of Structural Fund spending on the Galician region: an assessment of the 1994-1999 and 2000-2006 Galician CSFs
José Ramón Cancelo de la Torre, J. Andrés Faíña and Jesús López-Rodríguez
225/2005 The effects of ownership structure and board composition on the audit committee activity: Span- ish evidence
Carlos Fernández Méndez and Rubén Arrondo García
226/2005 Cross-country determinants of bank income smoothing by managing loan loss provisions Ana Rosa Fonseca and Francisco González
227/2005 Incumplimiento fiscal en el irpf (1993-2000): un análisis de sus factores determinantes Alejandro Estellér Moré
228/2005 Region versus Industry effects: volatility transmission Pilar Soriano Felipe and Francisco J. Climent Diranzo
229/2005 Concurrent Engineering: The Moderating Effect Of Uncertainty On New Product Development Success
Daniel Vázquez-Bustelo and Sandra Valle
230/2005 On zero lower bound traps: a framework for the analysis of monetary policy in the ‘age’ of cen- tral banks
Alfonso Palacio-Vera
231/2005 Reconciling Sustainability and Discounting in Cost Benefit Analysis: a methodological proposal M. Carmen Almansa Sáez and Javier Calatrava Requena
232/2005 Can The Excess Of Liquidity Affect The Effectiveness Of The European Monetary Policy?
Santiago Carbó Valverde and Rafael López del Paso
233/2005 Inheritance Taxes In The Eu Fiscal Systems: The Present Situation And Future Perspectives.
Miguel Angel Barberán Lahuerta
234/2006 Bank Ownership And Informativeness Of Earnings.
Víctor M. González
235/2006 Developing A Predictive Method: A Comparative Study Of The Partial Least Squares Vs Maxi- mum Likelihood Techniques.
Waymond Rodgers, Paul Pavlou and Andres Guiral.
236/2006 Using Compromise Programming for Macroeconomic Policy Making in a General Equilibrium
237/2006 Bank Market Power And Sme Financing Constraints.
Santiago Carbó-Valverde, Francisco Rodríguez-Fernández y Gregory F. Udell.
238/2006 Trade Effects Of Monetary Agreements: Evidence For Oecd Countries.
Salvador Gil-Pareja, Rafael Llorca-Vivero y José Antonio Martínez-Serrano.
239/2006 The Quality Of Institutions: A Genetic Programming Approach.
Marcos Álvarez-Díaz y Gonzalo Caballero Miguez.
240/2006 La interacción entre el éxito competitivo y las condiciones del mercado doméstico como deter- minantes de la decisión de exportación en las Pymes.
Francisco García Pérez.
241/2006 Una estimación de la depreciación del capital humano por sectores, por ocupación y en el tiempo.
Inés P. Murillo.
242/2006 Consumption And Leisure Externalities, Economic Growth And Equilibrium Efficiency.
Manuel A. Gómez.
243/2006 Measuring efficiency in education: an analysis of different approaches for incorporating non-discretionary inputs.
Jose Manuel Cordero-Ferrera, Francisco Pedraja-Chaparro y Javier Salinas-Jiménez
244/2006 Did The European Exchange-Rate Mechanism Contribute To The Integration Of Peripheral Countries?.
Salvador Gil-Pareja, Rafael Llorca-Vivero y José Antonio Martínez-Serrano 245/2006 Intergenerational Health Mobility: An Empirical Approach Based On The Echp.
Marta Pascual and David Cantarero
246/2006 Measurement and analysis of the Spanish Stock Exchange using the Lyapunov exponent with digital technology.
Salvador Rojí Ferrari and Ana Gonzalez Marcos
247/2006 Testing For Structural Breaks In Variance Withadditive Outliers And Measurement Errors.
Paulo M.M. Rodrigues and Antonio Rubia
248/2006 The Cost Of Market Power In Banking: Social Welfare Loss Vs. Cost Inefficiency.
Joaquín Maudos and Juan Fernández de Guevara
249/2006 Elasticidades de largo plazo de la demanda de vivienda: evidencia para España (1885-2000).
Desiderio Romero Jordán, José Félix Sanz Sanz y César Pérez López 250/2006 Regional Income Disparities in Europe: What role for location?.
Jesús López-Rodríguez and J. Andrés Faíña
251/2006 Funciones abreviadas de bienestar social: Una forma sencilla de simultanear la medición de la eficiencia y la equidad de las políticas de gasto público.
Nuria Badenes Plá y Daniel Santín González
252/2006 “The momentum effect in the Spanish stock market: Omitted risk factors or investor behaviour?”.
Luis Muga and Rafael Santamaría
253/2006 Dinámica de precios en el mercado español de gasolina: un equilibrio de colusión tácita.
Jordi Perdiguero García
254/2006 Desigualdad regional en España: renta permanente versus renta corriente.
José M.Pastor, Empar Pons y Lorenzo Serrano
255/2006 Environmental implications of organic food preferences: an application of the impure public goods model.
Ana Maria Aldanondo-Ochoa y Carmen Almansa-Sáez
256/2006 Family tax credits versus family allowances when labour supply matters: Evidence for Spain.
José Felix Sanz-Sanz, Desiderio Romero-Jordán y Santiago Álvarez-García
257/2006 La internacionalización de la empresa manufacturera española: efectos del capital humano genérico y específico.
José López Rodríguez
258/2006 Evaluación de las migraciones interregionales en España, 1996-2004.
María Martínez Torres
259/2006 Efficiency and market power in Spanish banking.
Rolf Färe, Shawna Grosskopf y Emili Tortosa-Ausina.
260/2006 Asimetrías en volatilidad, beta y contagios entre las empresas grandes y pequeñas cotizadas en la bolsa española.
Helena Chuliá y Hipòlit Torró.
261/2006 Birth Replacement Ratios: New Measures of Period Population Replacement.
José Antonio Ortega.
262/2006 Accidentes de tráfico, víctimas mortales y consumo de alcohol.
José Mª Arranz y Ana I. Gil.
263/2006 Análisis de la Presencia de la Mujer en los Consejos de Administración de las Mil Mayores Em- presas Españolas.
Ruth Mateos de Cabo, Lorenzo Escot Mangas y Ricardo Gimeno Nogués.
264/2006 Crisis y Reforma del Pacto de Estabilidad y Crecimiento. Las Limitaciones de la Política Econó- mica en Europa.
Ignacio Álvarez Peralta.
265/2006 Have Child Tax Allowances Affected Family Size? A Microdata Study For Spain (1996-2000).
Jaime Vallés-Giménez y Anabel Zárate-Marco.
266/2006 Health Human Capital And The Shift From Foraging To Farming.
Paolo Rungo.
267/2006 Financiación Autonómica y Política de la Competencia: El Mercado de Gasolina en Canarias.
Juan Luis Jiménez y Jordi Perdiguero.
268/2006 El cumplimiento del Protocolo de Kyoto para los hogares españoles: el papel de la imposición sobre la energía.
Desiderio Romero-Jordán y José Félix Sanz-Sanz.
269/2006 Banking competition, financial dependence and economic growth Joaquín Maudos y Juan Fernández de Guevara
271/2006 Interest Groups, Incentives to Cooperation and Decision-Making Process in the European Union A. Garcia-Lorenzo y Jesús López-Rodríguez
272/2006 Riesgo asimétrico y estrategias de momentum en el mercado de valores español Luis Muga y Rafael Santamaría
273/2006 Valoración de capital-riesgo en proyectos de base tecnológica e innovadora a través de la teoría de opciones reales
Gracia Rubio Martín
274/2006 Capital stock and unemployment: searching for the missing link
Ana Rosa Martínez-Cañete, Elena Márquez de la Cruz, Alfonso Palacio-Vera and Inés Pérez- Soba Aguilar
275/2006 Study of the influence of the voters’ political culture on vote decision through the simulation of a political competition problem in Spain
Sagrario Lantarón, Isabel Lillo, Mª Dolores López and Javier Rodrigo 276/2006 Investment and growth in Europe during the Golden Age
Antonio Cubel and Mª Teresa Sanchis
277/2006 Efectos de vincular la pensión pública a la inversión en cantidad y calidad de hijos en un modelo de equilibrio general
Robert Meneu Gaya
278/2006 El consumo y la valoración de activos Elena Márquez y Belén Nieto
279/2006 Economic growth and currency crisis: A real exchange rate entropic approach David Matesanz Gómez y Guillermo J. Ortega
280/2006 Three measures of returns to education: An illustration for the case of Spain María Arrazola y José de Hevia
281/2006 Composition of Firms versus Composition of Jobs Antoni Cunyat
282/2006