WHEN TRAINS GO FASTER THAN PLANES: THE STRATEGIC REACTION OF AIRLINES IN SPAIN
JUAN LUIS JIMÉNEZ OFELIA BETANCOR
FUNDACIÓN DE LAS CAJAS DE AHORROS DOCUMENTO DE TRABAJO
Nº 672/2012
De conformidad con la base quinta de la convocatoria del Programa de Estímulo a la Investigación, este trabajo ha sido sometido a eva- luación externa anónima de especialistas cualificados a fin de con- trastar su nivel técnico.
ISSN: 1988-8767
La serie DOCUMENTOS DE TRABAJO incluye avances y resultados de investigaciones dentro de los pro- gramas de la Fundación de las Cajas de Ahorros.
Las opiniones son responsabilidad de los autores.
WHEN TRAINS GO FASTER THAN PLANES: THE STRATEGIC REACTION OF AIRLINES IN SPAIN
Juan Luis Jiménez**
Ofelia Betancor***
Abstract
Plans for the development of high speed railways lines (HSR) in Spain are widespread. At the beginning of 2010 four HSR lines were operating in routes where the air transport mode used to be dominant. In this paper we examine through econometric means the air carriers’ reaction to these HSR entrances by using data at the route level. We test whether the HSR have changed both, the airlines’ frequencies and the market shares. Our results show that it has reduced on average the number of air transport operations by 17 percent. On the other hand the demand has increased substantially, though the weight of air transport in the total market has been reduced, as it has been reduced the weight of the dominant Spanish air carrier Iberia on air markets.
Keywords: Intermodal competition, Air transport, Rail transport.
JEL Classification: L13, L92, L93.
* We would like to thank Javier Campos, Pilar Socorro, Xavier Fageda and an anonymous for their helpful comments and suggestions. We are also grateful to Iberia and Renfe for provision of data, and to Agustín Alonso for assistance with the database. This research was undertaken within the project AEROAVE funded by the Spanish Ministry of Science and Innovation, research grant E 20/08. The responsibility for possible errors is solely ours.
** Corresponding author: Economics of Infrastructure and Transport Group (EIT). Universidad de Las Palmas de Gran Canaria. Facultad de Economía, Empresa y Turismo. Campus de Tafira. 35017. Las Palmas de Gran Canaria. España. E-mail: [email protected]; Tlf. +34 928 458 191.
** Economics of Infrastructure and Transport Group (EIT). Universidad de Las Palmas de Gran Canaria. Facultad de Economía, Empresa y Turismo. Campus de Tafira. 35017. Las Palmas de Gran Canaria. España. E-mail: [email protected]; Tlf. +34 928 458 193.
1. Introduction
High speed railways are an important driver of competition for the air transport sector. As Ivaldi and Vibes (2005) states, before 1990, aircraft and railways were considered as independent modes that could not compete given their different features, but the introduction of high speed railways (HSR) modified this scenario. Thus, in spite of differences in investments financing and public participation in both sectors, the empirical literature finds that the introduction of the HSR has a significant effect on final consumers and, therefore, on air carriers. This fact is more relevant in routes with a distance lower than 800 kilometres or with a travel time by train of less than 3 hours (IATA, 2003). In addition to speed, it is the fact that most cities’ railways stations are located in the city centre which gives the HSR the travel time advantage over the aircraft (Givoni and Banister, 2007).
The effects of the HSR upon the air sector are a well-known fact. Before the 90s there was at least one case, concretely the operation of a high-speed rail (Train à Grande Vitesse, TGV) in the line Paris-Lyon (1981, 450 kilometres), in which airlines reduced their participation almost 50 percent.
In Spain, the most evident case is the route Madrid-Seville with the introduction of the HSR in 1992. With 471 kilometres, this route experienced a reduction in the share of air transport from 40 per cent to 13 per cent. In turn the railway mode increased his share from 16 per cent to 51 per cent (Park and Ha, 2006;
or EC, 1996). At year 2010, there were three additional routes in which the HSR operates.
Competition within the air sector and the factors that affect it have been revised
profusely in the literature. Nevertheless, and in spite of the HSR entering in
many routes around the world, its effects upon air carriers have not been
studied in the same way. This paper aims to shed some light in this regard by
using a data base to the route level for the Spanish market. By econometric
means we evaluate whether the high speed rail have significantly changed the
frequency, the number of passengers and the market share of airlines. We carry
out this analysis for air carriers as a whole and also concerning the strategic behaviour of the former Spanish flag air carrier Iberia in each route.
1After this introduction, section 2 is devoted to a review of the relevant literature for the air transport sector and on intermodal competition; in section 3 we present the data base utilized for the econometric modelling discussed in section 4. Finally, section 5 is dedicated to summary and conclusions, emphasizing the negative effect upon air carriers’ operations and market share in the routes where the HSR enters.
2. Literature review
In Industrial Organization there is a vast literature analysing the influence of the market structure upon competitive variables, mainly prices and frequencies for the case of the transport sector.
The air transport mode is one of the main study focuses. Most studies relate such variables at the route level with distance, demand (population and tourism mainly) and market structure (number of competitors, concentration in the route, concentration at the origin/destination airports), among others.
2Results in all these studies are similar: the level of concentration
3in the route or at the airport affects positively final prices. Moreover the appearance of low cost air carriers has been one of the main drivers of competition in air transport market.
4Concerning the HSR appearance as a competitive mode for air transport, the number of references is lower. Three works that summarise the general evolution of such mode are Campos and Gagnepain (2009), Gourvish (2010) and Albalate and Bel (forthcoming). In the first study Campos and Gagnepain summarise the empirical evidence accumulated after more than 30 years of
1 The other main airlines for the sample considered (1999-2009) are Spanair and Air Europa.
Low costs carriers have entered in the Spanish market quite late in our sample period (around 2008), and therefore their impact should not be very significant.
2 Some examples are the papers by Borenstein (1994), Brander and Zhang (1990) or Fageda (2006) for the Spanish market.
3 The Herfindhal-Hirschmann index is the most usual concentration indicator applied in these papers. Both, total passengers and frequencies are the variables used to construct this index by routes.
4 See for example Dresner et al (1996) or Alderighi et al (2004), among others.
operation of HSR lines in terms of construction, maintenance and external costs. On the other hand Gourvish (2010) summarises the characteristics of HSR networks around the world, its current situation, and its effects upon transport and future developments perspectives. Albalate and Bel (forthcoming) review some experiences of HSR in the world and particularly in USA, focusing on its impact upon mobility, environment, the economy and urban development.
Nevertheless, the literature related to competition as exerted by HSR on airlines is more reduced than in the case of intra-modal competition for air transport. In fact most works apply choice models to determine passengers’ behaviour regarding travel options, mostly in short distance routes.
5Bilotkach
et al. (2010) is one exception. These authors demonstratetheoretically and empirically for a data base of European cities, the role played by the distance variable in the airlines’ choice to offer frequencies taking into account the road mode as another alternative for passengers. They conclude that the higher the probability of substitution by the car mode (the lower the distance), the higher the air carrier’s frequencies. Regarding the HSR’s effects upon air carriers operations, their results are inconclusive for short-haul routes.
González-Savignat (2004) studies the effect of the HSR connection between Barcelona and Madrid through experimental design techniques. The author concludes that the HSR would obtain an important market share, with travel time as an important competitive factor.
Ivaldi and Vibes (2005) carry out a theoretical simulation exercise to describe the behaviour of intermodal competition in which consumer select the mode and transport operator and the companies determine quality and prices. This scenario allows them to analyze competition in the route Cologne-Berlin, which is operated by a traditional airline (Lufthansa), three low cost air carriers and one railway (Deutsche Bahn AG). They also examine the impact of a possible liberalization of the railways and the entrance of a new operator. Their results
5 The work by Capon et al (2003) summarises part of this literature. López-Pita and Robusté (2003 and 2005) show also a descriptive analysis of HSR’s effects on air carriers in Spain.
show that prices decreases in all the alternatives and the air transport sector reduces operations in favour of the railways.
Park and Ha (2006) analyse the effects on domestic air transport demand in Korea after the HSR entrance, and estimated a reduction between 34 per cent and 75 per cent. These authors forecasted the air transport demand before the opening of the line operated by Korean Train Express in 2004, and afterwards they compare their estimates with actual demand after commencing HSR’s operations. Their results point out to the train as the main driver of such a reduction.
Martín and Nombela (2007) study the effects of investment on high-speed rail on mobility, in Spain market. They use both a gravitational model and a multinomial logit model to estimate modal transport share (road, buses, planes and trains) and passengers´s modal choice. They conclude that trains would be able to attract passengers from air and bus mode for long-haul routes (below 500 kms.). For short-haul routes, trains would be attract road users. They estimate that train market share will change from 8,9 per cent in 2000 to 22,8 per cent in 2010, including all modes.
For the route Madrid-Barcelona, Román
et al. (2007) analyse potentialcompetition between the HSR and the air transport mode, though with a perspective of disaggregated models of modal choice. Their results indicate that the HSR is more competitive in shorter routes like Madrid-Zaragoza and Barcelona-Zaragoza, than in other routes in which air traffic are more intense (Madrid-Barcelona).
Dobruszkes (2011) analyses the impact of air transport growth and intermodal competition on the environment. This paper concludes that the development of HSR supply services remains limited regarding to air transport supply. In fact the author states that in some concrete city-pairs, airlines decline the number of seats if a HSR operates, but increase the number of flights.
There is another research branch that argues in favour of cooperation (i.e. the
exploitation of the complementarity of rail and air to provide better connectivity)
instead of competition as a way to improve social welfare. It is the case of the
work by Givoni and Banister (2006) for Heathrow airport. They conclude that the
railway infrastructure should be considered as part of the airport facilities allowing obtaining efficiency gains in the slots utilization and given the reduction in environmental costs. These authors (Givoni and Banister 2007) also suggest providing an integrated transport service for medium-distance journeys (up to 800 Km.).
3. Data-base
To analyse the airlines’ behaviour when the HSR enters in a market, we make use of data to the route level on air carriers’ frequencies, passengers and market shares in the Spanish markets for nine routes with origin in Madrid and for the period January 1999 to December 2009. All the routes are operated by air transport and train services, though only in four of them is the HSR in operation at least in part of the period considered. For the remaining five routes there are plans for the future operation of HSR services as well.
Data related to air transport services on operations and passengers were obtained from the Spanish operator of airports
Aeropuertos Españoles y Navegación Aérea (AENA). These correspond to schedule direct flightsbetween Madrid-Barajas airport and the other nine airports. The Iberia market share in those routes and monthly passengers and operations were facilitated by Iberia itself. Renfe facilitated yearly data on railways’ passengers.
Table 1 includes descriptive statistics for main variables used in the analysis.
The data base has 1188 observations corresponding to 132 months. The routes average distance is 375 kilometres, with 910 operations that move 87532 air passengers per month on average. The average monthly volume of railway passengers is around 20 per cent lower than the air one. Taking into account the total passengers figure in a route for air and rail transport, we can observe that the average railway market share is around 40 per cent.
The variable Percentage of international destinations shows the share of such
destinations for a given airport on a monthly basis. It is an indicator of the
opening degree of airports (or inversely, of domestic routes airport
dependency). Madrid has a 77.5 per cent of international routes, whilst for the
other airports the average figure is 54.5 per cent.
Regarding concentration on the air transport market, Iberia has an average market share of operations and passengers higher than 70 per cent, with values not lower than 43 per cent, which shows the degree of market power of this airline on the routes analysed. It must be noted that these figures correspond jointly to Iberia and its associated company Air Nostrum.
The discrete variables try to capture the opening of Terminal 4 at Madrid- Barajas airport in February 2006, and of Terminal 3 in Barcelona airport in June 2009. They also consider the period of time in which the HSR services are in operation for the whole sample, and also for specific routes. In this regard it should be noted that only for the route Madrid-Seville is the HSR operating for the whole period of time considered.
6
6 HSR services started in 1992 in this case.
TABLE 1: DESCRIPTIVE STATISTICS
Variable Source and comments Average S.D. Minimum Maximum
Air passengers AENA. Monthly data by
route. 87532 93310.07 328 461542
Air operations AENA. Monthly data by
route. 910.5 863.5 16 4282
Train passengers
Renfe. Monthly average data by route, including all types of trains.
58945 59592 2160 222291
Distance Air distance between
airports (kilometers) 375.2 78.6 251 490
GDP per capita
INE. GDP at current prices.
Sum of GDP of origin and destination airports regions divided by sum of
population.(Thousand Euros)
22.8249 4.0479 14.2886 31.0555
Tourism per capita
INE. Encuesta de ocupación alojamientos turísticos. Sum of tourists of origin and destination airports regions divided by sum of
population.
0.103 0.022 0.061 0.181
Percentage International routes Madrid
AENA. 77.5 2.16 73.8 82.2
Percentage International routes other airports
AENA. 54.5 19.7 16.7 87.6
Iberia’s passengers share
Own elaboration using Iberia´s data. (Only air transport).
74.4 13.8 43.6 100
Iberia’s operations share
Own elaboration using Iberia´s data. (Only air transport).
72.4 16.9 45.2 100
Railways’
passengers share
Own elaboration using data from Renfe and AENA.
Total market (train + air).
38.7 30.8 2.1 99.6
Discrete variables Total Observations Average Obs. with value 1
DT4MADRID 1188 0.356 423
DT3BCN 1188 0.005 7
DHSR 1188 0.214 255
DHSR * DBCN 1188 0.019 23
DHSR * DMAL 1188 0.021 25
DHSR * DZAR 1188 0.063 75
Source: Own elaboration. S.D. is Standard Deviation.
Table 2 shows some preliminary information on the main variables per route,
distinguishing, in the case of routes with HSR, the period pre and post
implementation of HSR services. In such routes (Barcelona, Málaga and
Zaragoza), air transport monthly operations and passengers carried are
reduced after the HSR entrance. In turn, passengers transported by railway
(monthly average) increased substantially. In fact the trains’ market share
multiplies by a factor higher than three for the route Madrid-Barcelona, and
duplicates for the route Madrid-Málaga and almost monopolized the
passengers’ volume in the case of Madrid-Zaragoza. Such figures are similar to
the change described in Park and Ha (2006) for the route Madrid-Seville.
TABLE 2: AVERAGE MONTHLY DATA BY ROUTE
Route from Madrid to…
Air Passengers
Air Operations
Train passengers
(Renfe)
Distance
Iberia’s passengers
share (air market)
Air transport’s passengers
share (air plus rail market)
Date entrance
HSR
Barcelona (before HSR)
345228
(59719) 3255 (483) 51468
483
66.7 86.9 -
Barcelona (after HSR)
269217
(57966) 2806 (535) 200070 49.3 56.9 February
2008 Málaga
(before HSR)
105971
(20769) 971 (132) 46406
430
60.5 69.1 -
Málaga (after HSR)
79771
(20574) 708 (176) 120404 66.6 39.6 December
2007 Zaragoza
(before HSR)
7935 (1308) 232 (30) 45333
251
96.0 14.9 -
Zaragoza
(after HSR) 1986 (1070) 85 (37) 96009 95.9 2.2 December
2003 Seville
(HSR for all sample period)
39601
(6541) 401 (65) 189166 393 91.4 17.4 April 1992
Routes from Madrid to….(without HSR included in the period analyzed)
Alicante 62681
(11165) 636 (70) 57904 350 70.2 51.6 No HSR
Asturias 48427
(10830) 506 (86) 6648 377 75.4 87.8 No HSR
Bilbao 71663
(13693) 813 (112) 3451 319 67.1 95.2 No HSR
Santiago de Compostela
58203
(9257) 603 (95) 5024 490 64.5 91.9 No HSR
Valencia 69660
(13979) 986 (187) 56406 284 79.2 54.9 No HSR
Source: Own elaboration. Standard deviation among brackets.
Finally, it is worth noting Iberia’s behaviour concerning the starting of HSR
services. The change in its air transport market share is not so clear. In fact, but
for Barcelona, it maintains or even increases its share. For routes without HSR
services, as expected, the air transport mode is more relevant, especially for
routes connecting Madrid with cities in the North of Spain. In what follows we
aim to establish to what extent the changes observed in Table 2 are a response to the HSR entrance in the different routes.
4. Empirical strategy and estimations
4.1. The airlines’ reaction: the effects on flights frequency
In this section we analyse the effect that the introduction of HSR’ services has had on a relevant air carriers’ competitive variable: the flights frequency. It is worth to bear in mind that an alteration of such variable has important implications for airlines as they must modify their slot policy. Airport slots are a valuable asset for air companies, if they decide to reduce the number of flights offered they would necessarily have to alter the utilization of such slots or even renounce to them in the worst case.
In addition, we will consider the introduction of HSR services in Spain as an exogenous factor regarding its relationship with the air transport market or other factors such as population or the situation of the economy. In fact, the first route that started operations was Madrid-Seville with the opening of the Universal Exposition in 1992, whilst the route Madrid-Barcelona started operations 15 years later in spite of having more passengers with higher income levels.
The first equation to estimate is the following:
[1]
Where
MOitis the number of monthly operations of direct commercial flights between Madrid and destination i in the period t. To explain the choice of monthly air carriers operations for each route we take as explanatory variables the following:
1.
Air passengersit-1: it is the number of air passenger carried in those
operations between Madrid and destination i during period t-1. As expected,
this variable is positively and highly correlated with the number of
operations in the route. We applied a one period lag under the assumption
that airlines modify their behaviour by taking into account what happened in
the previous period. The number of passengers in a route is a variable that may be, in turn, affected by other variables. For this reason it has been instrumented for estimations of equation [1] (and also for equation [2]
below) through the following variables:
1.a. Tourism per capita
t: number of monthly tourists per inhabitant staying overnight in the cities analysed (sum of origin and destination of route) during period t.
1.b. GDP per capita
it: Gross Domestic Product per inhabitant (annual data) for the cities analysed (sum of origin and destination of route) during period t.
71.c.
Percentage of international routest: percentage of international destinations for each airport in period t. This variable is an indicator of airports opening degree and its type of activity.
2.
Train passengersit: number of railway passengers between Madrid and destination i, in period t (average monthly data in this case). Data for Renfe was obtained on a yearly basis, being impossible to analyse its seasonality behaviour, but its evolution throughout the time and its importance with respect to air transport.
3.
Iberia’s operations shareit: share of air carrier Iberia in the air market, in terms of operations, in route i and month t. A higher share of Iberia in the air route should negatively affect the whole set of operations, as this means a higher level of concentration in the route.
4.
Distancei: number of kilometres between Madrid and destination i. As noted in Bilotkach et al. (2010), the relationship between distance and air carriers’
frequency should be negative, though it might change in short distance routes.
5. : dummy variable that takes value 1 with the opening of Terminal 4 at Madrid-Barajas airport (February 2006). The opening of this new terminal
7 We estimated the equations also using separately sum of GDP, Average GDP and log of GDP. Estimations do not change.
meant a change of Iberia’s strategy that concentrated most of its international flights at this airport that became its main hub.
86. : dummy variable that takes value 1 for the route Madrid-Barcelona when the new Terminal 3 was opened (June 2009).
7.
DitHSR: dummy variable that takes value 1 after the entrance of the HSR in route
i during period t (see Table 2). Bilotkach et al. (2010) find for longdistance routes that airlines’ frequencies must be higher when they compete with the HSR.
8. Time: Variable that captures temporal fixed effects that may be present in the sample. It increases for each route with time.
9. : dummy variable that takes value 1 for months June, July, August and September in each route i.
10. : dummies that aim capturing destination airports fixed effects that have not been considered in previous variables.
Therefore the main objective is to observe the behaviour of variable
DitHSR in ourmodel. Nevertheless the result of such analysis would be general for the whole set of routes studied, being advisable the implementation of a differentiated analysis for each route. For this reason we substitute such dummy variable with three other ones. These are constructed by multiplying
DitHSRby the specific airport dummy (BCN for Barcelona, MAL for Málaga and ZAR for Zaragoza).
Such procedure allows capturing the effect of the HSR entrance in each of these routes. Therefore, the second equation to estimate would be the following:
8 Socorro and Betancor (2010) describe the reallocation process of airlines in Terminal 4 in Madrid and in Heathrow airport. The authors prove, by using a theoretical model, that such behaviour negatively affects competition among air transport companies.
[2]
In addition, by using Iberia’s data on operations and passengers we will be able to obtain its reaction and also the reaction of remaining air carriers. To estimate both equations we proceed by applying a Two-Stage Least Square estimator (2SLS-IV) with instrumental variables. The instruments are used to explain number of air transport passengers and are detailed in a footnote in Table 3. To determine the instruments’ validity we obtain the under-identification test and the Hansen J statistic for model over-identification (see last rows in Table 3).
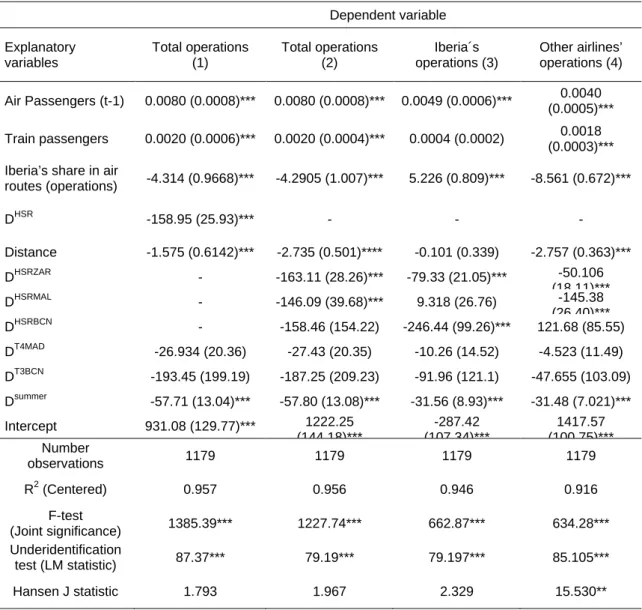
Estimates for equation [1] are reported in column (1) of Table 3, and estimates for equation [2] in column (2). The case of the reaction of Iberia and remaining air companies are shown in columns (3) and (4) respectively. These last estimates are based on two equations that are not specified in the text for the sake of simplify. The numbers corresponding to such equations would be [3]
and [4] as well. In both equations the regressors are the same as those in equation [2]. The only difference refers to the dependent variable.
9
9 To add robustness to the results we considered a cluster for standard errors. Nevertheless estimated covariance matrix of moment conditions not of full rank due to number of clusters is insufficient to calculate a robust covariance matrix. Despite this, both results (with an without cluster analysis) do not vary.
TABLE 3: ESTIMATES OF THE AIRLINES’ REACTION EQUATIONS (2SLS-IV)
Dependent variable Explanatory
variables
Total operations (1)
Total operations (2)
Iberia´s operations (3)
Other airlines’
operations (4) Air Passengers (t-1) 0.0080 (0.0008)*** 0.0080 (0.0008)*** 0.0049 (0.0006)*** 0.0040
(0.0005)***
Train passengers 0.0020 (0.0006)*** 0.0020 (0.0004)*** 0.0004 (0.0002) 0.0018 (0.0003)***
Iberia’s share in air
routes (operations) -4.314 (0.9668)*** -4.2905 (1.007)*** 5.226 (0.809)*** -8.561 (0.672)***
DHSR -158.95 (25.93)*** - - -
Distance -1.575 (0.6142)*** -2.735 (0.501)**** -0.101 (0.339) -2.757 (0.363)***
DHSRZAR - -163.11 (28.26)*** -79.33 (21.05)*** -50.106
(18 11)***
DHSRMAL - -146.09 (39.68)*** 9.318 (26.76) -145.38
(26 40)***
DHSRBCN - -158.46 (154.22) -246.44 (99.26)*** 121.68 (85.55)
DT4MAD -26.934 (20.36) -27.43 (20.35) -10.26 (14.52) -4.523 (11.49) DT3BCN -193.45 (199.19) -187.25 (209.23) -91.96 (121.1) -47.655 (103.09) Dsummer -57.71 (13.04)*** -57.80 (13.08)*** -31.56 (8.93)*** -31.48 (7.021)***
Intercept 931.08 (129.77)*** 1222.25 (144 18)***
-287.42 (107 34)***
1417.57 (100 75)***
Number
observations 1179 1179 1179 1179
R2 (Centered) 0.957 0.956 0.946 0.916
F-test
(Joint significance) 1385.39*** 1227.74*** 662.87*** 634.28***
Underidentification
test (LM statistic) 87.37*** 79.19*** 79.197*** 85.105***
Hansen J statistic 1.793 1.967 2.329 15.530**
Note 1: *** 1%, ** 5%, *10% significance test. Standard errors in brackets (robust to heteroscedasticity). Fixed effects are not included.
Note 2: Instruments for total lagged air traffic: tourism per capita, GDP per capita, percentage of international routes both in Madrid and destination.
The explanatory capacity of the model is relatively high (greater than 90 per cent in all estimates), and the joint significance of variables (F-test) is accepted at 1 per cent. The test applied to determine the validity of instruments are pass in all cases but for the Hansen J statistic for the case of explaning other airlines’
operations that can be rejected only at 95 per cent.
As expected, the variable Air passengers
it-1affects positively the number of total
monthly operations conducted by all air carriers in all models. For the case of
model [1] the variable Train passengers
itaffects also positively the airlines’
frequency, what may be interpreted as an improvement in the degree of competition, probably registering decreases in prices in response to the entry of a new operator. Nevertheless we cannot be conclusive in this regard as we do not have data on prices in our data base.
In the routes in which Iberia has a higher market share, the total number of operations decreases. This result is shared by the works of Schipper et al.
(2002), Carlsson (2004) or Bilotkach et al. (2010), who negatively relate the degree of concentration in a route with the number of operations offered.
The distance affects negatively as well the frequency of monthly flights. Most of the works find this type of relationship, though Bilotkach et al. (2010) doubt it for the case of short distance routes due to the competition effect of private cars.
The opening of the new airport terminals in Madrid and Barcelona do not seem to have modified this type of operations in any case. However operations in these routes decrease during the summer period.
Bilotkach et al. (2010) suggest that airlines are required to provide higher quality products to prevent travellers from using other transport modes. These authors find a positive effect of the HSR on air transport frequencies, except for routes with a distance lower than 550 kilometres. In our estimation we find evidence of a negative and statistically significant relationship between HSR and total number of operations. On average the number of air transport operations decreases by 158, out of a total average of 910, what means a 17 per cent reduction.
In the analysis of total operations, though considering separately the effect for each route (Equation [2]), we find that with the exception of Barcelona, in the two other airports the HSR entry brought with it a reduction in the monthly frequency, though more accused in Zaragoza than in Málaga. In the case of Barcelona, the reaction is not so evident (non significant). By routes, average decrease reaches 15 per cent in Málaga and 70 per cent in Zaragoza. This can be better understood by referring to estimations (3) and (4).
The reaction of the dominant air carrier is different to other airlines’ reaction, as
it can be observed by comparing the last two rows in Table 3. Firstly, the
volume of passengers transported by train does not seem to be a variable of interest for the whole set of operations of the Iberia company. This is not the case of other air carriers who are affected positively in their number of operations.
Secondly, Iberia’s behaviour when the HSR enters in the market is to reduce its number of operations in Barcelona and Zaragoza, but its reaction for the route Madrid-Málaga is not clear. On the contrary, Biloktach et al. (2010) argue that Iberia reaction in the route Madrid-Barcelona was to maintain operations but with smaller planes. In this regard, it is worth to note that the Iberia Group is composed of several commercial brands like Iberia, Air Nostrum and since recently, the low cost company Vueling. As explained in Fageda et al. (2011) for the case of Barcelona airport, the Iberia strategy was to move operations to its low cost carrier sister company, though this is not the case of the route Madrid- Barcelona which is mostly operated by Iberia itself.
Thirdly, other airlines operations do seem to negatively respond in Zaragoza and Málaga after the HSR entrance, though their response in Barcelona is not clear. Finally, there is evidence that a greater market share for Iberia means a reduction in the number of operation of other airlines.
In general Iberia would be reducing its operations in Barcelona an 11 per cent and a 34 per cent in Zaragoza. The other airlines would reduce theirs a 31 per cent in Málaga and would almost disappear in the route Madrid-Zaragoza.
These results are more robust than those described in Park and Ha (2006) or in other descriptive works as other possible variables affecting the air transport operations are controlled through econometric means, allowing the delimitation of the specific effects of the HSR.
It is worth to note that such percentage values differ from those that could be inferred after a simple observation of our data base as described in Table 2.
Our econometric estimates show that such descriptive results are the response to changes in several variables, including the HSR entrance, and therefore they cannot be allocated only to such entry.
10
10 In this regard, and according to data in Table 2, we might have concluded that after the entry
Finally, it is also important to realize that the presence of a dominant air carrier in an air route has an important negative effects upon other airlines operations as well that must be accounted for when examining the impact of the HSR over the airlines’ frequencies. In this sense, the former flag carrier Iberia exerts a negative impact on other airlines competitive behaviour, as Iberia high level of concentration is negatively affecting other air carriers’ level of operations.
4.2. The total passengers and market shares
In this section we conduct a similar empirical strategy to that applied in section 4.1, but we focus on how passengers by routes and market shares by mode change after the HSR entrance. The description of variables is also similar, but for the fact that variables are on a yearly basis. Therefore the number of observations is reduced to 99.
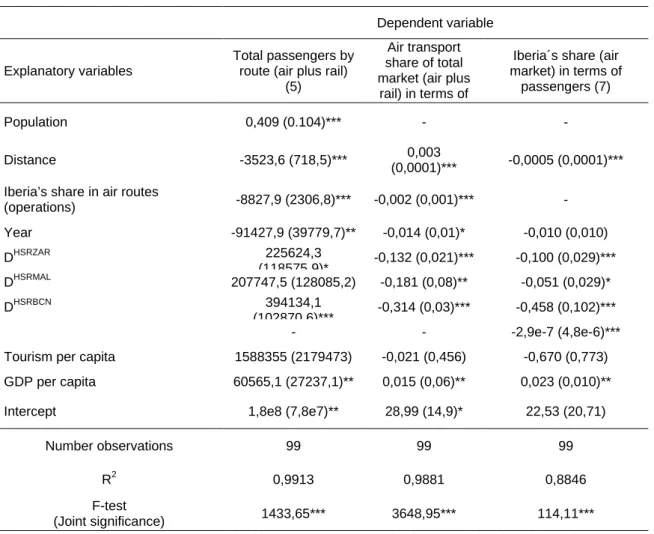
The aim here is to check whether the HSR entrance has favoured or not the market size in terms of passengers carried in the route, and to what extent it has altered the shares of airlines in the total market (air plus railways) and Iberia’s passengers share in the air transport market. Therefore three additional estimates are reported in Table 4, corresponding to equations [5], [6] and [7].
The new variables and equations of interest are:
1.
TPit: It is the Total Passengers carried in route i at year t. It includes not only air passengers but also train passengers. We expect that the entry of a new operator (HSR) will increase the number of passengers carried in routes to/from Madrid. The equation to estimate in this case is equation [5]:
[5]
of the HSR, air operations were reduced by Iberia a 36% in Barcelona, 19% in Málaga and 63%
in Zaragoza, whilst other air carriers increased theirs a 31% in Barcelona, and decrease a 38%
in Málaga and a 62% in Zaragoza. Such results would be misleading.
2.
ATSit: This variable summarizes the annual Air Transport Share in terms of passengers of the total transport market (air plus railways) for route i at year t. Following our previous results reported in Table 3, we expect to find Spanish railways as relative winners of the race on market share, i.e., the air transport share reduces after the HSR entrance. Equation [6]
refers to this estimation.
[6]
3.
ISit: It is the Iberia´s Share in terms of passengers in the air route i at year
t. In this case the relevant equation is equation [7], which tries toanalyse the impact of the HSR entrance on Iberia’s market share for the air market:
[7]
All equations have been estimated by using the Ordinary Least Squares
regression method, robust to heteroscedasticity. All equations show a high R
2and joint significance tests are not rejected.
TABLE 4: ESTIMATES OF THE TOTAL PASSENGERS AND MARKET SHARES EQUATIONS Dependent variable
Explanatory variables
Total passengers by route (air plus rail)
(5)
Air transport share of total market (air plus
rail) in terms of
Iberia´s share (air market) in terms of
passengers (7)
Population 0,409 (0.104)*** - -
Distance -3523,6 (718,5)*** 0,003
(0,0001)*** -0,0005 (0,0001)***
Iberia’s share in air routes
(operations) -8827,9 (2306,8)*** -0,002 (0,001)*** -
Year -91427,9 (39779,7)** -0,014 (0,01)* -0,010 (0,010)
DHSRZAR 225624,3
(118575 9)* -0,132 (0,021)*** -0,100 (0,029)***
DHSRMAL 207747,5 (128085,2) -0,181 (0,08)** -0,051 (0,029)*
DHSRBCN 394134,1
(102870 6)*** -0,314 (0,03)*** -0,458 (0,102)***
- - -2,9e-7 (4,8e-6)***
Tourism per capita 1588355 (2179473) -0,021 (0,456) -0,670 (0,773) GDP per capita 60565,1 (27237,1)** 0,015 (0,06)** 0,023 (0,010)**
Intercept 1,8e8 (7,8e7)** 28,99 (14,9)* 22,53 (20,71)
Number observations 99 99 99
R2 0,9913 0,9881 0,8846
F-test
(Joint significance) 1433,65*** 3648,95*** 114,11***
Note: *** 1%, ** 5%, *10% significance test. Standard errors in brackets (robust to heteroscedasticity). Fixed effects are not included.
The entrance of the HSR in the Spanish markets has produced an important impact on demand that has increased from 225 thousand passengers in Zaragoza to more than 394 thousand passengers in Barcelona. This is an average increase by 35 per cent in Zaragoza and 8,2 per cent in Barcelona.
The most important net effect is registered for the route Madrid-Zaragoza, while the most important gross effect is registered in Madrid-Barcelona. However we are not able to identify what part of it has been deviated from the road and what part is purely new generated demand.
On the other hand the air transport total market share has been also
significantly affected. After the entry of the HSR the air transport share of the
total market (expressed as a decimal) is about between 0,13 to 0,31 points
lower, and again, the greatest impact appears for the Madrid-Barcelona route.
Finally, the Iberia’s share in the air markets also reduces with the operation of the HSR, and it is for the route Madrid-Barcelona where such a decrease is more important as well.
According to our results the HSR has won the race with air carriers for the Spanish transport markets. This result is very clear in the route Madrid- Barcelona. A similar result is obtained for Madrid-Zaragoza, thought being this route the shorter one, with a number of flights that were already low at the beginning of the sample period, the entry of the HSR has led the air transport mode to a mere representative role in this case. The situation in the Madrid- Málaga route is a bit different, with estimates that show a lower significance level.
As a summary, the entry of HSR in the Spanish market has brought with it the following main results: it has increased the demand substantially; in spite of such an increase, the share of air transport in the total market has been reduced, as it has been reduced the share of the dominant Spanish air carrier Iberia on air markets.
The analysis of remaining variables is in general quite standard. For example the analysis of the distance variable indicates that the total number of passengers in the routes reduces with distance, whilst the air transport share in the markets increases.
5. Summary and Conclusions
The HSR impacts not only on the environment, mobility or on the process of
territorial integration, but also upon other competitive transport modes,
especially air transport. In spite of having available a vast amount of industrial
organization literature about competition on air transport markets, the
references regarding the HSR’s impact on the air transport sector are more
reduced. The works by Park and Ha (2006), Campos and Gagnepain (2009),
Gouvister (2010) or Albalate and Bel (2010) summarise most of the HSR
experiences throughout the world, but none of them determine specifically the
air companies’ reaction when the HSR enters the market. As far as we know,
only Biloktach et al. (2010) take into account the existence (not the effect of
HSR´s entrance) of HSR in their analysis of the effects of distance upon competition among the air sector, private cars and railways.
The first objective of our work was to delimitate the air carriers’ reaction to the entry of the HSR in terms of frequencies offered. With that aim we conduct an empirical analysis by using monthly data on air transport operations in nine Spanish routes with origin Madrid from January 1999 to December 2009.
By controlling the factors that might affect airlines’ decision when offering a given operations frequency (number of passenger, level of concentration at the air route, income, tourism, distance, fixed effects, etc.) and with a Two-Stage Least Square estimator (2SLS-IV) with instrumental variables, we arrived to the following main conclusion: the entry of the HSR in Spain, a political decision exogenous to the route’s features, has reduced on average the number of air transport operations by 17 per cent, though this result differs depending on the route and the airlines considered.
As a second objective we aimed to check whether the HSR entrance has favoured or not the market size in terms of passengers, and to what extent it has altered the shares of airlines in the total market (air plus railways) and Iberia’s passengers share in the air transport market. The empirical strategy, description of variables and period of time considered was similar to that applied to get estimates for the effect on frequencies, but for the fact that variables were on a yearly basis. For this part of our work the main conclusions are the following:
On the one hand, the entry of HSR in the Spanish markets has allowed the demand to increase between 8 to 35 per cent, depending on the routes. The most important gross effect is registered for the route Madrid-Barcelona, however we are not able to identify what part of it has been deviated from the road and what part is purely new generated demand.
On the other hand, and in spite of such an increase, the share of air transport in
the total market has been reduced. According to our results the HSR has won
the race with air carriers for the Spanish transport markets. This result is very
clear in the route Madrid-Barcelona. After the entry of the HSR the air transport
share of the total market is about between 13 to 31 points lower. Finally, the Iberia’s share in the air markets also reduces with the operation of the HSR.
In summary, the Spanish railways appear as the winners in the race for the market: they have been able to increase the number of carried passengers and market shares, whilst air carriers have had to face just the opposite situation.
The main question that arises is whether both have been competing on a level
playing field or not, as far as the HSR infrastructure investments are not
recovered through infrastructure access charges.
References
Albalate, D. and Bel, G. (forthcoming) High-Speed Rail: Lessons for Policy Makers from Experiences Abroad, Public Administration Review.
Alderighi, M., Cento, A., Nijkamp, P., Rietveld, P., (2004) The Entry of Low Cost Airlines. Tinbergen Institute Discussion Paper TI 2004-074/3.
Bilotkach, V., Fageda, X. and Flores-Fillol, R. (2010) Scheduled service versus personal transportation: the role of distance. Regional Science and Urban Economics, 40, 60-72.
Borenstein, S., Rose, N., (1994) Competition and price dispersion in the U.S.
Airline Industry. The Journal of Political Economy, 102, (4), 643-683.
Brander, J. A., and Zhang, A. (1990) A Market Conduct in the Airline Industry:
An Empirical Investigation, Rand Journal of Economics, 21, 567-583.
Campos, J., and Gagnepain, P., (2009) Measuring the intermodal effects of high-speed rail. In: De Rus, G. (Ed.), Economic Analysis of High Speed Rail in Europe. BBVA Foundation, Madrid.
Capon, P., Longo, G. and Santorini, F. (2003) Rail vs. Air transport for medium range trips. ICTS 2003. Nova-Gorica.
Carlsson, F. (2004) Prices and departures in European domestic aviation markets, Review of Industrial Organization, 24, 37-49.
Dresner, M., J.S. Chris Lin and R. Windle (1996) The impact of low-cost carriers on airport and route competition, Journal of Transport Economics and Policy, 30, 309-329.
EC (1996) Interaction between high speed and air passenger transport, interim report on the Action COST 318, European Commission, Brussels, April.
Fageda, X. (2006) Measuring conduct and cost parameters in the Spanish airline market, Review of Industrial Organization, 28, 379-399.
Fageda, X., Jiménez, J.L. and Perdiguero, J. (2011) Price rivalry in airline
markets: a study of a successful strategy of a network carrier against a low-
cost carrier, Journal of Transport Geography, 19, 658-669.
Givoni, M. and Banister, D. (2006) Airline and railway integration. Transport Policy 13, 386-397.
Givoni, M. and Banister, D. (2007) Role of the railways in the future of air transport. Transportation Planning and Technology, 30 (1), 95-112.
González-Savignat, M. (2004) Competition in air transport. Journal of Transport Economics and Policy, 38(I), 77-108.
Gourvish, T. (2010) The High-Speed Rail Revolution: History and Prospects.
Mimeo, London School of Economics.
IATA Air Transport Consultancy Services (2003) Air/rail inter-modality study.
Final Report.
Ivaldi, M. and Vibes, C. (2005) Intermodal and intramodal competition in the long-haul passenger transport markets. Idei report 9. March.
López-Pita, A. and Robusté, F. (2003) The effects of High-speed rail on the reduction of air traffic congestion. The Journal of Public Transportation, 6(1).
López-Pita, A. and Robusté, F. (2005) Impact of High speed lines in relation to very high frequency air services. The Journal of Public Transportation, 8(2), 17-36.
Martín, J.C., Nombela, G. (2007) Microeconomic impacts of investments in high speed trains in Spain, Annals of Regional Science 41, 715-733.
Park, Y. and Ha, H.K. (2006) Analysis of the impact of high-speed railroad service on air transport demand. Transportation Research parte E, 42, 95- 104.
Román, C., Espino, R. and Martín, J.C. (2007) Competition of high-speed train with air transport: the case of Madrid-Barcelona. Journal of Air Transport Management, 13, 277-284.
Schipper, Y., Rietveld, P., Nijkamp, P. (2002) European airline reform: an empirical welfare analysis, Journal of Transport Economics and Policy, 36, 189-209.
Socorro, P., and Betancor, O. (2010) The welfare effects of the allocation of
airlines to different terminals. Transportation Research parte E, 46, 236-248.
F
UNDACIÓN DE LASC
AJAS DEA
HORROSDOCUMENTOS DE TRABAJO
Últimos números publicados
159/2000 Participación privada en la construcción y explotación de carreteras de peaje Ginés de Rus, Manuel Romero y Lourdes Trujillo
160/2000 Errores y posibles soluciones en la aplicación del Value at Risk Mariano González Sánchez
161/2000 Tax neutrality on saving assets. The spahish case before and after the tax reform Cristina Ruza y de Paz-Curbera
162/2000 Private rates of return to human capital in Spain: new evidence F. Barceinas, J. Oliver-Alonso, J.L. Raymond y J.L. Roig-Sabaté 163/2000 El control interno del riesgo. Una propuesta de sistema de límites
riesgo neutral
Mariano González Sánchez
164/2001 La evolución de las políticas de gasto de las Administraciones Públicas en los años 90 Alfonso Utrilla de la Hoz y Carmen Pérez Esparrells
165/2001 Bank cost efficiency and output specification Emili Tortosa-Ausina
166/2001 Recent trends in Spanish income distribution: A robust picture of falling income inequality Josep Oliver-Alonso, Xavier Ramos y José Luis Raymond-Bara
167/2001 Efectos redistributivos y sobre el bienestar social del tratamiento de las cargas familiares en el nuevo IRPF
Nuria Badenes Plá, Julio López Laborda, Jorge Onrubia Fernández
168/2001 The Effects of Bank Debt on Financial Structure of Small and Medium Firms in some Euro- pean Countries
Mónica Melle-Hernández
169/2001 La política de cohesión de la UE ampliada: la perspectiva de España Ismael Sanz Labrador
170/2002 Riesgo de liquidez de Mercado Mariano González Sánchez
171/2002 Los costes de administración para el afiliado en los sistemas de pensiones basados en cuentas de capitalización individual: medida y comparación internacional.
José Enrique Devesa Carpio, Rosa Rodríguez Barrera, Carlos Vidal Meliá
172/2002 La encuesta continua de presupuestos familiares (1985-1996): descripción, representatividad y propuestas de metodología para la explotación de la información de los ingresos y el gasto.
Llorenc Pou, Joaquín Alegre
173/2002 Modelos paramétricos y no paramétricos en problemas de concesión de tarjetas de credito.
Rosa Puertas, María Bonilla, Ignacio Olmeda
174/2002 Mercado único, comercio intra-industrial y costes de ajuste en las manufacturas españolas.
José Vicente Blanes Cristóbal
175/2003 La Administración tributaria en España. Un análisis de la gestión a través de los ingresos y de los gastos.
Juan de Dios Jiménez Aguilera, Pedro Enrique Barrilao González 176/2003 The Falling Share of Cash Payments in Spain.
Santiago Carbó Valverde, Rafael López del Paso, David B. Humphrey Publicado en “Moneda y Crédito” nº 217, pags. 167-189.
177/2003 Effects of ATMs and Electronic Payments on Banking Costs: The Spanish Case.
Santiago Carbó Valverde, Rafael López del Paso, David B. Humphrey
178/2003 Factors explaining the interest margin in the banking sectors of the European Union.
Joaquín Maudos y Juan Fernández Guevara
179/2003 Los planes de stock options para directivos y consejeros y su valoración por el mercado de valores en España.
Mónica Melle Hernández
180/2003 Ownership and Performance in Europe and US Banking – A comparison of Commercial, Co- operative & Savings Banks.
Yener Altunbas, Santiago Carbó y Phil Molyneux
181/2003 The Euro effect on the integration of the European stock markets.
Mónica Melle Hernández
182/2004 In search of complementarity in the innovation strategy: international R&D and external knowledge acquisition.
Bruno Cassiman, Reinhilde Veugelers
183/2004 Fijación de precios en el sector público: una aplicación para el servicio municipal de sumi- nistro de agua.
Mª Ángeles García Valiñas
184/2004 Estimación de la economía sumergida es España: un modelo estructural de variables latentes.
Ángel Alañón Pardo, Miguel Gómez de Antonio
185/2004 Causas políticas y consecuencias sociales de la corrupción.
Joan Oriol Prats Cabrera
186/2004 Loan bankers’ decisions and sensitivity to the audit report using the belief revision model.
Andrés Guiral Contreras and José A. Gonzalo Angulo
187/2004 El modelo de Black, Derman y Toy en la práctica. Aplicación al mercado español.
Marta Tolentino García-Abadillo y Antonio Díaz Pérez 188/2004 Does market competition make banks perform well?.
Mónica Melle
189/2004 Efficiency differences among banks: external, technical, internal, and managerial Santiago Carbó Valverde, David B. Humphrey y Rafael López del Paso
190/2004 Una aproximación al análisis de los costes de la esquizofrenia en españa: los modelos jerár- quicos bayesianos
F. J. Vázquez-Polo, M. A. Negrín, J. M. Cavasés, E. Sánchez y grupo RIRAG 191/2004 Environmental proactivity and business performance: an empirical analysis
Javier González-Benito y Óscar González-Benito
192/2004 Economic risk to beneficiaries in notional defined contribution accounts (NDCs) Carlos Vidal-Meliá, Inmaculada Domínguez-Fabian y José Enrique Devesa-Carpio
193/2004 Sources of efficiency gains in port reform: non parametric malmquist decomposition tfp in- dex for Mexico
Antonio Estache, Beatriz Tovar de la Fé y Lourdes Trujillo 194/2004 Persistencia de resultados en los fondos de inversión españoles
Alfredo Ciriaco Fernández y Rafael Santamaría Aquilué
195/2005 El modelo de revisión de creencias como aproximación psicológica a la formación del juicio del auditor sobre la gestión continuada
Andrés Guiral Contreras y Francisco Esteso Sánchez
196/2005 La nueva financiación sanitaria en España: descentralización y prospectiva David Cantarero Prieto
197/2005 A cointegration analysis of the Long-Run supply response of Spanish agriculture to the common agricultural policy
José A. Mendez, Ricardo Mora y Carlos San Juan
198/2005 ¿Refleja la estructura temporal de los tipos de interés del mercado español preferencia por la li- quidez?
Magdalena Massot Perelló y Juan M. Nave
199/2005 Análisis de impacto de los Fondos Estructurales Europeos recibidos por una economía regional:
Un enfoque a través de Matrices de Contabilidad Social M. Carmen Lima y M. Alejandro Cardenete
200/2005 Does the development of non-cash payments affect monetary policy transmission?
Santiago Carbó Valverde y Rafael López del Paso
201/2005 Firm and time varying technical and allocative efficiency: an application for port cargo han- dling firms
Ana Rodríguez-Álvarez, Beatriz Tovar de la Fe y Lourdes Trujillo 202/2005 Contractual complexity in strategic alliances
Jeffrey J. Reuer y Africa Ariño
203/2005 Factores determinantes de la evolución del empleo en las empresas adquiridas por opa Nuria Alcalde Fradejas y Inés Pérez-Soba Aguilar
204/2005 Nonlinear Forecasting in Economics: a comparison between Comprehension Approach versus Learning Approach. An Application to Spanish Time Series
Elena Olmedo, Juan M. Valderas, Ricardo Gimeno and Lorenzo Escot
205/2005 Precio de la tierra con presión urbana: un modelo para España Esther Decimavilla, Carlos San Juan y Stefan Sperlich
206/2005 Interregional migration in Spain: a semiparametric analysis Adolfo Maza y José Villaverde
207/2005 Productivity growth in European banking
Carmen Murillo-Melchor, José Manuel Pastor y Emili Tortosa-Ausina
208/2005 Explaining Bank Cost Efficiency in Europe: Environmental and Productivity Influences.
Santiago Carbó Valverde, David B. Humphrey y Rafael López del Paso
209/2005 La elasticidad de sustitución intertemporal con preferencias no separables intratemporalmente: los casos de Alemania, España y Francia.
Elena Márquez de la Cruz, Ana R. Martínez Cañete y Inés Pérez-Soba Aguilar
210/2005 Contribución de los efectos tamaño, book-to-market y momentum a la valoración de activos: el caso español.
Begoña Font-Belaire y Alfredo Juan Grau-Grau
211/2005 Permanent income, convergence and inequality among countries José M. Pastor and Lorenzo Serrano
212/2005 The Latin Model of Welfare: Do ‘Insertion Contracts’ Reduce Long-Term Dependence?
Luis Ayala and Magdalena Rodríguez
213/2005 The effect of geographic expansion on the productivity of Spanish savings banks Manuel Illueca, José M. Pastor and Emili Tortosa-Ausina
214/2005 Dynamic network interconnection under consumer switching costs Ángel Luis López Rodríguez
215/2005 La influencia del entorno socioeconómico en la realización de estudios universitarios: una apro- ximación al caso español en la década de los noventa
Marta Rahona López
216/2005 The valuation of spanish ipos: efficiency analysis Susana Álvarez Otero
217/2005 On the generation of a regular multi-input multi-output technology using parametric output dis- tance functions
Sergio Perelman and Daniel Santin
218/2005 La gobernanza de los procesos parlamentarios: la organización industrial del congreso de los diputados en España
Gonzalo Caballero Miguez
219/2005 Determinants of bank market structure: Efficiency and political economy variables Francisco González
220/2005 Agresividad de las órdenes introducidas en el mercado español: estrategias, determinantes y me- didas de performance
David Abad Díaz
221/2005 Tendencia post-anuncio de resultados contables: evidencia para el mercado español Carlos Forner Rodríguez, Joaquín Marhuenda Fructuoso y Sonia Sanabria García 222/2005 Human capital accumulation and geography: empirical evidence in the European Union
Jesús López-Rodríguez, J. Andrés Faíña y Jose Lopez Rodríguez
223/2005 Auditors' Forecasting in Going Concern Decisions: Framing, Confidence and Information Pro- cessing
Waymond Rodgers and Andrés Guiral
224/2005 The effect of Structural Fund spending on the Galician region: an assessment of the 1994-1999 and 2000-2006 Galician CSFs
José Ramón Cancelo de la Torre, J. Andrés Faíña and Jesús López-Rodríguez
225/2005 The effects of ownership structure and board composition on the audit committee activity: Span- ish evidence
Carlos Fernández Méndez and Rubén Arrondo García
226/2005 Cross-country determinants of bank income smoothing by managing loan loss provisions Ana Rosa Fonseca and Francisco González
227/2005 Incumplimiento fiscal en el irpf (1993-2000): un análisis de sus factores determinantes Alejandro Estellér Moré
228/2005 Region versus Industry effects: volatility transmission Pilar Soriano Felipe and Francisco J. Climent Diranzo
229/2005 Concurrent Engineering: The Moderating Effect Of Uncertainty On New Product Development Success
Daniel Vázquez-Bustelo and Sandra Valle
230/2005 On zero lower bound traps: a framework for the analysis of monetary policy in the ‘age’ of cen- tral banks
Alfonso Palacio-Vera
231/2005 Reconciling Sustainability and Discounting in Cost Benefit Analysis: a methodological proposal M. Carmen Almansa Sáez and Javier Calatrava Requena
232/2005 Can The Excess Of Liquidity Affect The Effectiveness Of The European Monetary Policy?
Santiago Carbó Valverde and Rafael López del Paso
233/2005 Inheritance Taxes In The Eu Fiscal Systems: The Present Situation And Future Perspectives.
Miguel Angel Barberán Lahuerta
234/2006 Bank Ownership And Informativeness Of Earnings.
Víctor M. González
235/2006 Developing A Predictive Method: A Comparative Study Of The Partial Least Squares Vs Maxi- mum Likelihood Techniques.
Waymond Rodgers, Paul Pavlou and Andres Guiral.
236/2006 Using Compromise Programming for Macroeconomic Policy Making in a General Equilibrium Framework: Theory and Application to the Spanish Economy.
Francisco J. André, M. Alejandro Cardenete y Carlos Romero.
237/2006 Bank Market Power And Sme Financing Constraints.
Santiago Carbó-Valverde, Francisco Rodríguez-Fernández y Gregory F. Udell.
238/2006 Trade Effects Of Monetary Agreements: Evidence For Oecd Countries.
Salvador Gil-Pareja, Rafael Llorca-Vivero y José Antonio Martínez-Serrano.
239/2006 The Quality Of Institutions: A Genetic Programming Approach.
Marcos Álvarez-Díaz y Gonzalo Caballero Miguez.
240/2006 La interacción entre el éxito competitivo y las condiciones del mercado doméstico como deter- minantes de la decisión de exportación en las Pymes.
Francisco García Pérez.
241/2006 Una estimación de la depreciación del capital humano por sectores, por ocupación y en el tiempo.
Inés P. Murillo.
242/2006 Consumption And Leisure Externalities, Economic Growth And Equilibrium Efficiency.
Manuel A. Gómez.
243/2006 Measuring efficiency in education: an analysis of different approaches for incorporating non-discretionary inputs.
Jose Manuel Cordero-Ferrera, Francisco Pedraja-Chaparro y Javier Salinas-Jiménez
244/2006 Did The European Exchange-Rate Mechanism Contribute To The Integration Of Peripheral Countries?.
Salvador Gil-Pareja, Rafael Llorca-Vivero y José Antonio Martínez-Serrano 245/2006 Intergenerational Health Mobility: An Empirical Approach Based On The Echp.
Marta Pascual and David Cantarero
246/2006 Measurement and analysis of the Spanish Stock Exchange using the Lyapunov exponent with digital technology.
Salvador Rojí Ferrari and Ana Gonzalez Marcos
247/2006 Testing For Structural Breaks In Variance Withadditive Outliers And Measurement Errors.
Paulo M.M. Rodrigues and Antonio Rubia
248/2006 The Cost Of Market Power In Banking: Social Welfare Loss Vs. Cost Inefficiency.
Joaquín Maudos and Juan Fernández de Guevara
249/2006 Elasticidades de largo plazo de la demanda de vivienda: evidencia para España (1885-2000).
Desiderio Romero Jordán, José Félix Sanz Sanz y César Pérez López 250/2006 Regional Income Disparities in Europe: What role for location?.
Jesús López-Rodríguez and J. Andrés Faíña
251/2006 Funciones abreviadas de bienestar social: Una forma sencilla de simultanear la medición de la eficiencia y la equidad de las políticas de gasto público.
Nuria Badenes Plá y Daniel Santín González
252/2006 “The momentum effect in the Spanish stock market: Omitted risk factors or investor behaviour?”.
Luis Muga and Rafael Santamaría
253/2006 Dinámica de precios en el mercado español de gasolina: un equilibrio de colusión tácita.
Jordi Perdiguero García
254/2006 Desigualdad regional en España: renta permanente versus renta corriente.
José M.Pastor, Empar Pons y Lorenzo Serrano
255/2006 Environmental implications of organic food preferences: an application of the impure public goods model.
Ana Maria Aldanondo-Ochoa y Carmen Almansa-Sáez
256/2006 Family tax credits versus family allowances when labour supply matters: Evidence for Spain.
José Felix Sanz-Sanz, Desiderio Romero-Jordán y Santiago Álvarez-García
257/2006 La internacionalización de la empresa manufacturera española: efectos del capital humano genérico y específico.
José López Rodríguez
258/2006 Evaluación de las migraciones interregionales en España, 1996-2004.
Mar�